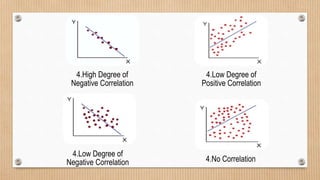
Corrrelation
Meaning
Correlation is a statistical measure that expresses the extent to which
two variables are linearly related (meaning they change together at a
constant rate). It’s a common tool for describing simple relationships
without making a statement about cause and effect.
Importance of Correlation
(i) Correlation helps us in determining the degree of relationship between
variables. It enables us to make our decision for the future course of
actions.
(ii) Correlation analysis helps us in understanding the nature and degree of
relationship which can be used for future planning and forecasting.
(iii) Forecasting without any prior correlation analysis may prove to be
defective, less reliable and more uncertain. If it is based upon the result of
correlation analysis, it will be more reliable.
Types of Correlation
1. Positive Correlation
2. Negative Correlation
3. Zero Correlation
Scatter Diagram Method
The Scatter Diagram Method is the simplest method to study the
correlation between two variables wherein the values for each pair of
a variable is plotted on a graph in the form of dots thereby obtaining
as many points as the number of observations. Then by looking at the
scatter of several points, the degree of correlation is ascertained.
Types of Scatter Diagram
1.Perfect Positive
Correlation
1.Perfect Negative
Correlation
1.High Degree of Positive
Correlation
4.High Degree of
Negative Correlation
4.Low Degree of
Positive Correlation
4.Low Degree of
Negative Correlation 4.No Correlation
Thank You

bs ppt.pptx

  • 1.
  • 2.
    Meaning Correlation is astatistical measure that expresses the extent to which two variables are linearly related (meaning they change together at a constant rate). It’s a common tool for describing simple relationships without making a statement about cause and effect.
  • 3.
    Importance of Correlation (i)Correlation helps us in determining the degree of relationship between variables. It enables us to make our decision for the future course of actions. (ii) Correlation analysis helps us in understanding the nature and degree of relationship which can be used for future planning and forecasting. (iii) Forecasting without any prior correlation analysis may prove to be defective, less reliable and more uncertain. If it is based upon the result of correlation analysis, it will be more reliable.
  • 4.
    Types of Correlation 1.Positive Correlation 2. Negative Correlation 3. Zero Correlation
  • 5.
    Scatter Diagram Method TheScatter Diagram Method is the simplest method to study the correlation between two variables wherein the values for each pair of a variable is plotted on a graph in the form of dots thereby obtaining as many points as the number of observations. Then by looking at the scatter of several points, the degree of correlation is ascertained.
  • 6.
    Types of ScatterDiagram 1.Perfect Positive Correlation 1.Perfect Negative Correlation 1.High Degree of Positive Correlation
  • 7.
    4.High Degree of NegativeCorrelation 4.Low Degree of Positive Correlation 4.Low Degree of Negative Correlation 4.No Correlation
  • 8.