Download as PDF, PPTX
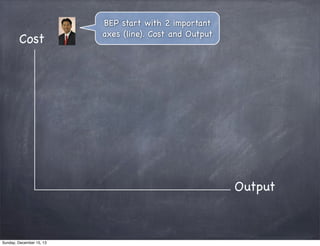
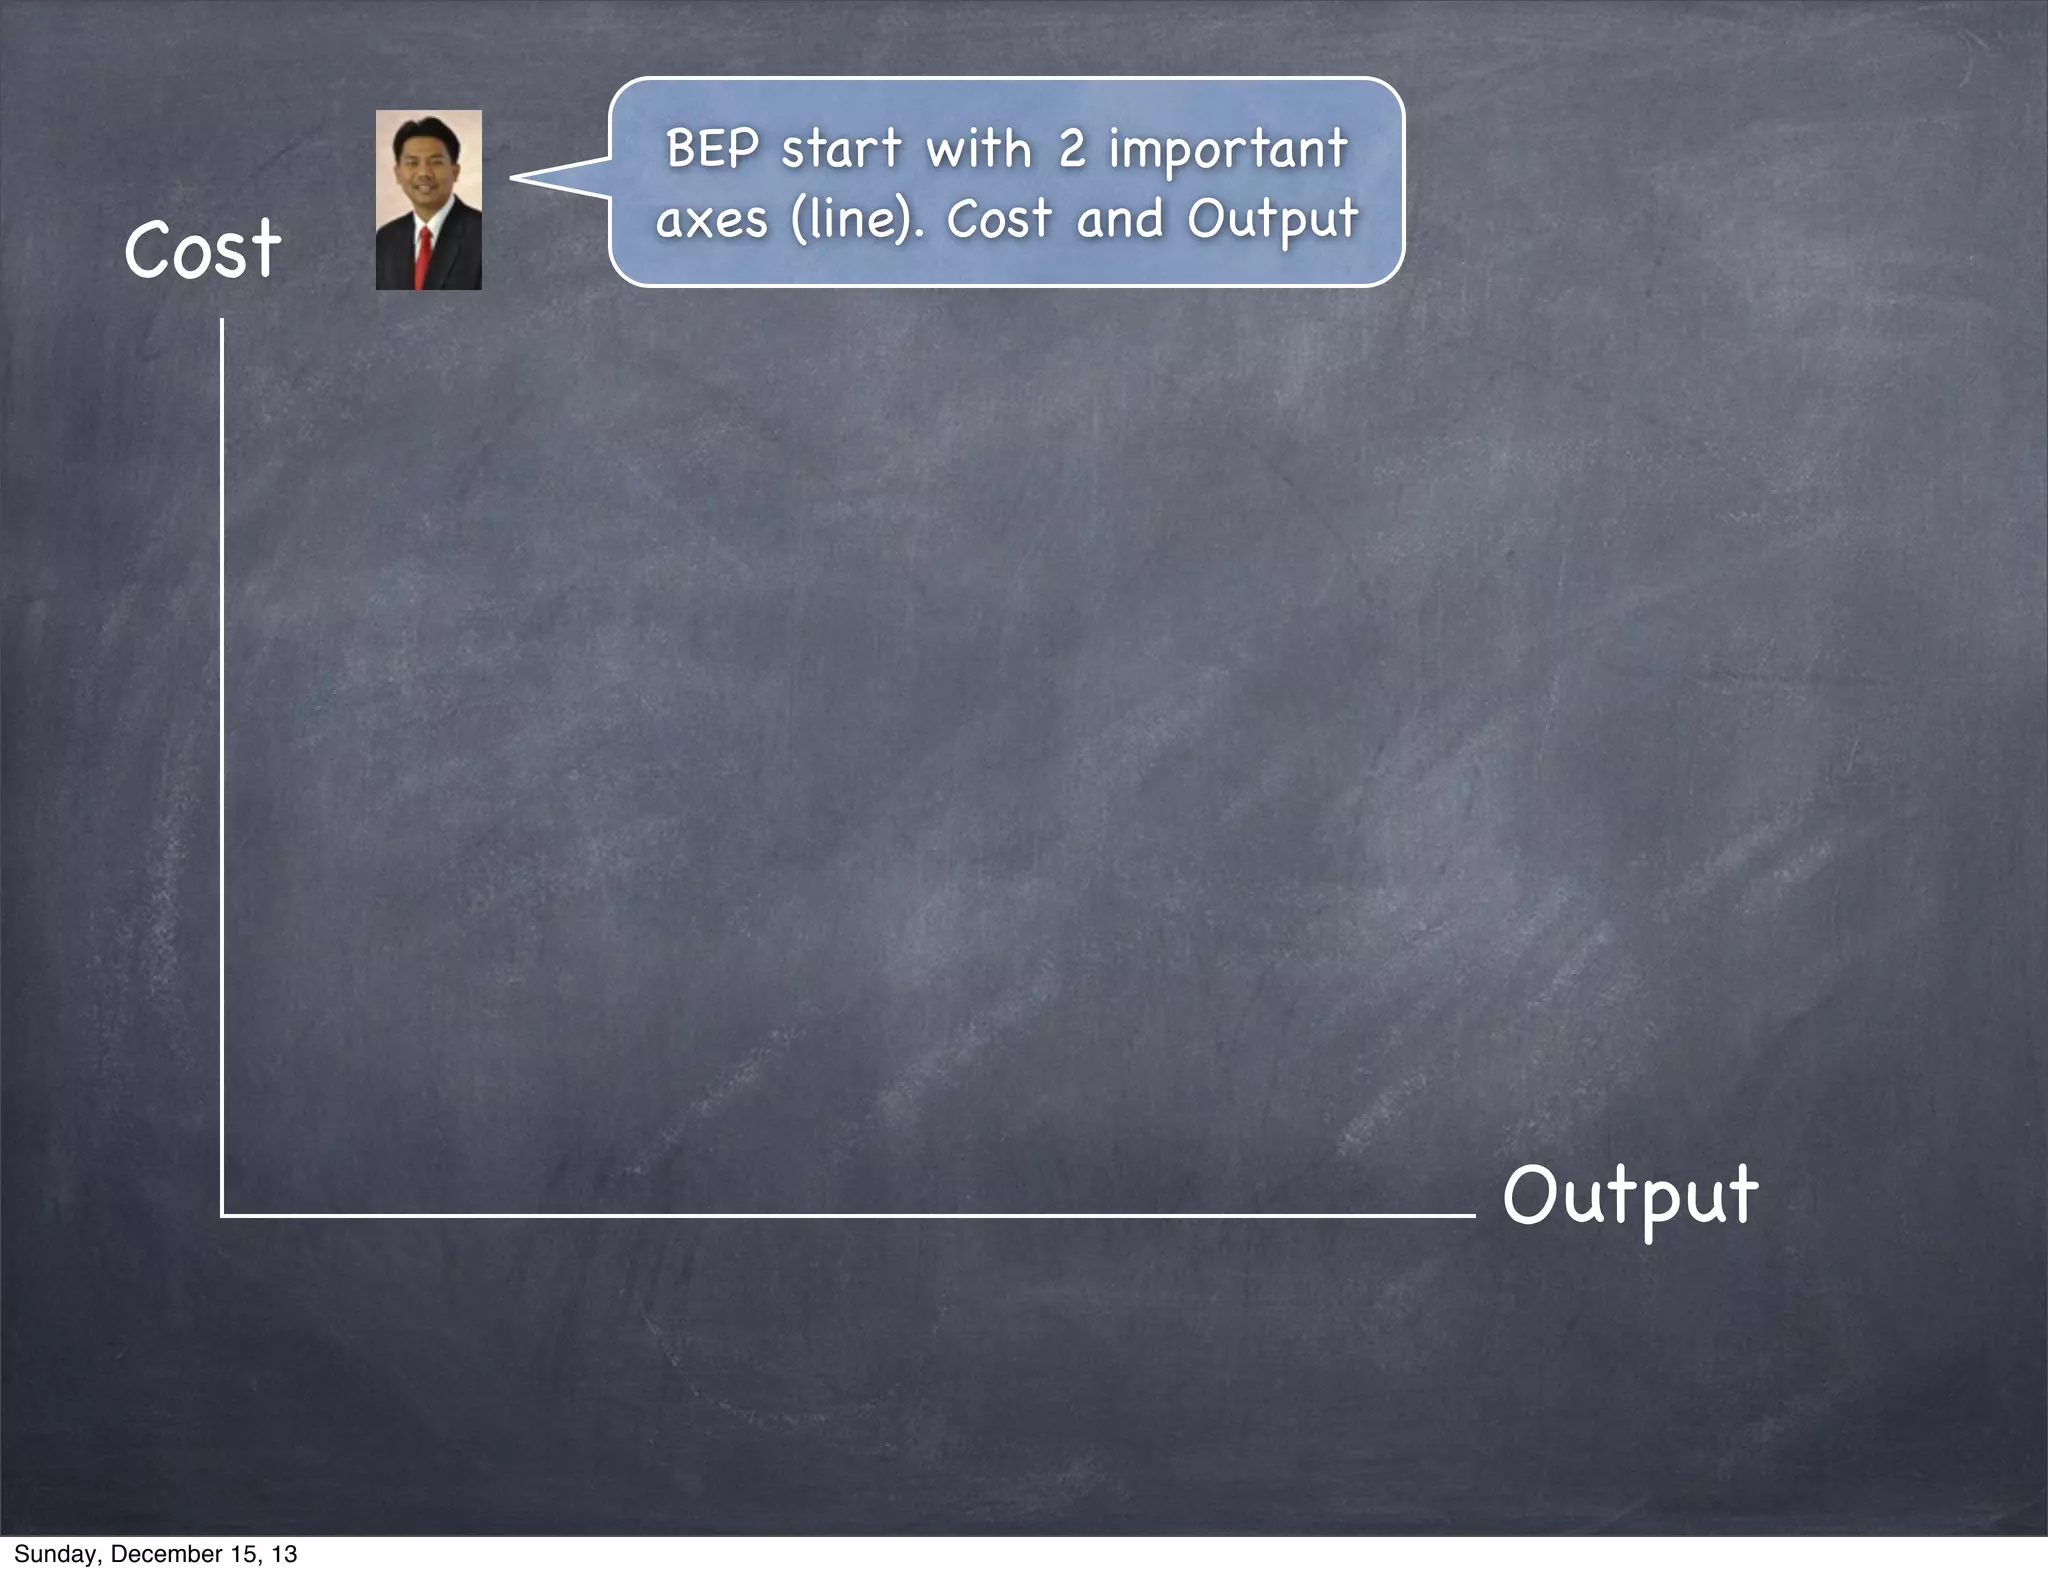
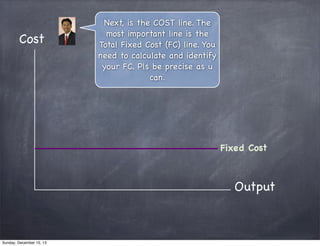
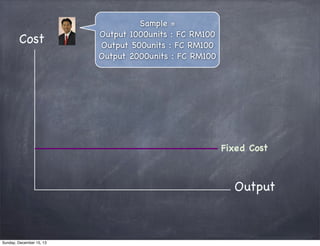
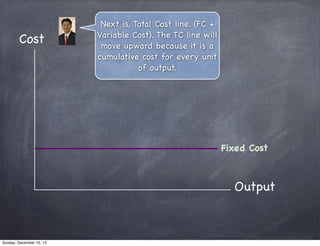
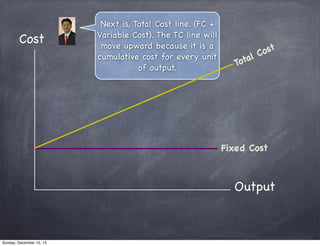
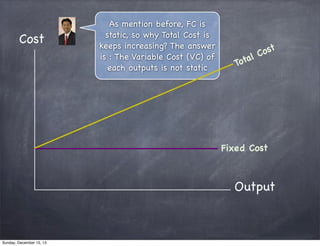
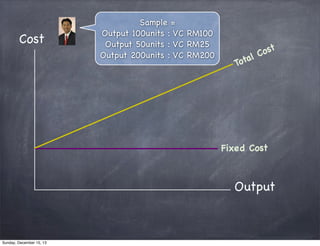
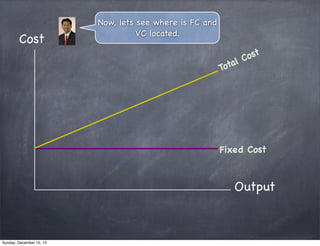
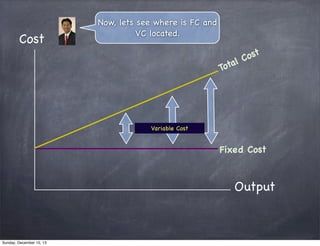
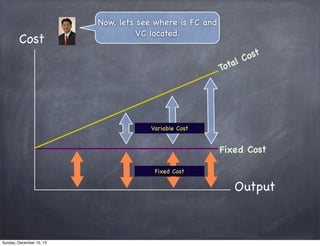
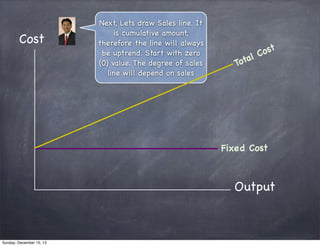
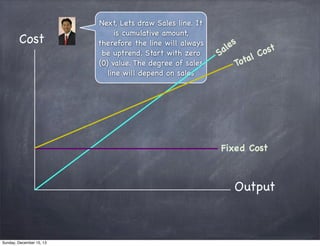
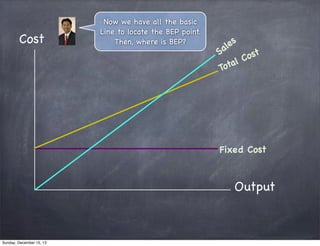
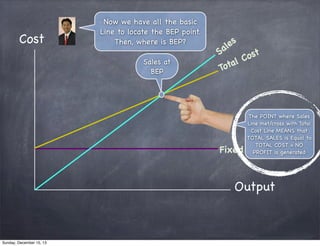
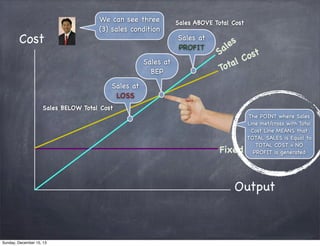
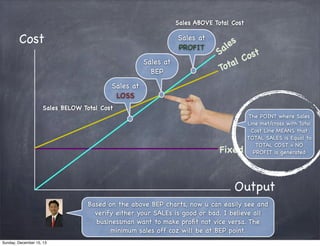
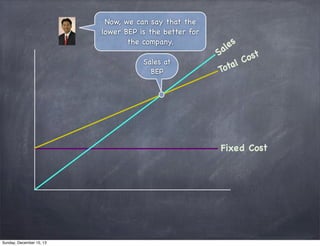
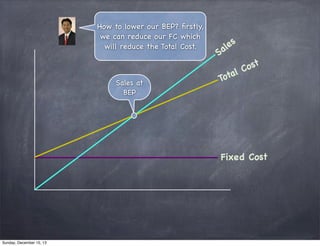
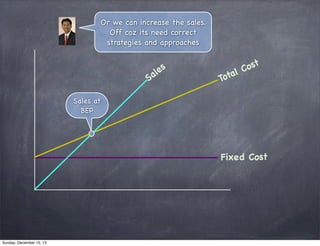
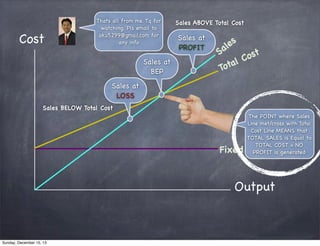

The document discusses break-even point (BEP) charts and concepts. It explains that a BEP chart has three lines: fixed costs, total costs, and sales. The point where the total costs and sales lines intersect is the break-even point, where total revenue equals total costs and there are no profits or losses. Lowering fixed costs or increasing sales can lower the break-even point, which is better for businesses as it requires less output to start generating profits.


