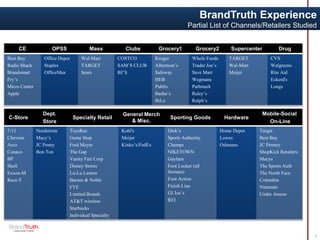
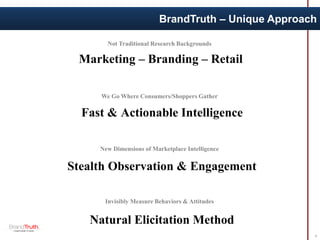
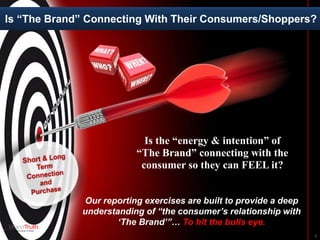
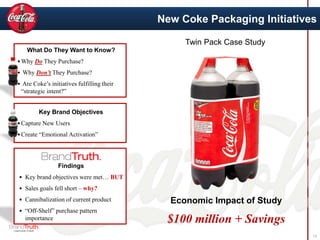
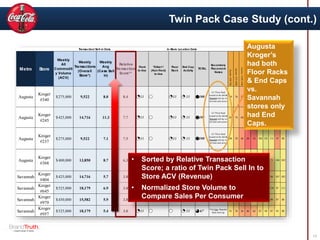
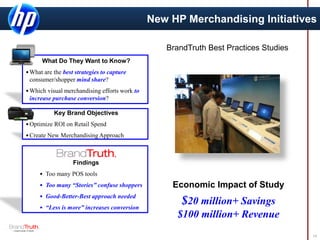
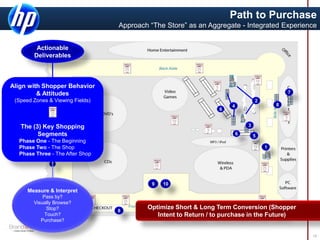
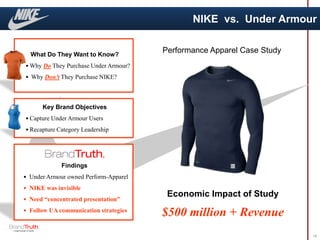
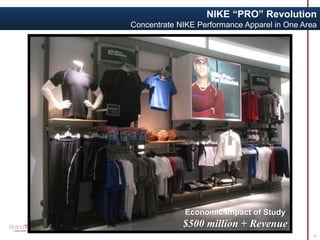
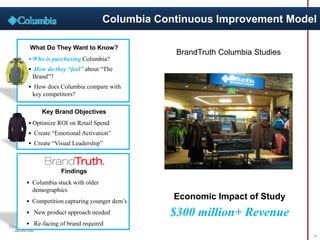
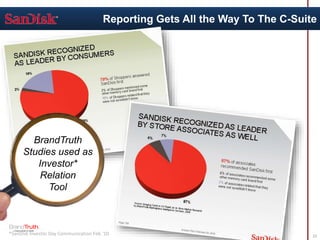
BrandTruth provides market intelligence services through unique research approaches like stealth observation and natural elicitation. They have studied shopper behavior for many large brands across various retail channels. Some key case studies discussed include analyzing the performance of new Coke packaging initiatives, evaluating HP merchandising strategies, comparing Nike and Under Armour in the performance apparel category, and providing ongoing studies to help Columbia improve. The document outlines BrandTruth's methodology of collecting both quantitative and qualitative data on various factors that influence shopper capture and abandonment rates.
Consumer Insights Overview - Premium Retail SolutionsWinston Ledet
An overview of the Premium Retail Solutions capabilities on Insights. From research on the customer journey, product specific research to competitive intelligence Premium Insights can help drive your business
best buy case study sample presentationiWriteEssays
Best buy has been facing intense competition from online stores. This is a sample presentation on the best buy case study. The presentation discusses how Best Buy Loses Customers Due to Online-Only Competitors.
I lead a team in the intense 2015 Target Case Competition. The objective of the Target Case was to find a way to enhance Target Corporation’s grocery offerings using technology. Upon further research, we were able to identify that Target’s offerings were not perceived as fresh by their consumers. The company was interested in enticing millennials with focused product assortments but they had yet to push these offerings in a way that was compelling for their desired target market. Knowing that Target often creates special experiences within each section of their stores, it is important they carry this within their grocery sections, too. Therefore, we recommend that Target Corp. install interactive digital signage within its grocery sections. We offered them uses of the digital screens and methods to calculate ROI. We also took it a step further to calculate that the expected cost of installing such technology would be roughly $2000 per store. We projected that implementing our recommendation would highlight the freshness and sustainability of Target’s grocery offerings and its value chain. We won the first place grand prize, here is our presentation.
Download a full version of the report at:
www.psfk.com/report/future-of-retail-2016
Built on a robust study of trends and patterns in the market, the 6th edition of PSFK Labs’ Future of Retail report offers a directional playbook for brands and retailers – defining 10 pillars to build a modern and engaging shopper experience strategy and go beyond expectations to create an enhanced shopper experience and therefore, build value, drive sales, and boost loyalty.
Featured within the 80+ page report, readers can find:
- 10 actions every retailer can adapt to redefine the shopper experience
- 20 key trends driving change in the marketplace
- Future service concepts for top brands
- Perspectives from leading retail experts across the globe
If you are interested in seeing a presentation of this report or would like to understand how PSFK can help your team ideate new possibilities for your brand, contact us at sales@psfk.com
Vol. 6 | Published November 2015
All rights reserved. No parts of this publication may be reproduced without the written permission of PSFK Labs.
How to monitor FMCG brand in the Internet? (EN)Kwit Analytics
Have you ever wondered:
• How to effectively monitor the e - FMCG market and your brand there?
• What is the easiest way to get the latest information on pricing, promotion and availability of your products in major supermarkets in the country?
• How to stay ahead of your competition due to effective monitoring of internet search engines?
• What tool will best help you in effective analysis ?
The Missing Piece to Conversion Rate OptimizationValentin Radu
We all want to maximize the impact from A/B testing. Yet, you’re still coming up with ideas and test hypotheses using conversion rate optimization best practices, user experience tricks and on page tactics, that only get you a marginal lift. What you’re missing is a deep understanding of the marketplace. In this session, you’ll learn how to evaluate your product market fit and apply market insight to your CRO testing approach.
If you want to see the video recording, head to https://www.youtube.com/watch?v=vX1UreOI9CQ
Check our blog as well for more webinars and conversion rate topics. https://blog.omniconvert.com/
AB Minerals Corp. - A New Separation Techmology to Process Tantalite Bearing ...Curt Huber
AB Minerals has developed a new processing technology to produce metallurgical grade Tantalum powder and Niobium hydroxide, from industrial scale processing plants using Certified Conflict-Free ore
AB Minerals Corp. - A New Separation Techmology to Process Tantalite Bearing ...Curt Huber
AB Minerals has developed a new processing technology to produce metallurgical grade Tantalum powder and Niobium hydroxide, from industrial scale processing plants using Certified Conflict-Free ore
With the proliferation of e-Commerce platforms making it easier that ever to sell products online, it is increasingly difficult for brands to stand out.
In this week's webinar, Ogilvy Consulting's Pierre Kremer will take us through the retailing landscape and how brands can matter in e-Commerce.
Q4 Product Advertising Strategy for Retail Brand Manufacturers & SuppliersTinuiti
How retail brands and suppliers should approach the holiday shopping season on Amazon and with other big box retailers like Costco, Best Buy, and Walmart.
The New Commerce Conference: The Omni-channel ImperativeCatalyst
Presentation:
The Age of Omni-Commerce & What It Means for Marketing Strategies
Welcome to the age of omni-commerce. From Google to Amazon, and from Instagram to Instacart, commerce is happening all around us. It is ubiquitous and omni-present. What does this mean for brands?
It means that omni-channel strategies are more critical than ever. Join this presentation as we size up the omni-channel opportunity and share tips for planning and activating an effective omni-channel program.
You’ll discover how to capitalize on commerce opportunities across search, social, retail media, and emerging programmatic channels like connected TV, audio, digital out-of-home, and more.
Panel:
Less Silos, More Symbiosis: Omni-Channel Strategies to Drive In-Store & Ecomm Sales
Many marketers take separate and siloed approaches to in-store and ecommerce marketing. It’s time to rethink this approach. As the digital ecosystem continues to drive purchase behavior across in-store and ecommerce, brands must identify and capitalize on synergies across online and in-store.
Join our panel discussion to learn how to get started. You’ll hear from commerce experts as they discuss their omni-channel journeys and share how they’ve broken down silos to drive better performance both online and in-store.
Maximize Sales Despite Inflation: The Power of Local & Global In-Store InsightsPersiphanieArellano
During this webinar you’ll learn how to:
-Determine competitive pricing and promotional activities for your product category
-Understanding inflation’s effect on shopping and consumption
-How the right data and insights can help you navigate the current market condition
Radius shopper marketing - the full storyJohn Storey
1. What is shopper marketing all about?
2. The retailer
3. Shopper Vs. Consumer
4.1. Shopper ergonomics
4.2. Shopper behaviour
5. Great shopper marketing
6. Shopper research
Enhance your audiences knowledge with this well researched complete deck. Showcase all the important features of the deck with perfect visuals. This deck comprises of total of sixty seven slides with each slide explained in detail. Each template comprises of professional diagrams and layouts. Our professional PowerPoint experts have also included icons, graphs and charts for your convenience. All you have to do is DOWNLOAD the deck. Make changes as per the requirement. Yes, these PPT slides are completely customizable. Edit the colour, text and font size. Add or delete the content from the slide. And leave your audience awestruck with the professionally designed Retail Management Power Point Presentation Slides complete deck
Marketing Management Process PowerPoint Presentation Slides SlideTeam
Presenting this set of slides with name - Marketing Management Process Powerpoint Presentation Slides. This complete deck is oriented to make sure you do not lag in your presentations. Our creatively crafted slides come with apt research and planning. This exclusive deck with seventy three slides is here to help you to strategize, plan, analyse, or segment the topic with clear understanding and apprehension. Utilize ready to use presentation slides on Marketing Management Process Powerpoint Presentation Slides with all sorts of editable templates, charts and graphs, overviews, analysis templates. It is usable for marking important decisions and covering critical issues. Display and present all possible kinds of underlying nuances, progress factors for an all inclusive presentation for the teams. This presentation deck can be used by all professionals, managers, individuals, internal external teams involved in any company organization.
"You can download this product from SlideTeam.net"
Enhance your audiences knowledge with this well researched complete deck. Showcase all the important features of the deck with perfect visuals. This deck comprises of total of sixstyseven slides with each slide explained in detail. Each template comprises of professional diagrams and layouts. Our professional PowerPoint experts have also included icons, graphs and charts for your convenience. All you have to do is DOWNLOAD the deck. Make changes as per the requirement. Yes, these PPT slides are completely customizable. Edit the colour, text and font size. Add or delete the content from the slide. And leave your audience awestruck with the professionally designed Retail Management Power Point Presentation Slides complete deck. https://bit.ly/3DYWptk
2. BrandTruth Clients
BrandTruth has enjoyed recurring contracts from large brand-marketers
looking to gain an edge on competition utilizing our unique research
approaches & actionable reporting.
2
3. BrandTruth Experience
Partial List of Channels/Retailers Studied
3
CE OPSS Mass Clubs Grocery1 Grocery2 Supercenter Drug
Best Buy
Radio Shack
Brandsmart
Fry’s
Micro Center
Apple
Office Depot
Staples
OfficeMax
Wal-Mart
TARGET
Sears
COSTCO
SAM’S CLUB
BJ’S
Kroger
Albertson’s
Safeway
HEB
Publix
Basha’s
BiLo
Whole Foods
Trader Joe’s
Save Mart
Wegmans
Pathmark
Raley’s
Ralph’s
TARGET
Wal-Mart
Meijer
CVS
Walgreens
Rite Aid
Eckerd's
Longs
C-Store
Dept.
Store
Specialty Retail
General Merch
& Misc.
Sporting Goods Hardware
Mobile-Social
On-Line
7-11
Chevron
Arco
Conaco
BP
Shell
Exxon-M
Race-T
Nordstrom
Macy’s
JC Penny
Bon Ton
ToysRus
Game Stop
Fred Meyer
The Gap
Vanity Fair Corp
Disney Stores
Lu-Lu Lemon
Barnes & Noble
FYE
Limited Brands
AT&T wireless
Starbucks
Individual Specialty
Kohl's
Meijer
Kinko’s/FedEx
Dick’s
Sports Authority
Champs
NIKETOWN
Gaylans
Foot Locker (all
formats)
Foot Action
Finish Line
GI Joe’s
REI
Home Depot
Lowes
Oshmans
Target
Best Buy
JC Penney
ShopKick Retailers
Macys
The Sports Auth
The North Face
Columbia
Nintendo
Under Amour
4. BrandTruth – Unique Approach
4
Not Traditional Research Backgrounds
New Dimensions of Marketplace Intelligence
Invisibly Measure Behaviors & Attitudes
We Go Where Consumers/Shoppers Gather
Marketing – Branding – Retail
Natural Elicitation Method
Stealth Observation & Engagement
Fast & Actionable Intelligence
5. 5
Is the “energy & intention” of
“The Brand” connecting with the
consumer so they can FEEL it?
Our reporting exercises are built to provide a deep
understanding of “the consumer’s relationship with
‘The Brand’”… To hit the bulls eye.
Is “The Brand” Connecting With Their Consumers/Shoppers?
6. 6
BrandTruth – How do we do it?
Stealth Immersion
Stealth
Engagement
Natural elicitation
goes “beneath the
surface” to discover
the keys to behavior
& attitudes of
Consumers AND
Store Personnel(1)
Data Collecting
Standardization
Exacting data integrity
methodology enforced.
Information is recorded
immediately.
Incongruities tracked/
extremes discarded.
“Observers” are
“close to the action”
but stay “invisible”.
Stealth
Observation
8. BrandTruth systematically dissects
shopper behavior BEFORE the
purchase is made and while external
factors still have an opportunity to
influence.
Source: ConsumerReports.org survey 2010 ;N= ± 11,000
Do Your Answers Come Too Late?
8
Existing data sources report on successes, failures and areas for improvement
AFTER the purchase has been made.
9. ALL Contributing Factors Will Be Discovered
Relationship and
effect is sometimes
linear and
predictable in
nature,
…but more times than
not, have disparate
relationships based on
shopper profiles
Merchandising
Effectiveness
Associate
Influences
Mass Media
Brand
Loyalties
Legacy Plans
And
Resistance To
Change
Role Of Dept
Set & Flow
Shopper Pre-
Disposition
Brand/
Model
Capture &
Abandonment
9
10. 10
(1) Per 100 shoppers entering the sales area (See methodology section for qualifying details)
(2) As a subset of section#1( See methodology section for scoring metric and processes
1
Brand/Model A Brand/Model B Brand/Model C Brand/Model D
Best Buy 24 16 7 4
Costco 17 14 12 6
Radio Shack 11 11 13 9
U.S Cellular 22 10 11 5
Walmart 20 14 13 9
2
Brand/Model A Brand/Model B Brand/Model C Brand/Model D
Best Buy 17 15 6 3
Costco 10 13 11 5
Radio Shack 4 10 12 8
U.S Cellular 15 9 10 4
Walmart 13 13 12 8
3
Brand/Model A Brand/Model B Brand/Model C Brand/Model D
Best Buy 71% 94% 86% 75%
Costco 59% 93% 92% 83%
Radio Shack 36% 91% 92% 89%
U.S Cellular 68% 90% 91% 80%
Walmart 65% 93% 92% 89%
Shopper Capture Rate (1)
Shopper Abandonment Rate (2)
Shopper Abandonment to Capture Rate
Scorecard - Brand/Model Capture & Abandonment
… paves the way for deeper understanding and on-going
improvement of retail practices.
Drill Down Opportunities
(quantitative AND qualitative)
• How long does shopper interact before
abandon
• Does quality/functionality of demo come into
play
• Associate role on abandonment
Drill Down Opportunities
(quantitative AND qualitative)
• How can we improve score across ALL
retailers?
• How can we divine best practices from top
scorers?
Drill Down Opportunities
(quantitative AND qualitative)
• What merchandising elements assist the
capture?
• How does the typical store layout and
product set contribute?
• Associate role on capture
The Result Is a Top-To-Bottom Approach To Data Gathering and Interpretation
12. New Coke Packaging Initiatives
Twin Pack Case Study
12
What Do They Want to Know?
•Why Do They Purchase?
• Why Don’t They Purchase?
• Are Coke’s initiatives fulfilling their
“strategic intent?”
Key Brand Objectives
•Capture New Users
•Create “Emotional Activation”
Findings
• Key brand objectives were met… BUT
• Sales goals fell short – why?
• Cannibalization of current product
• “Off-Shelf” purchase pattern
importance
Economic Impact of Study
$100 million + Savings
13. Twin Pack Case Study (cont.)
Metro Store
Weekly
All
Commodit
y Volume
(ACV)
Weekly
Transactions
(Overall
Store*)
Weekly
Avg
(Case Sell
in)
Relative
Transaction
Score**
Front
In-line
"Other*/
(Non Front)
In-line
Floor
Rack
End Cap
Activity
TOTAL
Secondary
Placement
Notes
Income-$50-75K
Income-$75-100K
Income-$100-150K
Income-$150-200K
Income-$200K+
HHsWithChildrenAge0-5Only
HHsWithChildrenAge6-17Only
HHsWithChildrenInBothRanges
CollegeGrad
WeightedDemographicIndex
Augusta
Kroger
#340
275,000$ 9,522 8.0 8.4 33 33 33 100
(2) *Floor Rack
located in the deli &
Branded end cap on
the back aisle across
89 76 59 37 38 98 90 80 75 85
Augusta
Kroger
#245
425,000$ 14,716 11.3 7.7 33 33 33 100
(2) *Floor Rack
located in the deli &
Branded end cap on
the back aisle across
84 74 64 61 80 117 101 90 98 99
Augusta
Kroger
#237
275,000$ 9,522 7.1 7.5 33 33 33 100
(2) *Floor Rack
located in the deli &
Branded end cap on
the back aisle across
98 70 46 20 24 104 131 111 47 88
Augusta
Kroger
#368
400,000$ 13,850 8.7 6.3 33 33 33 100
(2) *Floor Rack
located in the deli &
Branded end cap on
the back aisle across
103 90 83 93 124 97 71 71 146 102
Savannah
Kroger
#404
425,000$ 14,716 5.7 3.8 33 33 67
*On Branded Back
End Cap
106 100 83 59 41 109 99 84 107 102
Savannah
Kroger
#645
525,000$ 18,179 6.9 3.8 33 33 67
*On Branded Back
End Cap
104 96 92 83 83 134 98 119 97 111
Savannah
Kroger
#979
450,000$ 15,582 5.9 3.8 33 33 67
*On Branded Back
End Cap
84 69 59 49 92 82 91 88 87 88
Savannah
Kroger
#957
525,000$ 18,179 5.4 3.0 33 33 67
*On Non- Branded
Back End Cap
91 76 56 46 64 87 94 87 95 90
Transaction/ Sell-in Data In-Store Location Data Demographic Data
• Sorted by Relative Transaction
Score; a ratio of Twin Pack Sell In to
Store ACV (Revenue)
• Normalized Store Volume to
Compare Sales Per Consumer
Augusta
Kroger’s
had both
Floor Racks
& End Caps
vs.
Savannah
stores only
had End
Caps.
13
14. New HP Merchandising Initiatives
BrandTruth Best Practices Studies
14
What Do They Want to Know?
•What are the best strategies to capture
consumer/shopper mind share?
•Which visual merchandising efforts work to
increase purchase conversion?
Key Brand Objectives
•Optimize ROI on Retail Spend
•Create New Merchandising Approach
Findings
• Too many POS tools
• Too many “Stories” confuse shoppers
• Good-Better-Best approach needed
• “Less is more” increases conversion
Economic Impact of Study
$20 million+ Savings
$100 million+ Revenue
15. Path to Purchase
Approach “The Store” as an Aggregate - Integrated Experience
15
1
6
3
5
7
8
9 10
3
5
6
7
8
9
10
6
2
4
Actionable
Deliverables
Align with Shopper Behavior
& Attitudes
(Speed Zones & Viewing Fields)
The (3) Key Shopping
Segments
Phase One - The Beginning
Phase Two - The Shop
Phase Three - The After Shop
Measure & Interpret
Pass by?
Visually Browse?
Stop?
Touch?
Purchase?
Optimize Short & Long Term Conversion (Shopper
Intent to Return / to purchase in the Future)
16. NIKE vs. Under Armour
Performance Apparel Case Study
16
What Do They Want to Know?
• Why Do They Purchase Under Armour?
• Why Don’t They Purchase NIKE?
Key Brand Objectives
• Capture Under Armour Users
• Recapture Category Leadership
Findings
• Under Armour owned Perform-Apparel
• NIKE was invisible
• Need “concentrated presentation”
• Follow UA communication strategies
Economic Impact of Study
$500 million + Revenue
18. Columbia Continuous Improvement Model
BrandTruth Columbia Studies
18
What Do They Want to Know?
• Who is purchasing Columbia?
• How do they “feel” about “The
Brand”?
• How does Columbia compare with
key competitors?
Key Brand Objectives
• Optimize ROI on Retail Spend
• Create “Emotional Activation”
• Create “Visual Leadership”
Findings
• Columbia stuck with older
demographics
• Competition capturing younger dem’s
• New product approach needed
• Re-facing of brand required
Economic Impact of Study
$300 million+ Revenue
20. Retail Visual Share Update 2009 vs. 2010
20
0.0% 5.0% 10.0% 15.0% 20.0% 25.0% 30.0% 35.0% 40.0%
TNF
CSC
Private Label
Under Armour
Carhartt
Burton
Mt Hardwear
White Sierra
Timberland
Marmot
Patagonia
Kuhl
Wolverine
All Others
2010 2011
21. Summary of Key Findings – Product “A” Shoppers
21
Early
Adopter
Progressive
Middle Adopter
&
Middle Adopter
Main Stream
Elite Shopper
• Sees themselves as early adopters
• Often “mavens”
• “Active Shopper” that moves slower and stops to
investigate more often and for longer periods of time…
they connect the dots…
Progressive Middle Adopter
• Often sees themselves as early adopters
• Must be “attracted”
• Once “attracted” – is often open to new
initiatives
• Triggers “middle adopter” usage
Main Stream
• Pragmatic Functionality
• Often Price Driven
Here
we
are…
Here’s
where
we
were
BrandTruth is a unique marketplace research company that provides intelligence services for decision makers working for large brand-marketers.
We do not have “traditional research” backgrounds. We come from retail, marketing and branding backgrounds. We utilize a unique methodology we call “Stealth Observation and Engagement.” We observe and engage shoppers without them knowing who we are.
BrandTruth has expertise in visual merchandising as well as shopper behavior and attitudes. We report on how our clients’ initiatives are connecting (or not) with the shopper/consumer.
This slide is a backgrounder to set up how BrandTruth investigates product categories. Big brands have reams data, but often a they end up measuring things after the horse is out of the barn…because most of info you get is based on sales – this information tells the brands what they did right… but not what they did wrong; what they missed; what their competitors did or didn’t do right (best practices.)
This is a jumping off point for slide 11… it is to speak to the point that when we frame a project we start by going after specific key points of discovery (based on client objectives)… but significant, and relevant, amounts of related intelligence reveals itself in the course of the studies. What happens more than not is you have a more chaotic interaction (lower right) of key influencers toward impacting consumer/shopper behaviors… it is usually not a linear situation…
So… BrandTruth starts by conducting systematic data collection focused on one data point – and then other things reveal themselves. If the brand can correct one variable how will it impact optimization at retail? So BrandTruth looks at big rocks (big variables) then drill down opportunities reveal themselves – these are both quantitative and qualitative… sales figures don’t tell the brand what they missed – so once you start quantifying in the store – things unveil. The brand knows it’s market share, but does it know it’s “opportunity share” (i.e. how much of the brand’s “opportunity” is it converting)?... What are the variables by retail chain that have to be overcome? Brand sales numbers are fairly predictable across retailers depending on certain factors – if things are normalized – but are they truly measuring the components that are contributing to these sales numbers? Start with the lay of the land, then dig down from there; we start with largest boulders and those feed into the inquiries on the right. This is the foundation of a BrandTruth model for any project and the makings of a long term strategic tool (continuous improvement model) for the client brand. Our clients have to look at efficiency models – how do they optimize what they’re spending on and executing? Big brands find their biggest challenges and try to figure out how to optimize their efforts. After that point, over time, as they make additional changes they are often guessing… kind of throwing stuff up against the wall… at this point their only measurement tool is sales figures… and so the guessing game goes on… BrandTruth’s approach represents a way of breaking down their business at retail and trying to figure out what is working and what is not working – especially all of the smaller spends (vs. large marketing spends which move the whole business but don’t reveal what else is contributing to incremental optimization.) This is a model for success – for hitting singles – consistently getting base…. Historically the long term success requires a model that facilitates incremental optimization through identification of the impact of key go-to- market efforts…what we call a “Continuous Improvement Model.”
I know this is a rough slide – but the story of how BrandTruth can optimize the business is very important.
This is a slide that feeds off of previous slide. It tells the story of how BrandTruth measures the performance of various brand activities throughout the store.
I know this is a rough slide – but the story of how BrandTruth can optimize the business is very important.
This slides feeds off of the previous slide.
I know this is a rough slide – but the story of how BrandTruth can optimize the business is very important.
This slide feeds off previous Columbia case study slides.
In this slide we are considering the option of suggesting a “continuous improvement” model to the client that includes an on-going, updateable data dashboard product. This product is still in development and we are showing a beta screen shot here…