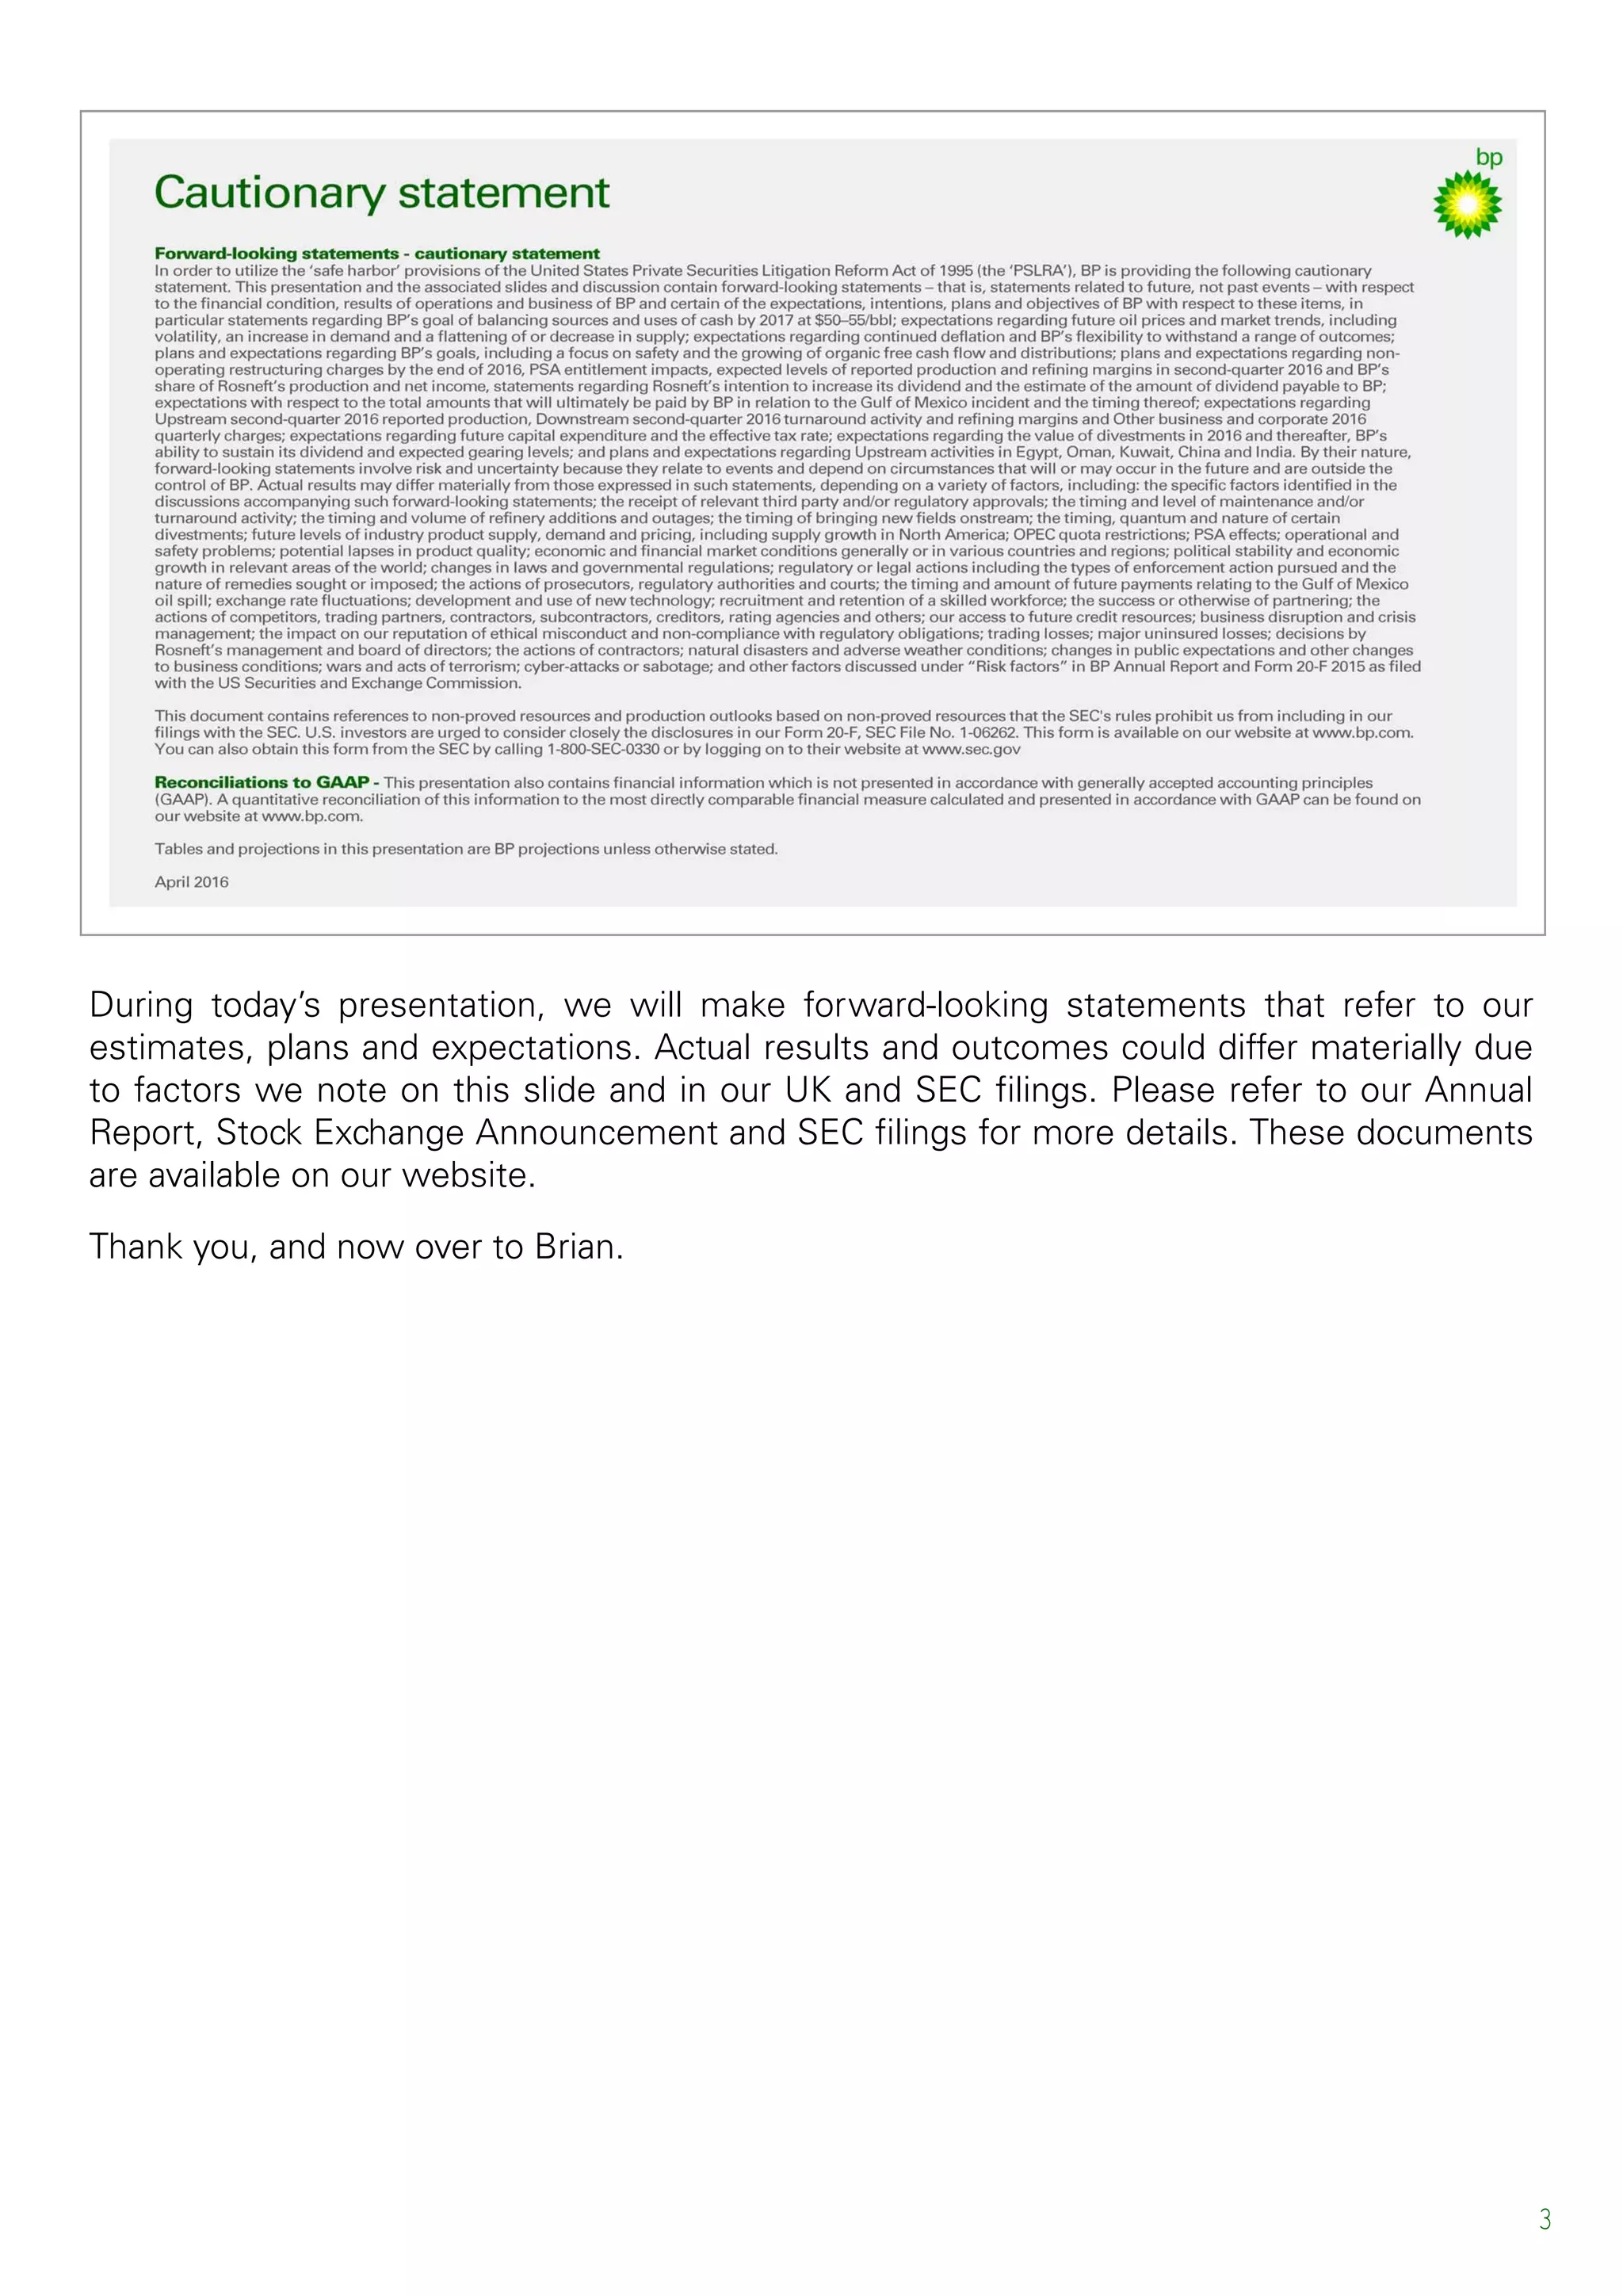
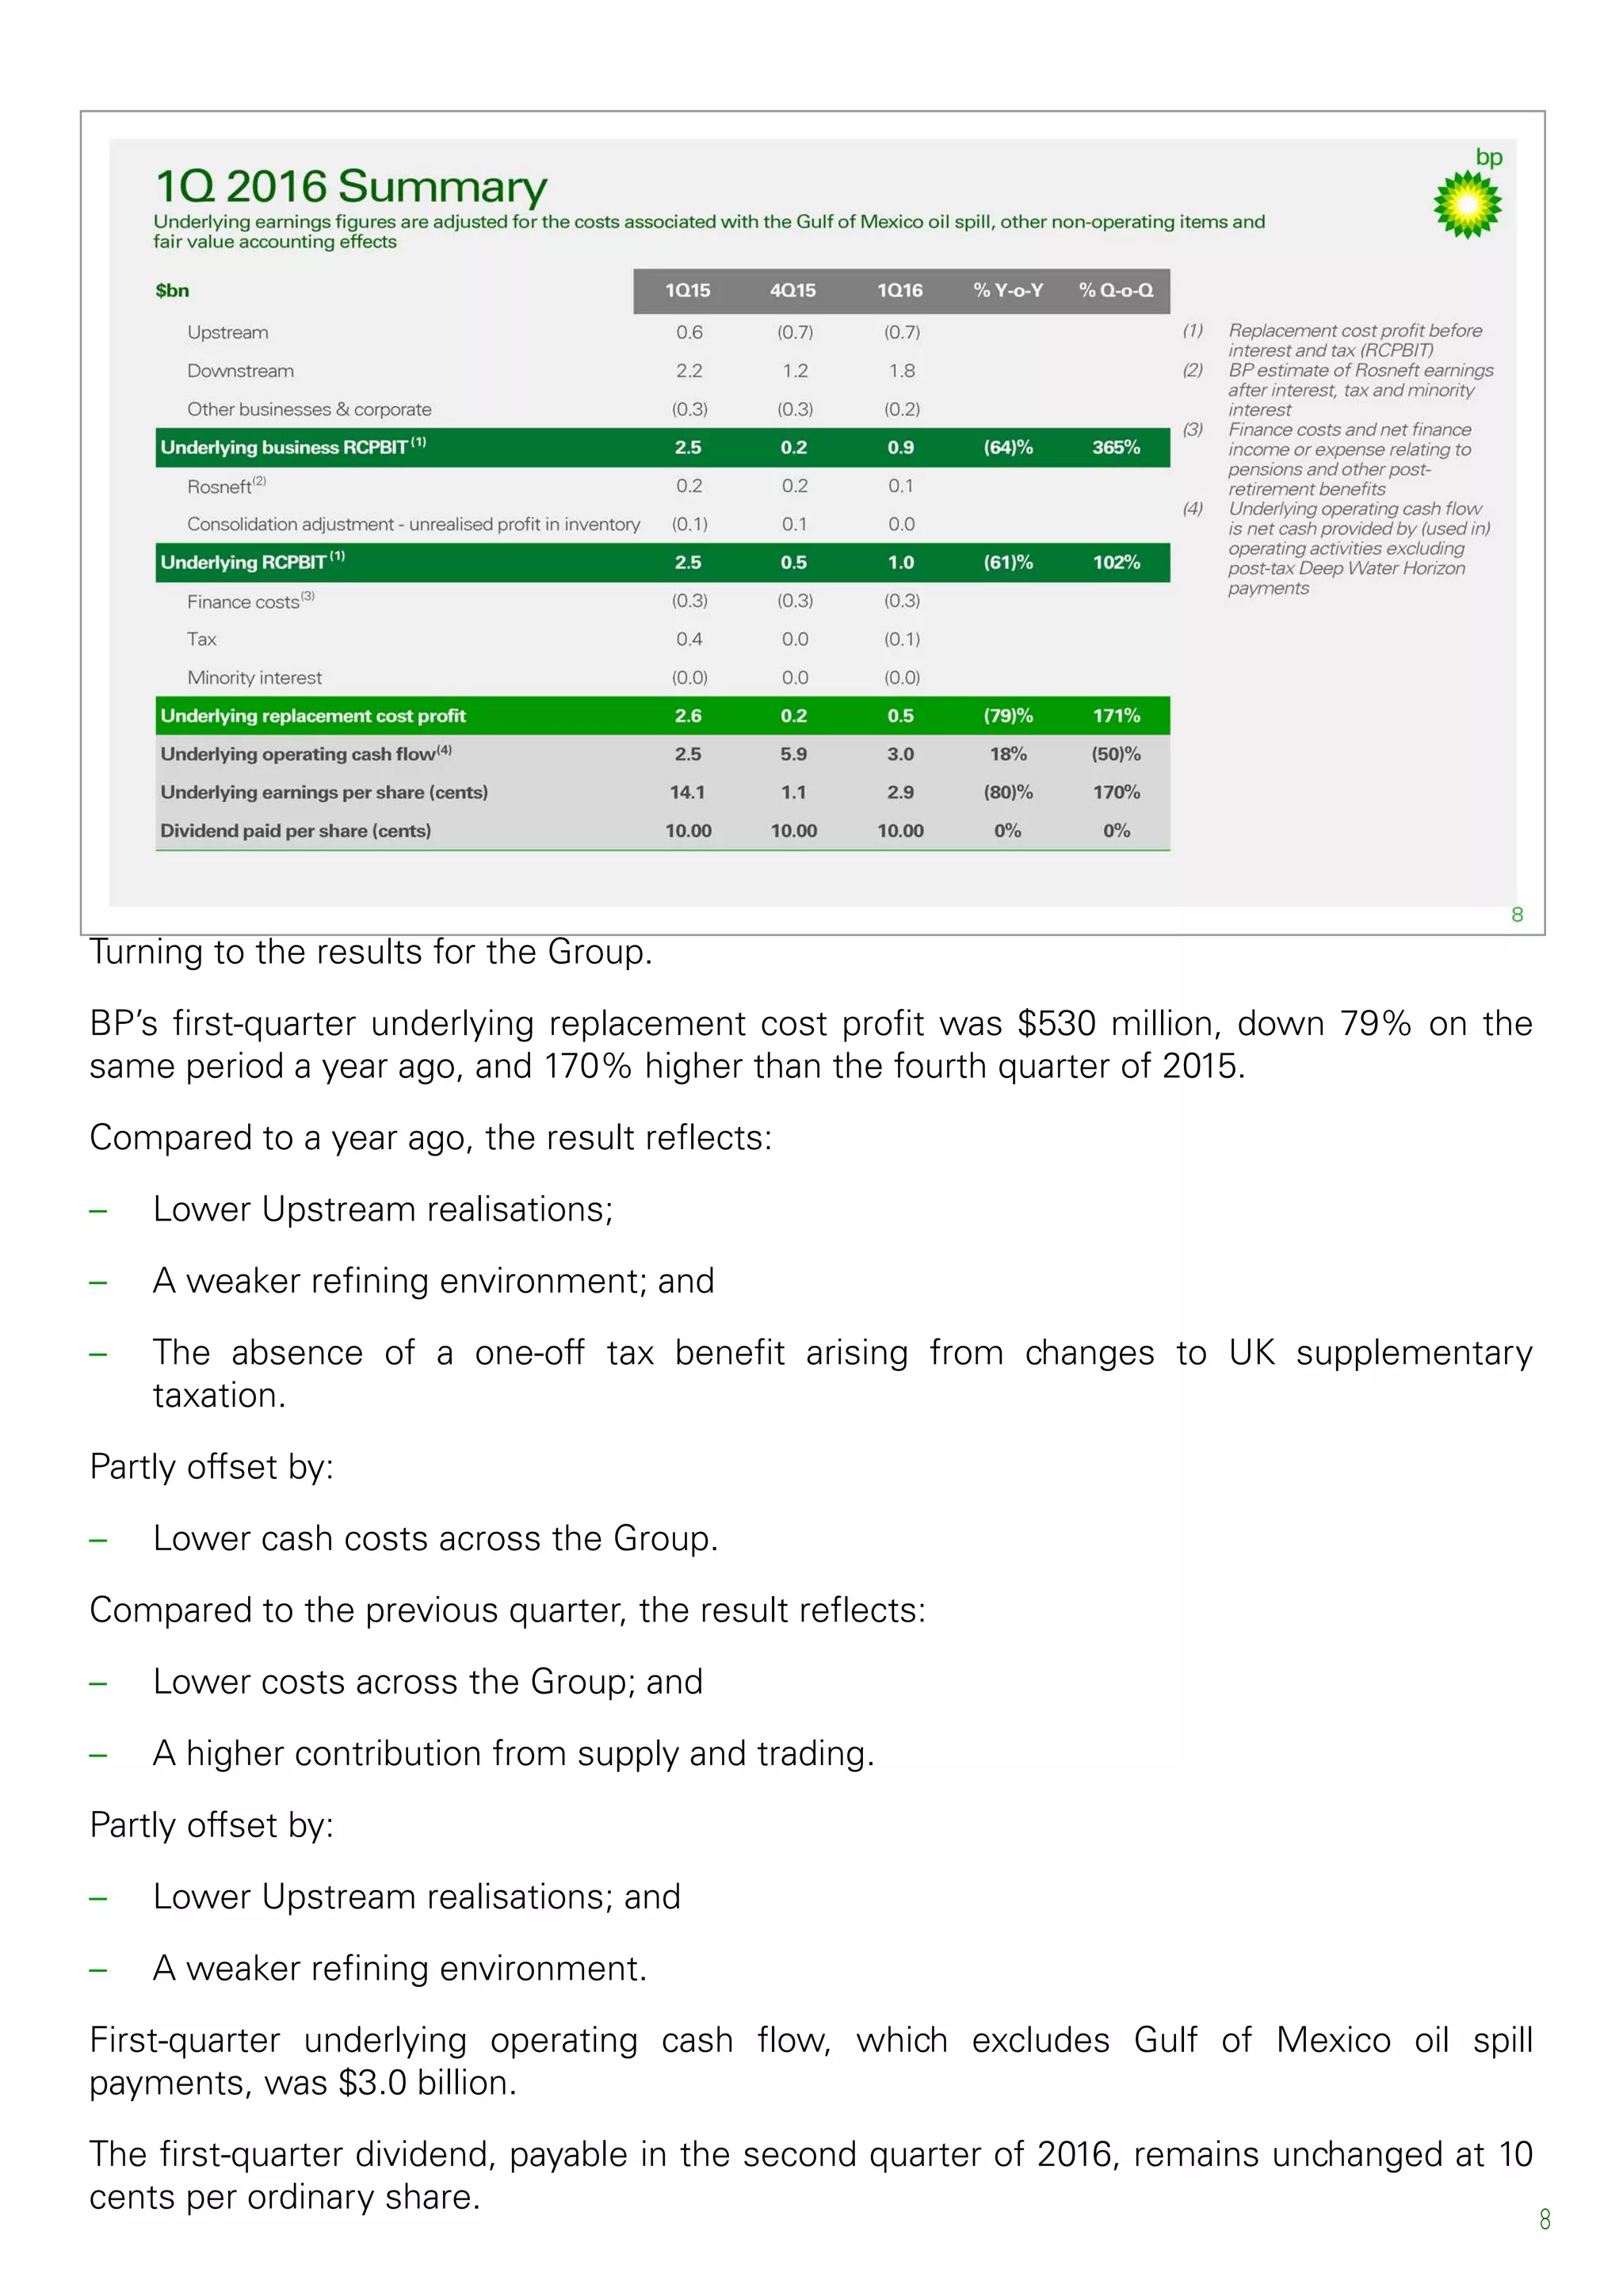
This document provides a summary of BP's first quarter 2016 results webcast and conference call. It includes an introduction by Jess Mitchell, Head of Investor Relations, and Brian Gilvary, Chief Financial Officer. Gilvary discusses BP's financial results for the first quarter, including lower underlying replacement cost profit of $530 million due to a weaker price environment. He also provides updates on BP's cost reduction progress, capital expenditure plans, and expectations for balancing organic cash flows by 2017 at oil prices of $50-55 per barrel.
The 65th edition of the BP Statistical Review of World Energy sets out energy data for 2015, revealing a year in which significant long-term trends in both the global demand and supply of energy came to the fore with global energy consumption slowing further and the mix of energy sources shifting towards lower-carbon fuels.
The 2015 edition of the BP Statistical Review of World Energy, launched today, highlights how significant changes in global energy production and consumption have had profound implications for prices, for the global fuel mix, and for global carbon dioxide emissions. The 64th annual edition of the Statistical Review highlights the continuing importance of the US shale revolution, with the US overtaking Saudi Arabia as the world’s biggest oil producer and surpassing Russia as the world’s largest producer of oil and gas.
Since 1952, the review’s mission has always been to provide objective, global data on energy markets to inform discussion, debate and decision-making. This first snap-shot of the global energy picture in 2013 – together with the historical data that puts today’s information into context – can help us to understand how the world around us is changing.
A study released by the analysts at consulting firm Deloitte that looks at the top issues facing the oil and gas sector. The study finds that within the next 5-6 years surging shale oil and natural gas production in the U.S. will "cut deeply" into OPEC's influence on setting world oil prices.
Global power and utilities transactions attained an all-time high in 2018, increasing 28% in overall deal value to $256.3b with a record volume of 546 deals, according to the EY report Power transactions and trends Q4 2018
Outlook for Energy and Minerals Markets - for the 116th CongressRoger Atkins
TESTIMONY OF KEVIN BOOK MANAGING DIRECTOR, CLEARVIEW ENERGY PARTNERS, LLC
BEFORE THE
U.S. SENATE COMMITTEE
ON ENERGY AND NATURAL RESOURCES
FEBRUARY 5, 2019
Unburnable Carbon - Are the world's financial markets carrying a carbon bubble?Marcellus Drilling News
A "report" issued by the global warming true believers at the Carbon Tracker Institute. The report makes the false claim that fossil fuel companies are vastly overvalued because the assets they own, carbon in the ground, will never get used because so-called renewable sources are coming on strong and will replace those sources. The point they try to make is that oil and gas companies are essentially worthless and investors should stay away from them. What they call a "carbon bubble." Horse manure.
CBO: The Economic and Budgetary Effects of Producing Oil and Natural Gas from...Marcellus Drilling News
A report issued by the Congressional Budget Office that chronicles the huge number of jobs and enormous positive economic impact shale drilling in the U.S. has had. Without it, we would be paying 70% more for natural gas and the employment picture would be the bleakest in generations.
An annual report issued by the Federal Energy Regulatory Commission on the state of energy markets in the U.S. In this year's report, FERC says most places across the country have seen a bump up in pipelines over the past 10 years, relieving constrained natural gas transportation. Except for the Marcellus/Utica region. In the northeast, FERC expects the situation of oversupply and not enough pipelines to get resolved in 2019.
EY Price Point: Global Oil and Gas Market Outlook - Q3EY
The oil and gas sector is constantly changing. Increasingly uncertain energy policies, geopolitical complexities, cost management and climate change all present significant challenges. EY’s Global Oil & Gas Sector supports a global network of more than 10,000 oil and gas professionals with extensive experience in providing assurance, tax, transaction and advisory services across the upstream, midstream, downstream and oil field sub-sectors.
Statistical Review of World Energy 2021 Full report - BPAbdelmounimTOUILEB
The COVID-19 pandemic had a dramatic impact
on energy markets, with both primary energy
and carbon emissions falling at their fastest rates
since the Second World War. Nevertheless,
renewable energy continued to grow, with solar
power recording its largest ever increase.
EY Price Point: global oil and gas market outlook, Q2, April 2020EY
The first quarter of this year has seen some extraordinary events. As if chronic oversupply, prices stuck below sustainable levels, the looming energy transition, and investor pressure to decarbonize weren’t enough, our industry now faces a dramatic, but hopefully temporary, downturn in demand as a result of the ongoing COVID-19 outbreak.
EY Price Point: global oil and gas market outlook, Q319EY
The theme for this quarter is consistency: in the significant trends impacting prices, at least. The forces that impacted oil prices in the second quarter were the same as those that have impacted prices quarter after quarter for the past several years. Surging North American production counterbalanced by OPEC+ production cuts has kept prices in a fairly narrow range. The market has become remarkably resilient. For some time now, long-dated oil futures have traded at a price very close to the market’s view of the break-even price of unconventional oil in North America.
EY Price Point: global oil and gas market outlook, Q2 | April 2022EY
The theme for this quarter is rearrangement. The loss, or potential loss, of Russian oil and gas supplies is forcing producers, refiners and traders to rethink the flow of crude oil and refined products from the wellhead to the gas pump in light of sanctions, potential sanctions and the risk of reputational damage. Countries, companies and consumers will all be searching for ways to adapt, and the outcome of the race to bring alternatives to market could alter the global energy landscape for years to come.
It is likely crude oil and LNG prices will remain elevated for some time. The process of diverting Russian oil through countries unwilling to sanction it will take time and there is little indication OPEC members are willing (or able) to increase production to make up for the loss of Russian crude. Spare capacity sat at 3.7 mbpd at the end of 2021, just above where it was in January 2020. Currently, sanctioned Venezuelan and Iranian production (about 3 mbpd below their peak) could fill the gap, but political and commercial obstacles remain. At today’s prices, US shale production is attractive, but the fastest the industry has been able to grow is between 1mbpd and 2mbpd per year. The LNG infrastructure was already stretched before the war in Ukraine and there is little prosect of finding new supplies soon.
As the largest buyer of Russian energy, Europe will be the epicenter. There is a deeply embedded bias there in favor for renewable energy, and the current crisis is certain to result in an all-out effort to accelerate the build-out of wind and solar power. The capacity to add new green energy is limited though by the project pipeline and supply chains for solar panels and wind turbines, and it is likely that much of the shortfall will be made up with the new LNG infrastructure.
Canada’s gross domestic product contracted at the fastest pace in more than seven years in May as wildfires curbed Alberta oil production.
The economy shrank 0.6 percent after an April expansion of 0.1 percent, Statistics Canada said Friday in Ottawa. The median forecast in a Bloomberg survey was for a 0.5 percent contraction. The drop was “primarily due” to the record 22 percent plunge in non-conventional oil production, the agency said, which typically refers to the technique used in the oil sands of extracting bitumen by mining it or injecting steam into the ground.
Analysts see the damage from the fires as contained and predict the losses will be more than recovered in the second half.
“We would still not regard this as a bad news story,” said Doug Porter, chief economist at BMO Capital Markets in Toronto. “The oil production losses will be fully reversed over the next few monthly reports, and the rest of the economy is still grinding along at a pace of around 1 percent.”
Source: http://www.bloomberg.com/news/articles/2016-07-29/canada-gdp-shrinks-most-since-2009-as-wildfires-crimp-oil-output
The April meeting of the Houston Netsquared featured guest speaker Jeff D. Frey from Rice University. Jeff shared the pros and cons of open source technology for nonprofits plus gave some recommendations to open source software, including Tendenci the open source CMS for nonprofit websites.
This presentation discusses issues facing forestry across Canada including government policies related to forestry management, forest fires, responses to natural disaster, mitigation of losses, response time to natural disaster, budget cycles and Coordinated responses to forest fires.
International Journal of Business and Management Invention (IJBMI)inventionjournals
International Journal of Business and Management Invention (IJBMI) is an international journal intended for professionals and researchers in all fields of Business and Management. IJBMI publishes research articles and reviews within the whole field Business and Management, new teaching methods, assessment, validation and the impact of new technologies and it will continue to provide information on the latest trends and developments in this ever-expanding subject. The publications of papers are selected through double peer reviewed to ensure originality, relevance, and readability. The articles published in our journal can be accessed online.
The Journal will bring together leading researchers, engineers and scientists in the domain of interest from around the world. Topics of interest for submission include, but are not limited to
The annual Energy Outlook reflects our best effort to describe a “most likely” trajectory of the global energy system, based on our views of likely economic and population growth, as well as developments in policy and technology
This 2015 edition updates our view of the likely path of global energy markets to 2035. We make assumptions on changes in policy, technology and the economy, based on extensive internal and external consultations, using a range of analytical tools to build a single “most likely” view.
The Outlook highlights the continuous change in the energy system – the changing fuel mix, the changing patterns of trade – as it adapts to meet the world’s growing energy needs. It also highlights the challenge of delivering energy supplies which are sustainable, secure and affordable. The Outlook emphasizes the role of competition and market forces in driving technology and innovation to help us meet that challenge.
A day in the life of the BP Carteret fuel terminal bp
Located in the New York Harbour area, BP’s Carteret terminal is a major hub for fuel supply on the US East Coast. Every day, thousands of gallons of gasoline and diesel are transported, blended and stored by the Carteret team and then shipped out to serve the largest metropolitan area in the United States.
Full research behind the presentation "Fortune 100 CEOs are Social Media Slackers". It shows how the most powerful CEOs are disconnected from Twitter, LinkedIn and Facebook.
The BP Energy Outlook outlines the “most likely” path for the global energy landscape - supply and demand - over the next 20 years. Read the full report here
The annual Energy Outlook reflects our best effort to describe a “most likely” trajectory of the global energy system, based on our views of likely economic and population growth, as well as developments in policy and technology
This 2015 edition updates our view of the likely path of global energy markets to 2035. We make assumptions on changes in policy, technology and the economy, based on extensive internal and external consultations, using a range of analytical tools to build a single “most likely” view.
The Outlook highlights the continuous change in the energy system – the changing fuel mix, the changing patterns of trade – as it adapts to meet the world’s growing energy needs. It also highlights the challenge of delivering energy supplies which are sustainable, secure and affordable. The Outlook emphasizes the role of competition and market forces in driving technology and innovation to help us meet that challenge.
BP Oman, along with implementing partners, has
launched over 20 social investment programmes that
have so far benefitted 33,727 people. Find out more about them here
The Energy Outlook sets out a base case which outlines the 'most likely' path for global energy markets until 2035, based on assumptions and judgments about future changes in policy, technology and the economy. The Outlook also develops alternative cases to explore key uncertainties
A solid first half; strong operations, strong cash flow. #BP has announced its #financial #results for the second quarter and half year of 2017.
The main points of the results are:
• Underlying replacement cost (RC) #profit for the second quarter was $0.7 billion.
• Second-quarter operating #cash flow, excluding Gulf of Mexico oil spill payments, was $6.9 billion. Including these payments, operating cash flow for the quarter was $4.9 billion.
• #Dividend unchanged at 10 cents per share.
• Second-quarter Upstream #production was 10% higher than in the same period in 2016; first-half production was 6% higher.
• Upstream major projects on track; two new projects sanctioned in quarter; significant #gas discoveries in #Senegal and #Trinidad announced; $753 million exploration write-off, predominantly in #Angola.
• In Downstream, first-half #fuels marketing earnings around 20% higher than in the first half of 2016.
The end of 2016 was a busy period for BP with a prolific period of announcements that will shape the business during this year and decades to come. Find out more about them here
BP has joined forces with Fulcrum BioEnergy, a pioneer in the development and production of low-carbon jet fuel.
As an equity investor, BP has secured a 10 year offtake agreement with Fulcrum for 50 million US gallons per year, from their plants under development across North America. See the journey from your waste to biojet to fuel planes.
Business Valuation Principles for EntrepreneursBen Wann
This insightful presentation is designed to equip entrepreneurs with the essential knowledge and tools needed to accurately value their businesses. Understanding business valuation is crucial for making informed decisions, whether you're seeking investment, planning to sell, or simply want to gauge your company's worth.
The key differences between the MDR and IVDR in the EUAllensmith572606
In the European Union (EU), two significant regulations have been introduced to enhance the safety and effectiveness of medical devices – the In Vitro Diagnostic Regulation (IVDR) and the Medical Device Regulation (MDR).
https://mavenprofserv.com/comparison-and-highlighting-of-the-key-differences-between-the-mdr-and-ivdr-in-the-eu/
"𝑩𝑬𝑮𝑼𝑵 𝑾𝑰𝑻𝑯 𝑻𝑱 𝑰𝑺 𝑯𝑨𝑳𝑭 𝑫𝑶𝑵𝑬"
𝐓𝐉 𝐂𝐨𝐦𝐬 (𝐓𝐉 𝐂𝐨𝐦𝐦𝐮𝐧𝐢𝐜𝐚𝐭𝐢𝐨𝐧𝐬) is a professional event agency that includes experts in the event-organizing market in Vietnam, Korea, and ASEAN countries. We provide unlimited types of events from Music concerts, Fan meetings, and Culture festivals to Corporate events, Internal company events, Golf tournaments, MICE events, and Exhibitions.
𝐓𝐉 𝐂𝐨𝐦𝐬 provides unlimited package services including such as Event organizing, Event planning, Event production, Manpower, PR marketing, Design 2D/3D, VIP protocols, Interpreter agency, etc.
Sports events - Golf competitions/billiards competitions/company sports events: dynamic and challenging
⭐ 𝐅𝐞𝐚𝐭𝐮𝐫𝐞𝐝 𝐩𝐫𝐨𝐣𝐞𝐜𝐭𝐬:
➢ 2024 BAEKHYUN [Lonsdaleite] IN HO CHI MINH
➢ SUPER JUNIOR-L.S.S. THE SHOW : Th3ee Guys in HO CHI MINH
➢FreenBecky 1st Fan Meeting in Vietnam
➢CHILDREN ART EXHIBITION 2024: BEYOND BARRIERS
➢ WOW K-Music Festival 2023
➢ Winner [CROSS] Tour in HCM
➢ Super Show 9 in HCM with Super Junior
➢ HCMC - Gyeongsangbuk-do Culture and Tourism Festival
➢ Korean Vietnam Partnership - Fair with LG
➢ Korean President visits Samsung Electronics R&D Center
➢ Vietnam Food Expo with Lotte Wellfood
"𝐄𝐯𝐞𝐫𝐲 𝐞𝐯𝐞𝐧𝐭 𝐢𝐬 𝐚 𝐬𝐭𝐨𝐫𝐲, 𝐚 𝐬𝐩𝐞𝐜𝐢𝐚𝐥 𝐣𝐨𝐮𝐫𝐧𝐞𝐲. 𝐖𝐞 𝐚𝐥𝐰𝐚𝐲𝐬 𝐛𝐞𝐥𝐢𝐞𝐯𝐞 𝐭𝐡𝐚𝐭 𝐬𝐡𝐨𝐫𝐭𝐥𝐲 𝐲𝐨𝐮 𝐰𝐢𝐥𝐥 𝐛𝐞 𝐚 𝐩𝐚𝐫𝐭 𝐨𝐟 𝐨𝐮𝐫 𝐬𝐭𝐨𝐫𝐢𝐞𝐬."
Cracking the Workplace Discipline Code Main.pptxWorkforce Group
Cultivating and maintaining discipline within teams is a critical differentiator for successful organisations.
Forward-thinking leaders and business managers understand the impact that discipline has on organisational success. A disciplined workforce operates with clarity, focus, and a shared understanding of expectations, ultimately driving better results, optimising productivity, and facilitating seamless collaboration.
Although discipline is not a one-size-fits-all approach, it can help create a work environment that encourages personal growth and accountability rather than solely relying on punitive measures.
In this deck, you will learn the significance of workplace discipline for organisational success. You’ll also learn
• Four (4) workplace discipline methods you should consider
• The best and most practical approach to implementing workplace discipline.
• Three (3) key tips to maintain a disciplined workplace.
What is the TDS Return Filing Due Date for FY 2024-25.pdfseoforlegalpillers
It is crucial for the taxpayers to understand about the TDS Return Filing Due Date, so that they can fulfill your TDS obligations efficiently. Taxpayers can avoid penalties by sticking to the deadlines and by accurate filing of TDS. Timely filing of TDS will make sure about the availability of tax credits. You can also seek the professional guidance of experts like Legal Pillers for timely filing of the TDS Return.
Discover the innovative and creative projects that highlight my journey throu...dylandmeas
Discover the innovative and creative projects that highlight my journey through Full Sail University. Below, you’ll find a collection of my work showcasing my skills and expertise in digital marketing, event planning, and media production.
LA HUG - Video Testimonials with Chynna Morgan - June 2024Lital Barkan
Have you ever heard that user-generated content or video testimonials can take your brand to the next level? We will explore how you can effectively use video testimonials to leverage and boost your sales, content strategy, and increase your CRM data.🤯
We will dig deeper into:
1. How to capture video testimonials that convert from your audience 🎥
2. How to leverage your testimonials to boost your sales 💲
3. How you can capture more CRM data to understand your audience better through video testimonials. 📊
B2B payments are rapidly changing. Find out the 5 key questions you need to be asking yourself to be sure you are mastering B2B payments today. Learn more at www.BlueSnap.com.
Company Valuation webinar series - Tuesday, 4 June 2024FelixPerez547899
This session provided an update as to the latest valuation data in the UK and then delved into a discussion on the upcoming election and the impacts on valuation. We finished, as always with a Q&A
At Techbox Square, in Singapore, we're not just creative web designers and developers, we're the driving force behind your brand identity. Contact us today.
Recruiting in the Digital Age: A Social Media MasterclassLuanWise
In this masterclass, presented at the Global HR Summit on 5th June 2024, Luan Wise explored the essential features of social media platforms that support talent acquisition, including LinkedIn, Facebook, Instagram, X (formerly Twitter) and TikTok.
Buy Verified PayPal Account | Buy Google 5 Star Reviewsusawebmarket
Buy Verified PayPal Account
Looking to buy verified PayPal accounts? Discover 7 expert tips for safely purchasing a verified PayPal account in 2024. Ensure security and reliability for your transactions.
PayPal Services Features-
🟢 Email Access
🟢 Bank Added
🟢 Card Verified
🟢 Full SSN Provided
🟢 Phone Number Access
🟢 Driving License Copy
🟢 Fasted Delivery
Client Satisfaction is Our First priority. Our services is very appropriate to buy. We assume that the first-rate way to purchase our offerings is to order on the website. If you have any worry in our cooperation usually You can order us on Skype or Telegram.
24/7 Hours Reply/Please Contact
usawebmarketEmail: support@usawebmarket.com
Skype: usawebmarket
Telegram: @usawebmarket
WhatsApp: +1(218) 203-5951
USA WEB MARKET is the Best Verified PayPal, Payoneer, Cash App, Skrill, Neteller, Stripe Account and SEO, SMM Service provider.100%Satisfection granted.100% replacement Granted.
RMD24 | Retail media: hoe zet je dit in als je geen AH of Unilever bent? Heid...BBPMedia1
Grote partijen zijn al een tijdje onderweg met retail media. Ondertussen worden in dit domein ook de kansen zichtbaar voor andere spelers in de markt. Maar met die kansen ontstaan ook vragen: Zelf retail media worden of erop adverteren? In welke fase van de funnel past het en hoe integreer je het in een mediaplan? Wat is nu precies het verschil met marketplaces en Programmatic ads? In dit half uur beslechten we de dilemma's en krijg je antwoorden op wanneer het voor jou tijd is om de volgende stap te zetten.
2. Hello and welcome. This is BP’s first-quarter 2016 results webcast and conference call.
I’m Jess Mitchell, BP’s Head of Investor Relations and I’m here with our Chief Financial
Officer, Brian Gilvary.
Before we start, I need to draw your attention to our cautionary statement.
2
3. During today’s presentation, we will make forward-looking statements that refer to our
estimates, plans and expectations. Actual results and outcomes could differ materially due
to factors we note on this slide and in our UK and SEC filings. Please refer to our Annual
Report, Stock Exchange Announcement and SEC filings for more details. These documents
are available on our website.
Thank you, and now over to Brian.
3
5. Welcome everybody and thank you for joining us.
It’s been a challenging start to the year for our industry. It is also a quarter in which we have
seen considerable progress in our own business as we work to reposition the Group.
We continue to see real momentum in resetting the cost base. This is working to lower the
point at which we expect to rebalance organic cash flows in 2017, and supports our
continued commitment to sustaining the dividend as you have seen in this morning’s
release.
Our focus on costs, together with sound operations, has also supported the solid
underlying earnings and cash flow delivery you have seen today, despite the much weaker
market conditions.
So I’ll start today by looking at the business environment, before covering our first-quarter
numbers in detail. I’ll then update you on our medium-term financial frame, where we
continue to demonstrate both flexibility and resilience in our approach to resetting the
company. I’ll finish with a brief look at the first-quarter progress in our businesses before
Jess and I take your questions.
5
6. Starting with an update on the macro-economics, where the market is responding to low
oil prices and progressing broadly along the path we laid out to you earlier in the year.
Global oil demand looks set to increase strongly again this year, supported by low oil prices.
We expect demand growth to be around 1.4 million barrels per day this year - a little weaker
than last year - but still comfortably above the historical average.
At the same time, global supply growth is likely to be flat-to-falling, with US tight oil supply
falling in particular, only partially offset by increases in Iranian production.
So our view hasn’t changed materially over the past six to nine months. We continue to
expect the combination of robust demand and weak supply growth to move the market
closer into balance by the end of this year. This will still leave record high oil inventories to
be worked down, before a more settled position emerges.
6
7. 7
Looking more specifically at the price environment so far this year.
With continued over-supply, Brent crude oil fell to an average of $34 per barrel in the first
quarter, compared to $44 per barrel in the fourth quarter and $54 per barrel a year ago.
Henry Hub gas prices continued to decline in the first quarter, with spot prices averaging
just below $2 per million British Thermal Units. The mild winter in the United States
continued to supress demand while supply remained ample, including gas in storage at
unseasonably high levels.
The global refining marker margin averaged $10.50 per barrel in the first quarter, the
lowest since the third quarter of 2010, weighed down by weak diesel demand and high
gasoline stocks in the United States. Refining margins have recovered, averaging $12.70
so far in the second quarter.
This weaker environment is consistent with the assumptions we built into our plans for
the first part of the year. While it has had a significant impact on our results in the first
quarter, this was also a period of strong operational delivery and visible progress on our
cost and efficiency agenda.
8. 8
Turning to the results for the Group.
BP’s first-quarter underlying replacement cost profit was $530 million, down 79% on the
same period a year ago, and 170% higher than the fourth quarter of 2015.
Compared to a year ago, the result reflects:
– Lower Upstream realisations;
– A weaker refining environment; and
– The absence of a one-off tax benefit arising from changes to UK supplementary
taxation.
Partly offset by:
– Lower cash costs across the Group.
Compared to the previous quarter, the result reflects:
– Lower costs across the Group; and
– A higher contribution from supply and trading.
Partly offset by:
– Lower Upstream realisations; and
– A weaker refining environment.
First-quarter underlying operating cash flow, which excludes Gulf of Mexico oil spill
payments, was $3.0 billion.
The first-quarter dividend, payable in the second quarter of 2016, remains unchanged at 10
cents per ordinary share.
9. 9
In Upstream, the underlying first-quarter replacement cost loss before interest and tax of
$750 million compares with a profit of $600 million a year ago and a loss of $730 million in
the fourth quarter of 2015.
Compared to the first quarter of 2015 the result reflects:
– Significantly lower liquids and gas realisations.
Partly offset by:
– Lower costs from simplification and efficiency activities;
– Lower rig cancellation costs; and
– Lower DD&A.
Excluding Rosneft, first quarter reported production versus a year ago was 5.2% higher.
After adjusting for entitlement and divestment impacts, underlying production decreased by
1.1%.
Compared to the fourth quarter, the result reflects:
– Lower realisations.
Largely offset by:
– Significantly lower costs, including lower exploration write-offs.
Looking ahead, we expect second-quarter 2016 reported production to be lower than the
first quarter, reflecting PSA entitlement impacts and seasonal turnaround maintenance
activity.
10. 10
In the Downstream, the first-quarter underlying replacement cost profit before interest and
tax was $1.8 billion, compared with $2.2 billion a year ago and $1.2 billion in the fourth
quarter of 2015.
The Fuels business reported an underlying replacement cost profit before interest and tax
of $1.3 billion in the first quarter, compared with $1.8 billion in the same quarter last year
and $890 million in the fourth quarter of 2015.
Compared to a year ago, the result reflects:
– A significantly weaker refining environment; and
– A lower contribution from supply and trading, compared with a very strong result in the
same period last year.
Partly offset by:
– Lower costs from our simplification and efficiency programmes;
– Strong refinery operations; and
– A higher retail result supported by volume growth.
Compared to the fourth quarter, the result reflects:
– A strong contribution from supply and trading, compared with a small loss last quarter;
– Lower costs; and
– Strong refining operations.
Partly offset by:
11. – A weaker refining environment; and
– Seasonally lower fuels marketing margin capture.
The Lubricants business delivered an underlying replacement cost profit of
$380 million in the first quarter compared with $350 million in the same
quarter last year, reflecting strong premium brand performance and margin
growth despite adverse foreign exchange impacts.
The Petrochemicals business reported an underlying replacement cost
profit of $110 million, compared to $20 million a year ago, reflecting
improved operations, lower costs and a slightly improved margin
environment.
In the second quarter, we expect a significantly higher level of turnaround
activity, particularly in the United States and some seasonal improvement
in industry refining margins.
10
12. 11
Turning to Rosneft. Based on preliminary information, we have recognised around $70
million as our estimate of BP’s share of Rosneft’s underlying net income for the first
quarter, compared to around $180 million a year ago and $235 million in the fourth quarter
of 2015.
Our estimate of BP’s share of Rosneft’s production for the first quarter is just over 1 million
barrels of oil equivalent per day, similar to both a year ago and the fourth quarter.
Additional details will be made available by Rosneft with their results.
On the 22nd of April, the Rosneft board indicated an intention to increase its dividend payout
to 35% of IFRS earnings. At current exchange rates, this would imply a dividend payable to
BP of around $330 million after tax for 2015, payable in the third quarter of 2016. The final
decision regarding the payout will be taken at Rosneft’s Annual General Shareholders
Meeting in June.
13. 12
In Other Businesses and Corporate, we reported a pre-tax underlying replacement cost
charge of $180 million for the first quarter, $110 million lower than same period a year ago.
This reflects lower corporate and functional costs and foreign exchange benefits. We
continue to expect the average underlying quarterly charge for the year to be around $300
million, although this may fluctuate between individual quarters.
The underlying tax rate in the first quarter was 18% and reflects tax credits from the
reported Upstream loss offsetting tax charges elsewhere in the business, together with a
deferred tax benefit from the weaker US dollar. This compares to a rate of 21% in the same
period a year ago, after adjusting for the UK North Sea supplementary charge in 2015.
In the current environment, and with our existing portfolio of assets, we continue to expect
the effective tax rate for the full year to be lower than the adjusted 2015 rate of 31%, which
excludes the previously mentioned North Sea tax credit.
14. 13
Turning to the Gulf of Mexico oil spill costs and provisions.
Earlier this month, the court entered final judgment on the Consent Decree relating to the
2015 agreement to settle all federal and state claims arising from the Deepwater Horizon
incident. As a result, the Consent Decree and settlement agreement are now effective.
The total cumulative pre-tax charge for the incident to date is $56.4 billion – or $40.7 billion
after tax. The charge for the first quarter was $917 million which includes:
– $593 million related to business economic loss claims not provided for;
– $201 million of costs relating to the settlement of certain civil claims outside of the
2012 class action settlement and other administration costs; and
– Financing costs of $123 million.
It is still not possible to reliably estimate the remaining liability for business economic loss
claims and we continue to review this each quarter. We have, however, now agreed
simplified and accelerated procedures for processing claims which you see reflected in
today’s higher charge.
Of the $20 billion paid into the Trust fund, $19.8 billion has now been paid out with the
remainder allocated to amounts already provided for.
The pre-tax cash outflow on costs related to the oil spill for the first quarter was $1.1 billion,
including $530 million relating to the 2012 criminal settlement with the United States
Department of Justice. We also expect a further $1.1 billion of payments in respect of the
2015 settlement, as well as further payments relating to business economic loss claims and
other costs not yet provided for. We will continue to update you on a quarterly basis,
including any further developments with the private securities litigation under MDL 2185.
15. 14
Now looking at cash flow, this slide compares our sources and uses of cash in the first
quarter of 2016.
Excluding oil spill related outgoings, underlying cash flow for the quarter was $3.0 billion,
including a working capital build of around $800 million.
Gulf of Mexico oil spill payments of $1.1 billion were offset against divestment proceeds,
which also amounted to $1.1 billion in the first quarter.
Including oil spill payments, operating cash flow for the quarter was $1.9 billion, similar to a
year ago.
Organic capital expenditure in the first quarter was $3.9 billion, compared to $4.4 billion a
year ago.
16. Turning now to our financial frame and starting with some context.
Our financial framework is designed to grow long-term value for shareholders while
maintaining the financial health and liquidity of the Group. This requires us to determine the
right level of re-investment to continue to grow value while ensuring we distribute
sustainable returns to shareholders.
We believe getting this right is strongly linked to making the right decisions about our
portfolio.
At its simplest we have prioritised value over volume – and will continue to do so on an
ongoing basis. We look to divest assets which no longer fit with our strategy and deepen in
assets which add the most value. At the same time we drive returns through disciplined
investment into the best projects. In the current environment all this still applies, but we
have an added imperative to make very careful judgements about how we use our scarce
capital. We have to balance the pace of investment to capture maximum deflation while
ensuring we maintain safe operations and preserve future growth. We also wish to retain
flexibility to add to the portfolio at the lowest point of the cycle if the right opportunities
present themselves.
So there are a lot of moving parts that we need to continue to manage while the
environment remains unsettled. We entered this down-cycle with a strong balance sheet
and we have a strong portfolio, with a resilient Downstream and a new wave of material
Upstream project start-ups in sight. We have also moved very quickly to reset the cost base
of the company for a lower price environment. Consistent with many others, we anticipate
a modestly more favourable oil price environment in 2017 than we see today, but believe
we have the flexibility to withstand a range of outcomes. If oil prices remain lower for
longer than anticipated, there will inevitably be trade-offs that we need to take, but we will
continue to be governed in these decisions by what we consider to be in the best long-
term interests of shareholders.
15
17. 16
Looking at the specifics of our financial frame.
We continue to make strong progress on resetting both the capital and cash cost base of
the Group.
We now expect capital expenditure in relation to the current portfolio to be around $17
billion this year. We see room to reduce this to between $15-17 billion per annum for 2017
in the event of a continued low oil price. This compares to our guidance in February of $17-
19 billion per annum for the same period, while at that time 2016 spend was expected to
be at the lower end of that range.
Today’s guidance suggests a 30-40% drop in capital expenditure by 2017 compared to
around $25 billion of spend at the peak in 2013, when Brent oil prices averaged $109 per
barrel.
The reduction has come through:
– Paring back exploration spend;
– Prioritisation of marginal activity; and
– The capture of accelerating deflation in the supply chain as we time our investment
decisions.
Significantly, it also reflects a strong drive towards capital efficiency in our development
plans which is allowing us to deliver the same activity for less spend. In areas where we
still see flexibility to optimise activity we will judge very carefully the implications to the
business, retaining the ability to increase activity if prices strengthen. We will continue to
realise deepening deflation and balance the overall best use of funds to the prevailing oil
price. Our intention remains to stay very focused on both safety and our growth plans for
18. the future.
We also continue to move quickly to lower controllable cash costs across
the Group. The Group’s cash costs over the last four quarters were $4.6
billion lower than 2014. This demonstrates the ongoing momentum behind
our efforts to reduce costs and puts us about two-thirds of the way
through to delivering $7 billion of cash cost reduction by 2017, compared to
2014.
As we continue to lock-in capital efficiencies and embed structural
simplification along with a more controlled organisation, we expect a large
part of the cost savings to be sustainable for the future.
Non-operating restructuring charges are expected to approach $2.5 billion
in total by the end of 2016, with around $1.9 billion incurred so far since the
fourth quarter of 2014. Of this, around $350 million was incurred in the first
quarter.
16
19. 17
Our principal aim is to re-establish a balance where operating cash flow covers capital
expenditure and the dividend over time. In this way we look to ensure that levels of re-
investment and distributions are consistent with the long-term growth of our underlying
business.
We have been working towards a goal of rebalancing by 2017 at the prevailing oil price
which back in October 2015 we pegged at $60 per barrel, consistent with the forward
curve at that time. As we steadily take more costs out, the Brent oil price at which we
would expect to break-even continues to move lower. We now anticipate re-balancing
organic sources and uses of cash by 2017 at oil prices in the range of $50-55 per barrel.
This currently defines the basis for our ongoing commitment to sustaining the dividend as
the first priority within our financial framework. Actual inflows and outflows will be subject
to ongoing recalibration to the environment, including the judgements we make around
levels of capital expenditure and any changes to the portfolio.
Once rebalancing is achieved, organic free cash flow is expected to start to grow at
constant prices supported by the stronger cash flows expected from our Upstream project
start-ups over the medium term. This will, in turn, support distributions to shareholders.
With divestments having reached $10 billion over 2014 and 2015, we continue to expect $3-
5 billion of divestments in 2016 and around $2-3 billion per annum thereafter, in line with
our historical norms. The proceeds from these divestments provide additional flexibility to
manage oil price volatility and capacity to meet our Deepwater Horizon payment
commitments in the United States.
20. 18
Turning to gearing.
At the end of the first quarter net debt was $30 billion with gearing at 23.6%.
This includes the impact that the Consent Decree and settlement agreement with the Gulf
States had on our balance sheet during 2015, and the scheduling of payments over an
extended period.
As a reminder, during 2010 we lowered our gearing band from a historical range of 20-30%
down to 10-20% to manage uncertainties, mainly in relation to the Deepwater Horizon
incident. Having finalised these agreements, we are re-establishing a 20-30% gearing band
going forward.
21. Now turning briefly to the highlights for the quarter from our businesses.
Starting with the Upstream, we have seen continued strong operational performance. Plant
reliability was 95% across our operated producing assets and we saw strong drilling
performance, particularly in the United States Lower 48 and Azerbaijan, delivering both cost
and efficiency benefits.
The first quarter saw the start-up of the In Salah Southern Fields major project in Algeria
and we also recently saw the start-up of the Point Thomson project in Alaska. We also have
two projects in the commissioning stage and two further projects continue to progress well
for start-up later in the year, with facilities work nearing completion. For example we saw
the safe arrival of the new FPSO for Quad 204 in Norway ahead of its installation to the
West of Shetland this summer, ready for start-up around the end of the year.
Overall we continue to have momentum on our Upstream major projects portfolio as we
look beyond this year. Our 2017 start-ups are on-track, and together with our six 2016 start-
ups, we expect to put in place 500 thousand oil equivalent barrels per day of new net BP
capacity by the end of 2017 versus 2015.
For example our Khazzan project facilities are now 69% complete with 46 well pads
completed and start-up expected to be a little ahead of schedule. Juniper, which will back-
fill production into our Trinidad LNG trains, is progressing well with over 55% facilities
completion. In Egypt facilities for the Taurus-Libra phase of our West Nile Delta project are
also on schedule and around 50% complete, while the topsides modules for Clair Ridge in
the North Sea are en route from South Korea and are expected to arrive later this quarter.
Beyond these 2017 start-ups, the production facilities for our Shah Deniz Phase 2 project
are ahead of plan at around 70% completion, with first gas scheduled for 2018.
All of this means we remain on track for the delivery of over 800 thousand barrels of oil
19
22. equivalent per day of production from new major projects by 2020.
In February, our first exploration discovery of the year was announced on
the Nooros East prospect in Egypt by the operator Eni, who have now tied
it back for production. Meanwhile we have completed evaluation of the BP-
operated Kepler-3 discovery, drilled in late 2015, and are in the process of
tying this well into our Na Kika platform with the aim of starting production
later this year. These are great examples of the opportunity for rapid
monetisation of near-field discoveries, or what we call infrastructure-led
exploration.
The first quarter was a strong quarter for new access including farm-ins
and licences awarded for new acreage in Norway and Newfoundland
Canada, with an aggregate total of around 12,000 square kilometres.
In Oman, we signed a major agreement to extend the Khazzan license to
access a further 1,000 square kilometres, estimated to contain around 3.5
trillion cubic feet of gas. Combined plateau production from Phases 1 and 2
is expected to total approximately 1.5 billion cubic feet of gas a day,
equivalent to around 40% of Oman’s current total domestic gas production.
Additionally in the first quarter, the Government of India announced a series
of policy initiatives, including marketing and pricing freedom for natural gas
produced from deepwater discoveries, which we believe is a positive
development and are evaluating for future projects.
We also signed two new agreements – one with the Kuwait Petroleum
Corporation to enhance recovery of existing oil and gas resources and
pursue future oil and gas exploration opportunities; and a Production
Sharing Agreement in China to develop shale gas resources.
19
23. 20
In the Downstream, the first quarter saw strong year-on-year underlying performance
improvement mitigating the impact of a weaker refining environment.
At the same time, our refineries saw a 4% increase in utilisation, while we increased the
amount of advantaged heavy crude processed by more than 20%. And in Petrochemicals
we are improving the cash breakeven of the business, making it more robust to a bottom-
of-cycle environment.
Our marketing growth strategy continues to deliver results. The global roll-out of our
Ultimate fuels with ACTIVE technology represents our biggest fuel launch in over a decade.
We also expanded our convenience retail partnerships in Germany and the Netherlands;
and we became the world’s first supplier for commercial jet biofuel using existing airport
infrastructure.
In Lubricants we continue to see double-digit earnings growth supported by strong
premium brand performance and growth market positions.
And simplification and efficiency has progressed across the Downstream into 2016,
keeping the business on track to deliver $2.5 billion of cost efficiencies by the end of 2017.
Taken together, this momentum in underlying performance improvement continues to
support the increased resilience of the Downstream business.
24. 21
In summary.
The environment is very challenging but we are seeing the benefit of having moved quickly
to respond.
We have considerable momentum around resetting our cost base. This is driven by both the
pace at which we are capturing deflation and our own simplification efforts. You have seen
more evidence of this across all our businesses in today’s results.
We are steadily lowering the oil price at which we expect to balance organic sources and
uses of cash by 2017, while retaining sufficient flexibility to make the right choices about
our portfolio to sustain growth.
I believe we are making strong progress. We are executing our projects safely and more
efficiently, driving down costs and making careful judgements about the best use of scarce
capital.
And all our decisions continue to be guided by our ultimate aim to grow sustainable free
cash flow and distributions to shareholders over the long term.
On that note, thank you for listening, and I’ll now open up for questions.