Download as PDF, PPTX

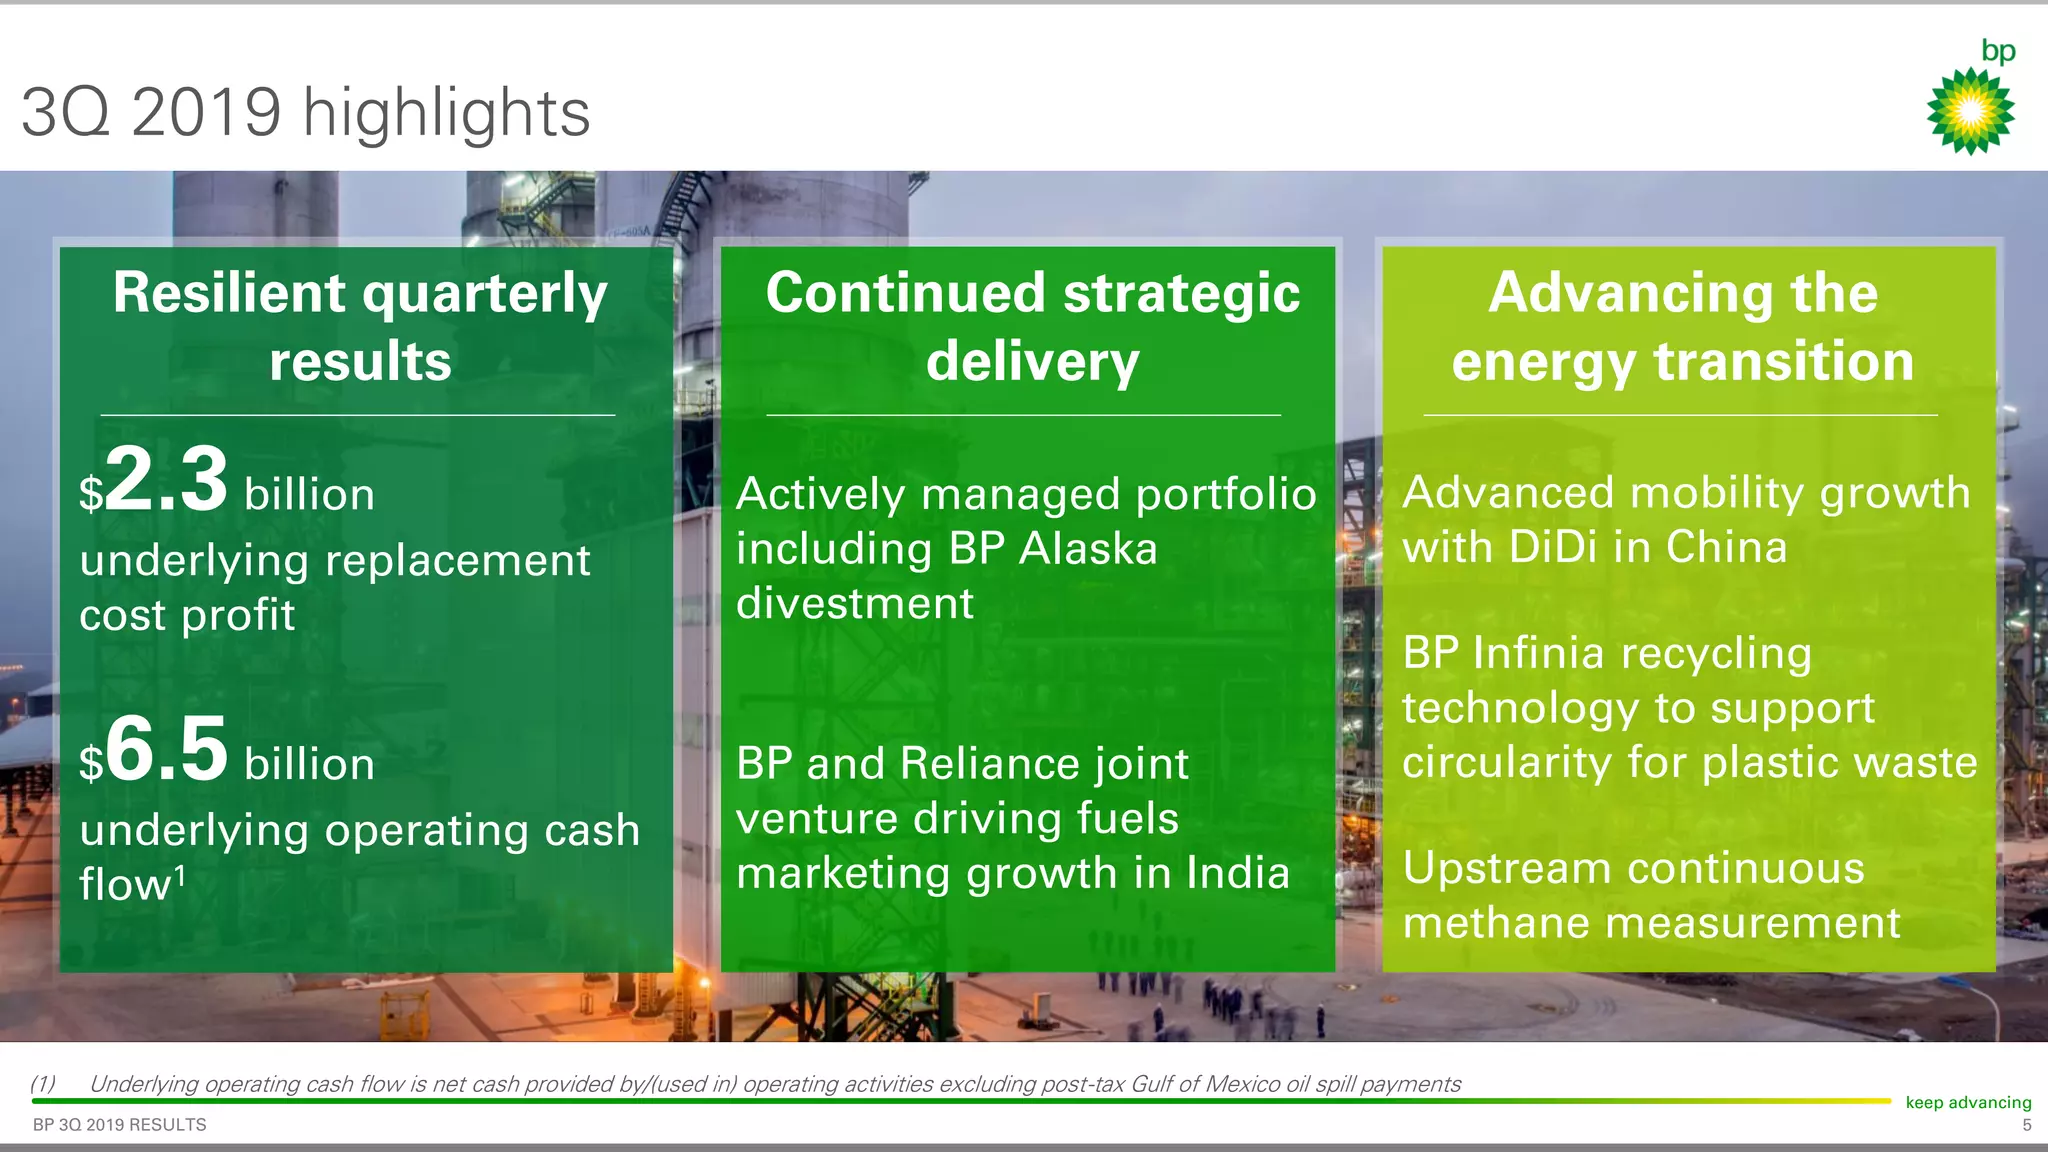
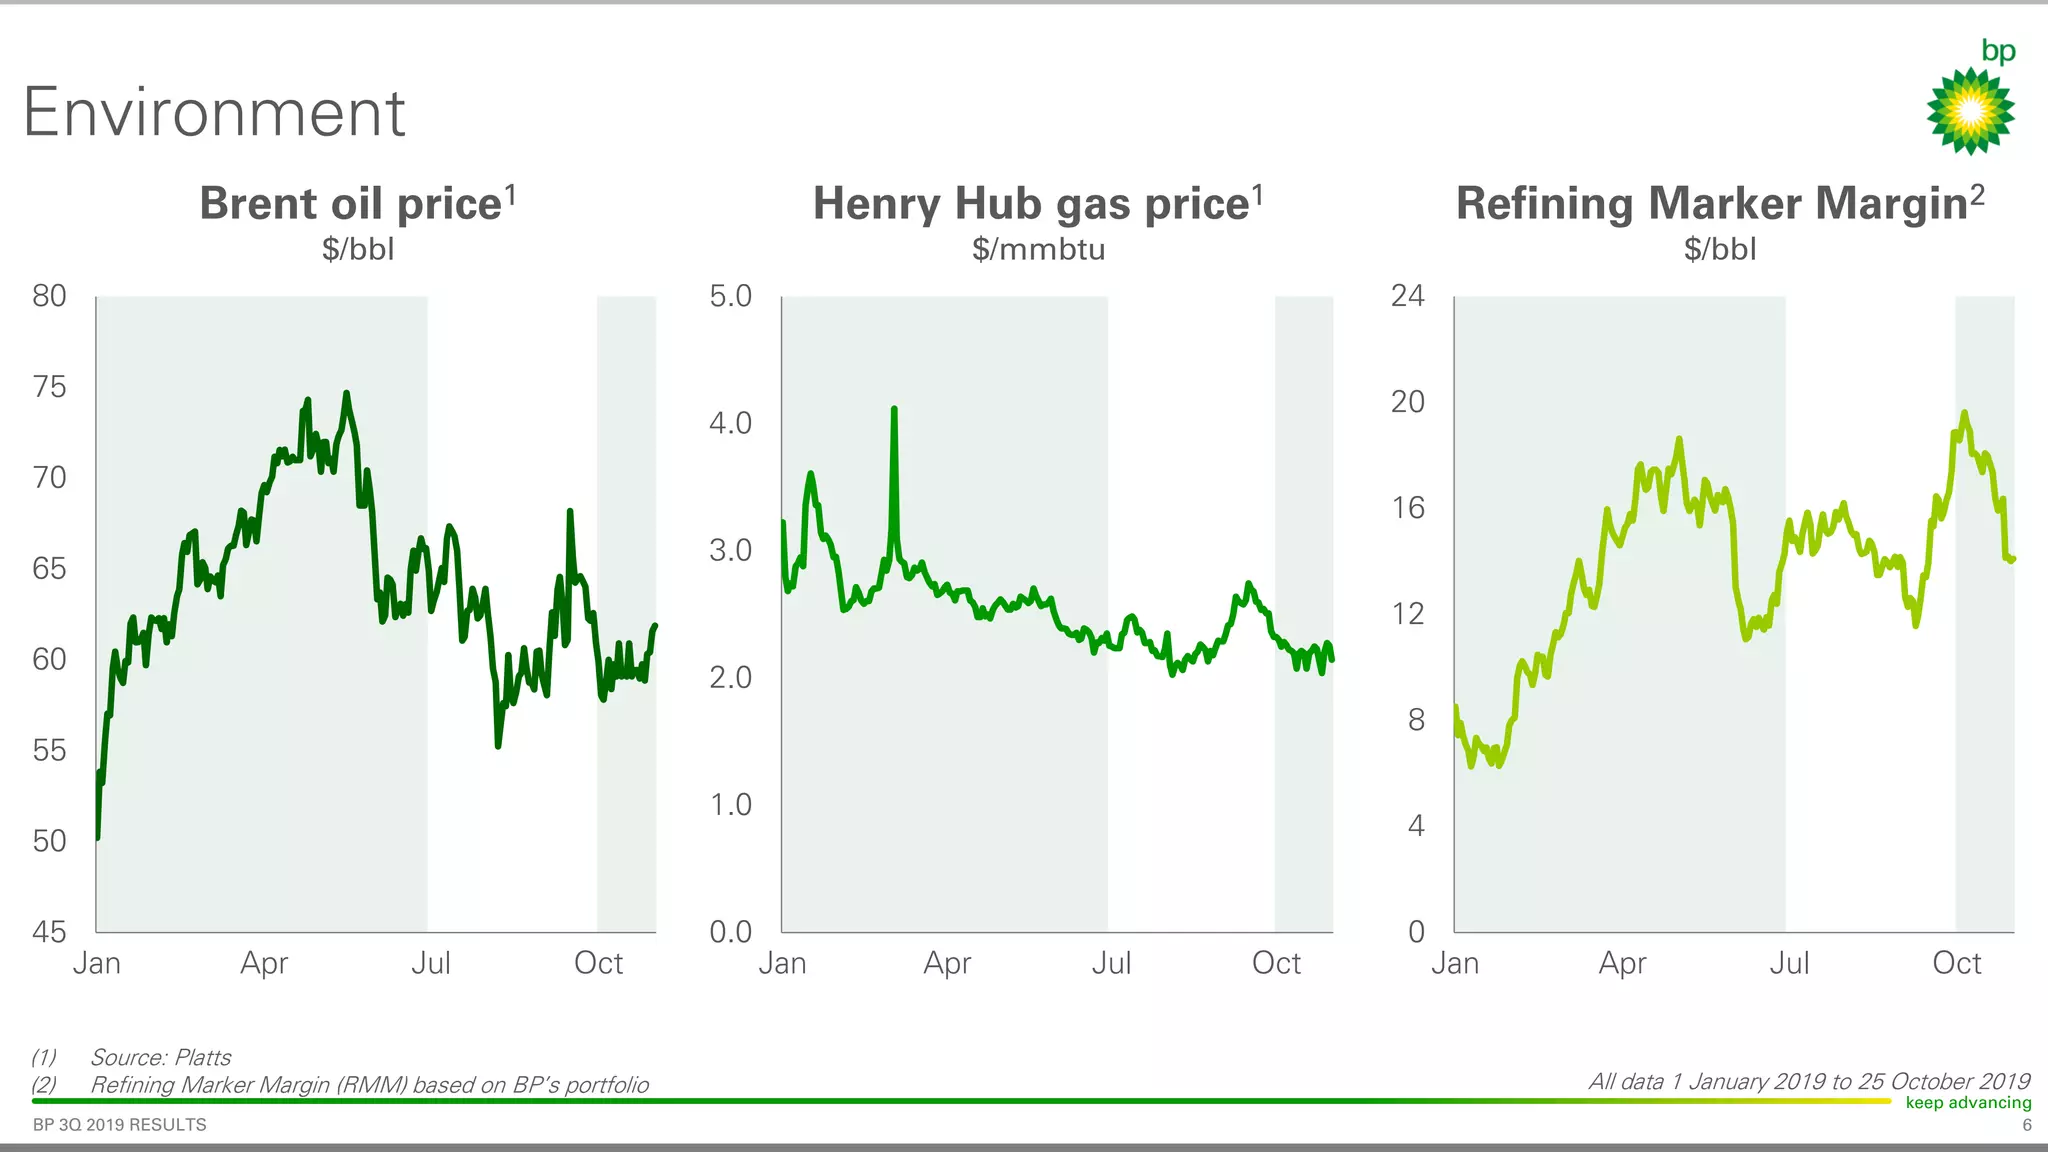
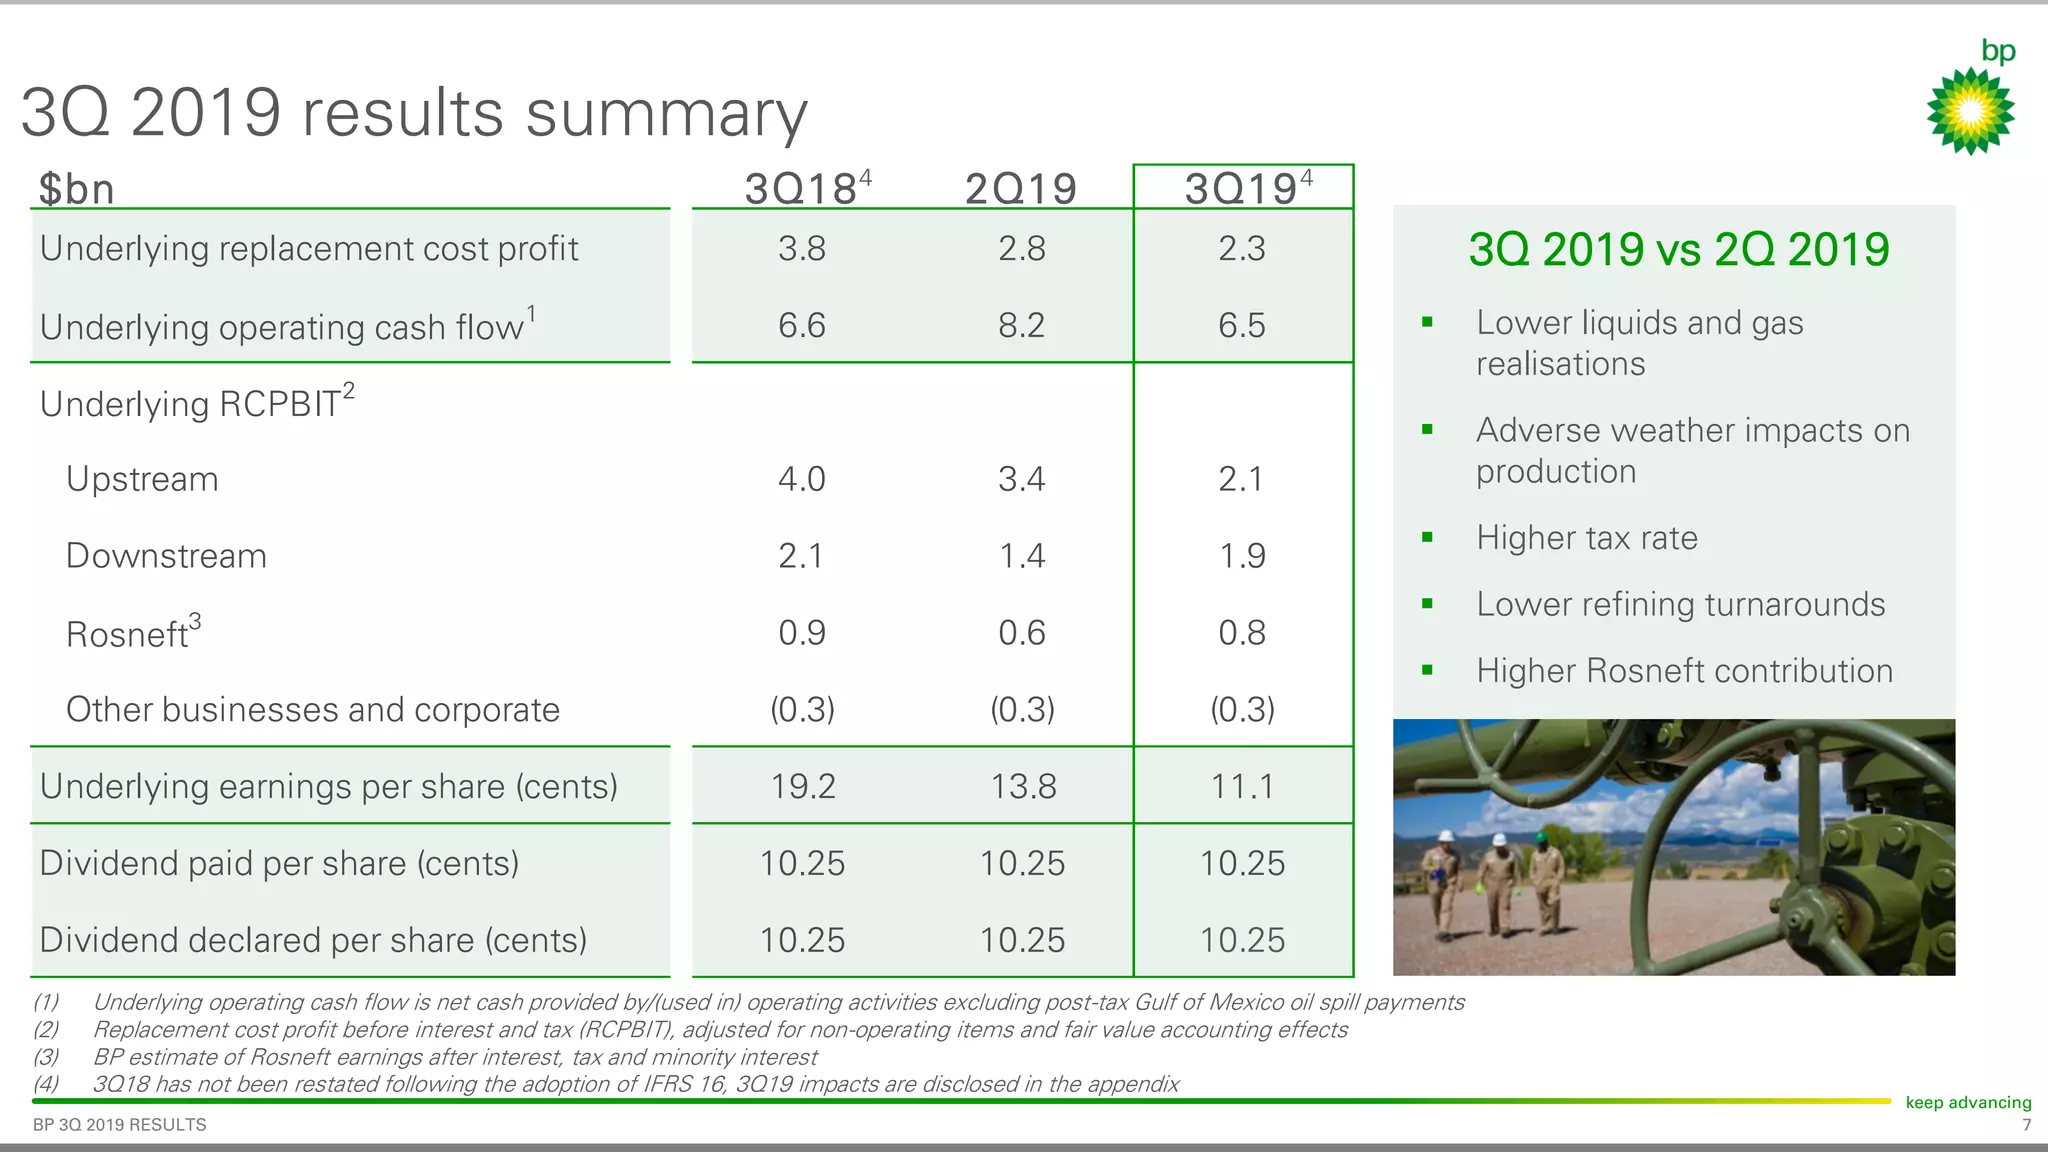
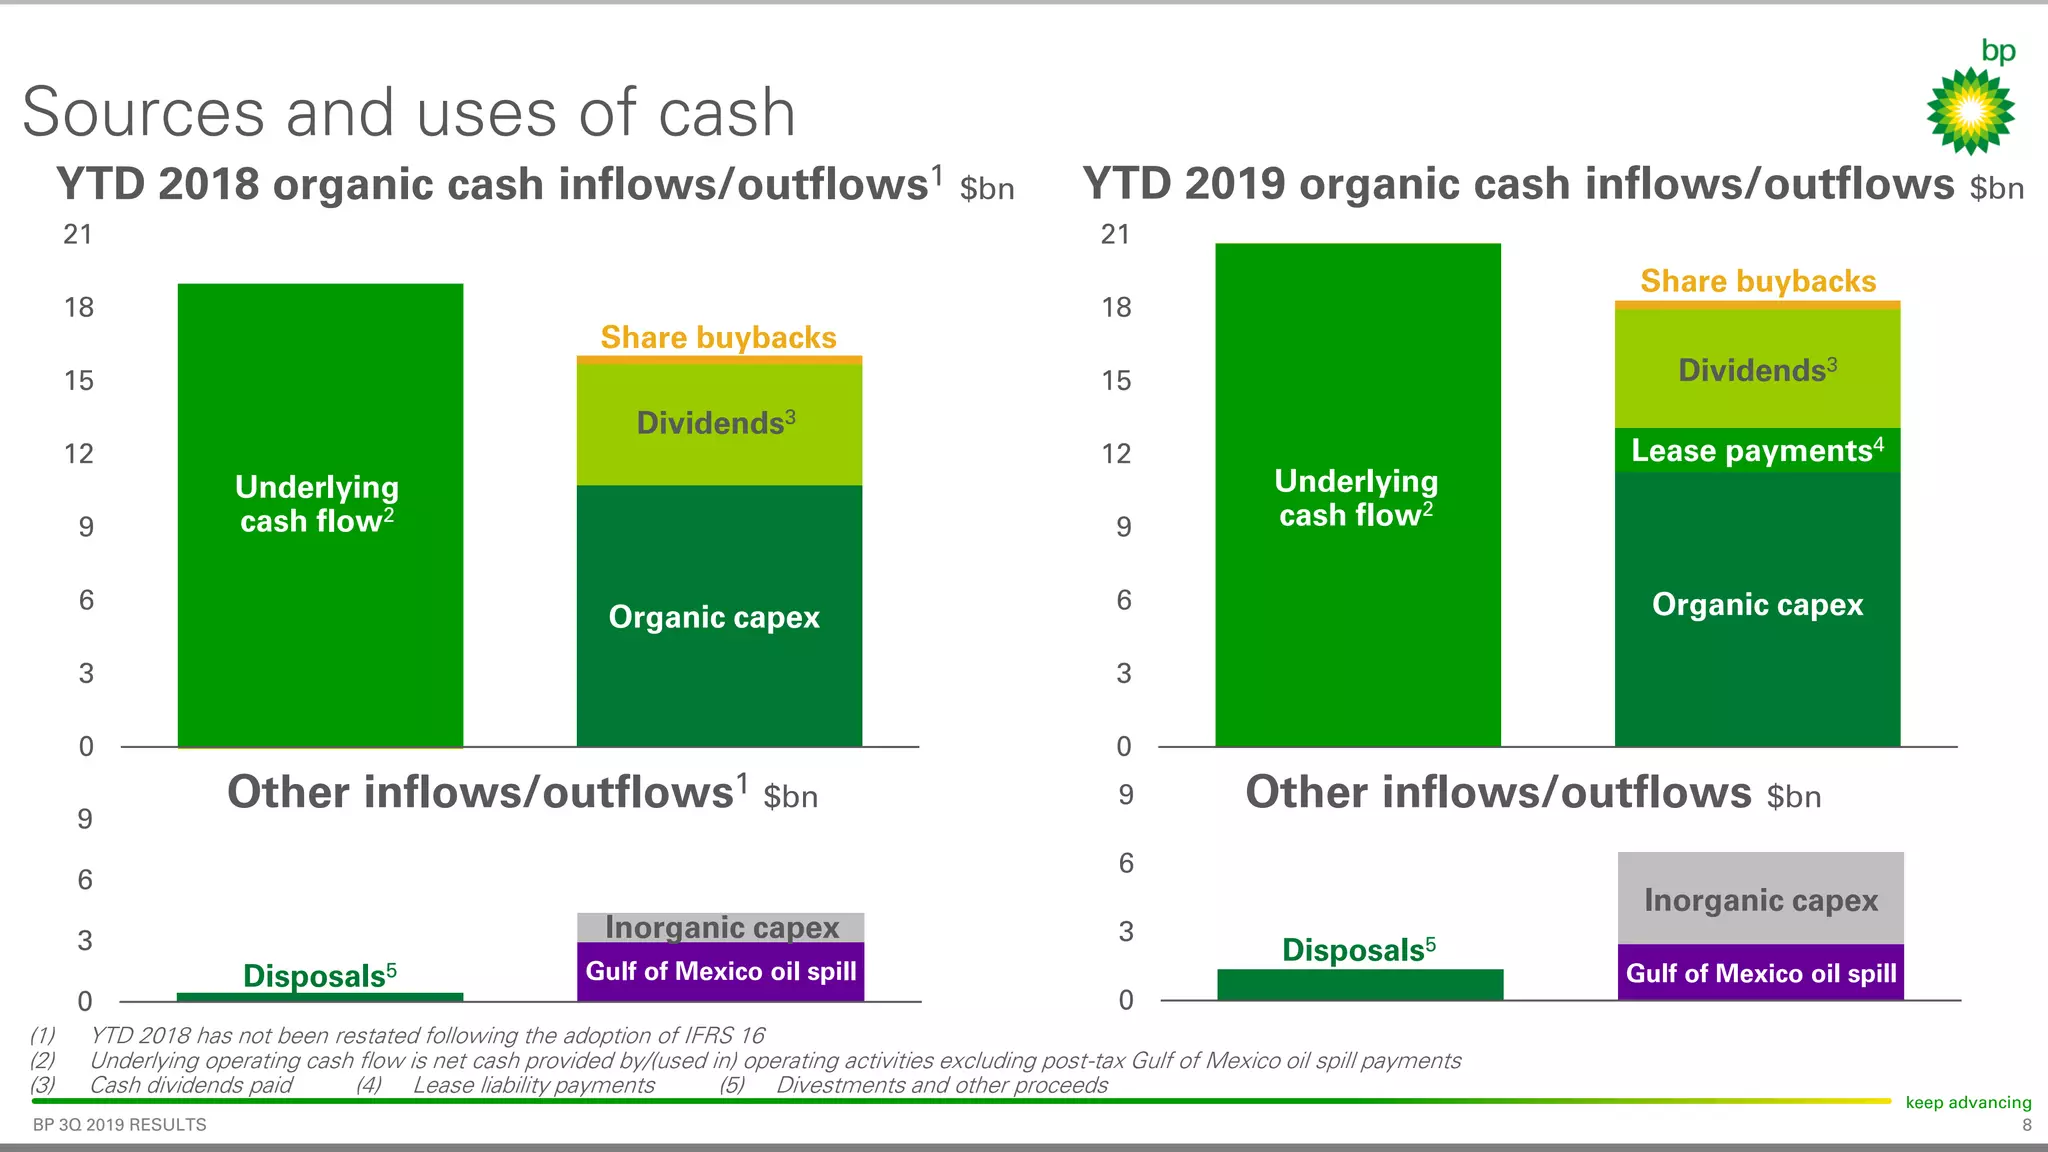
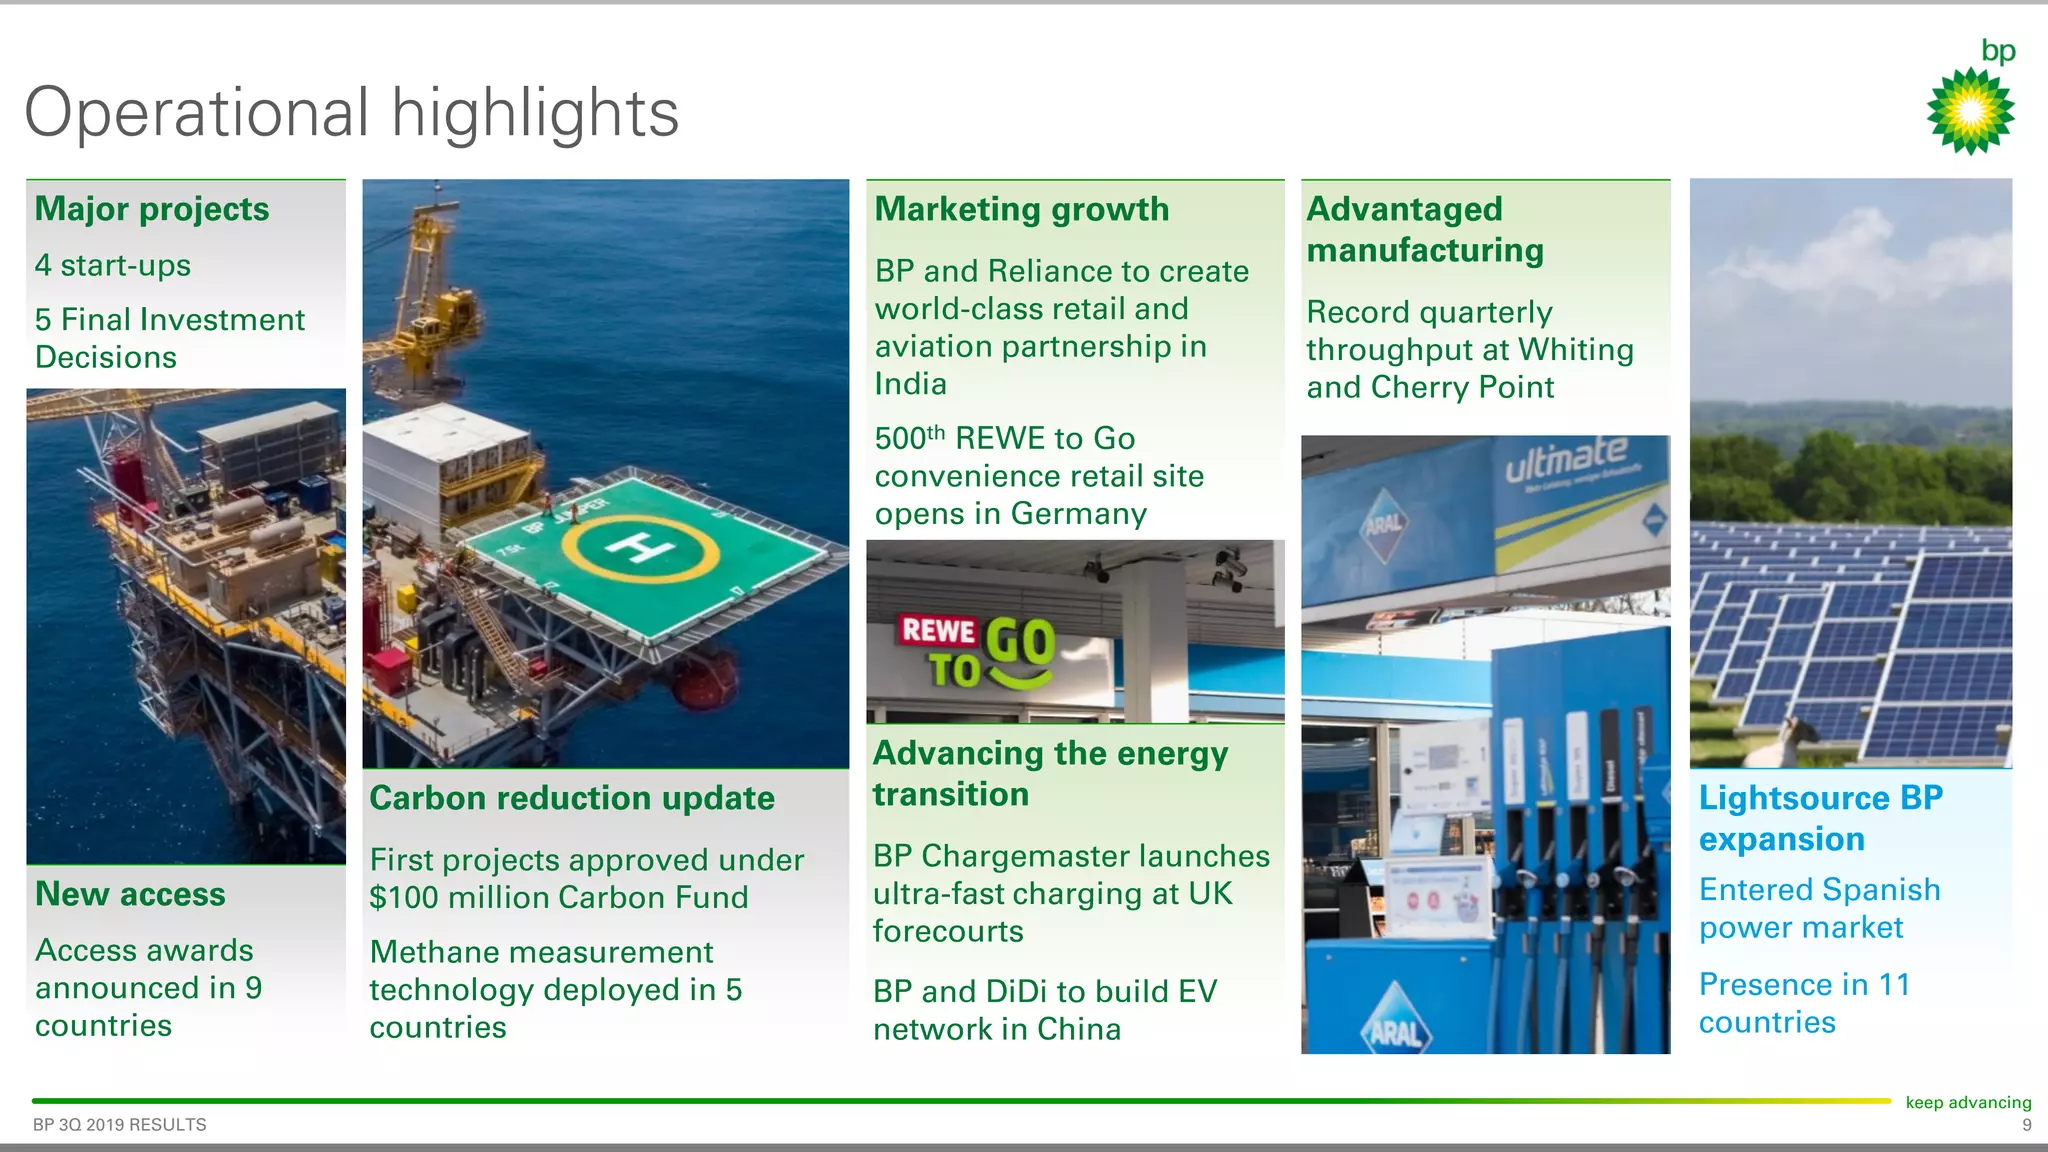
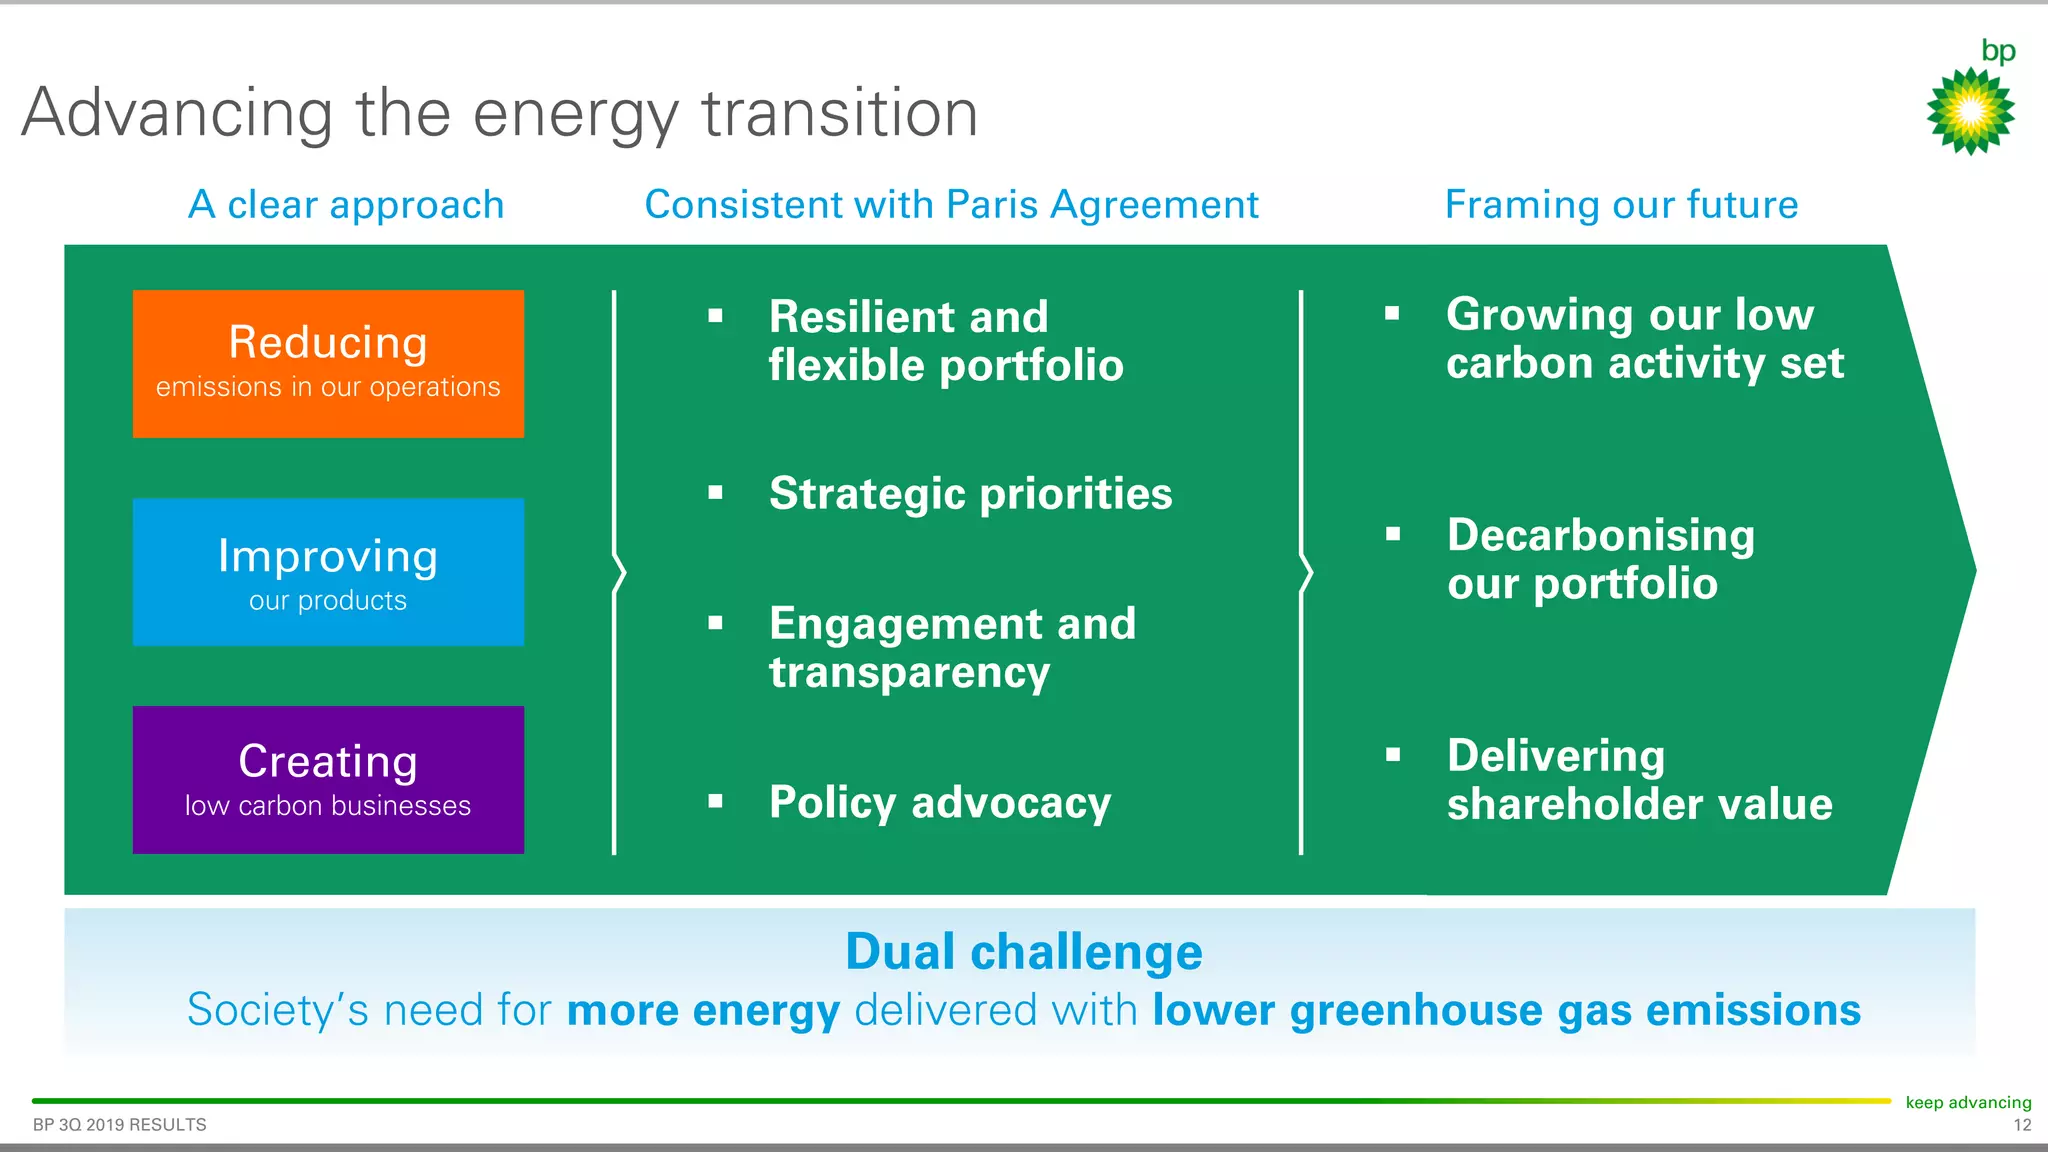

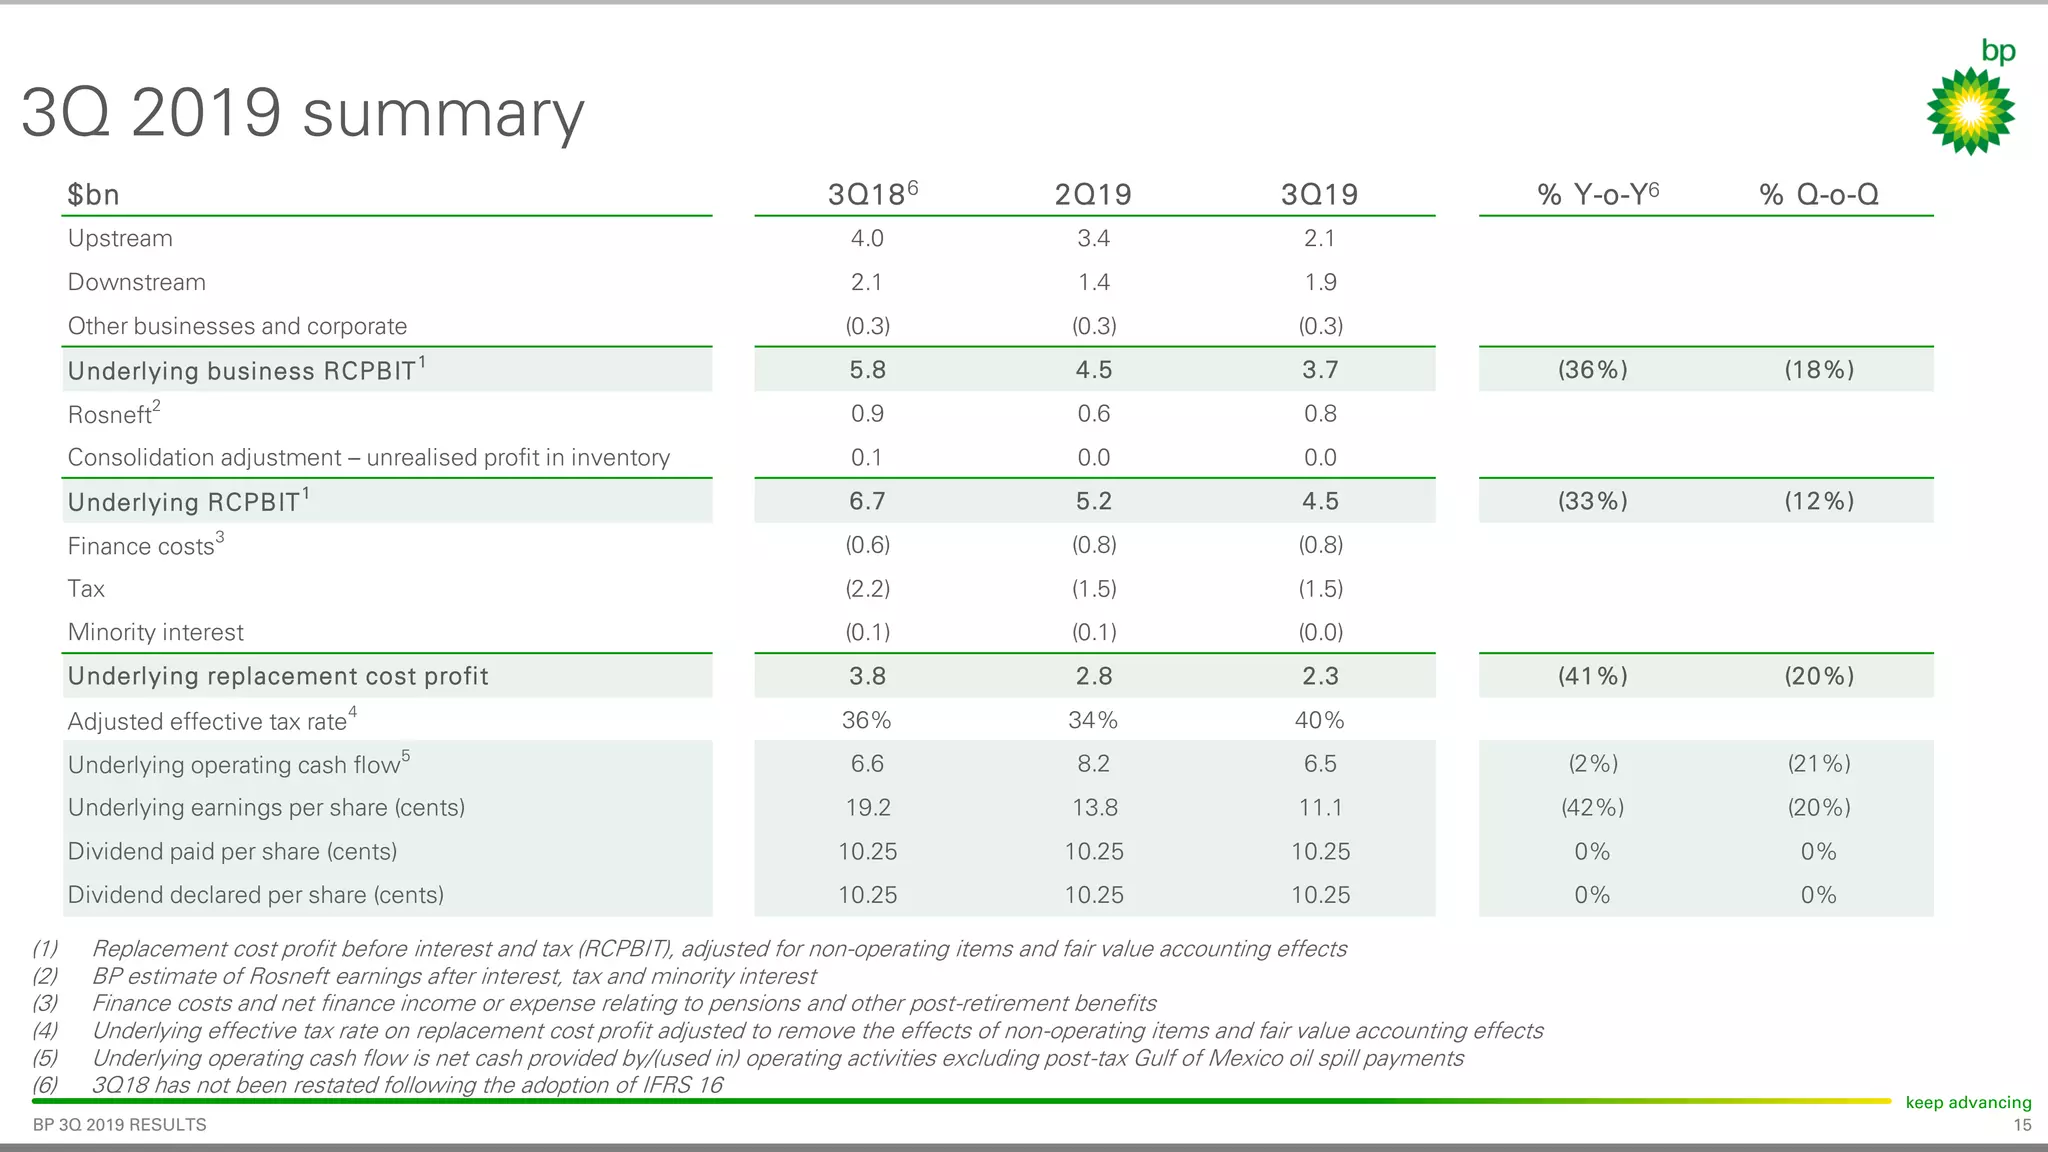
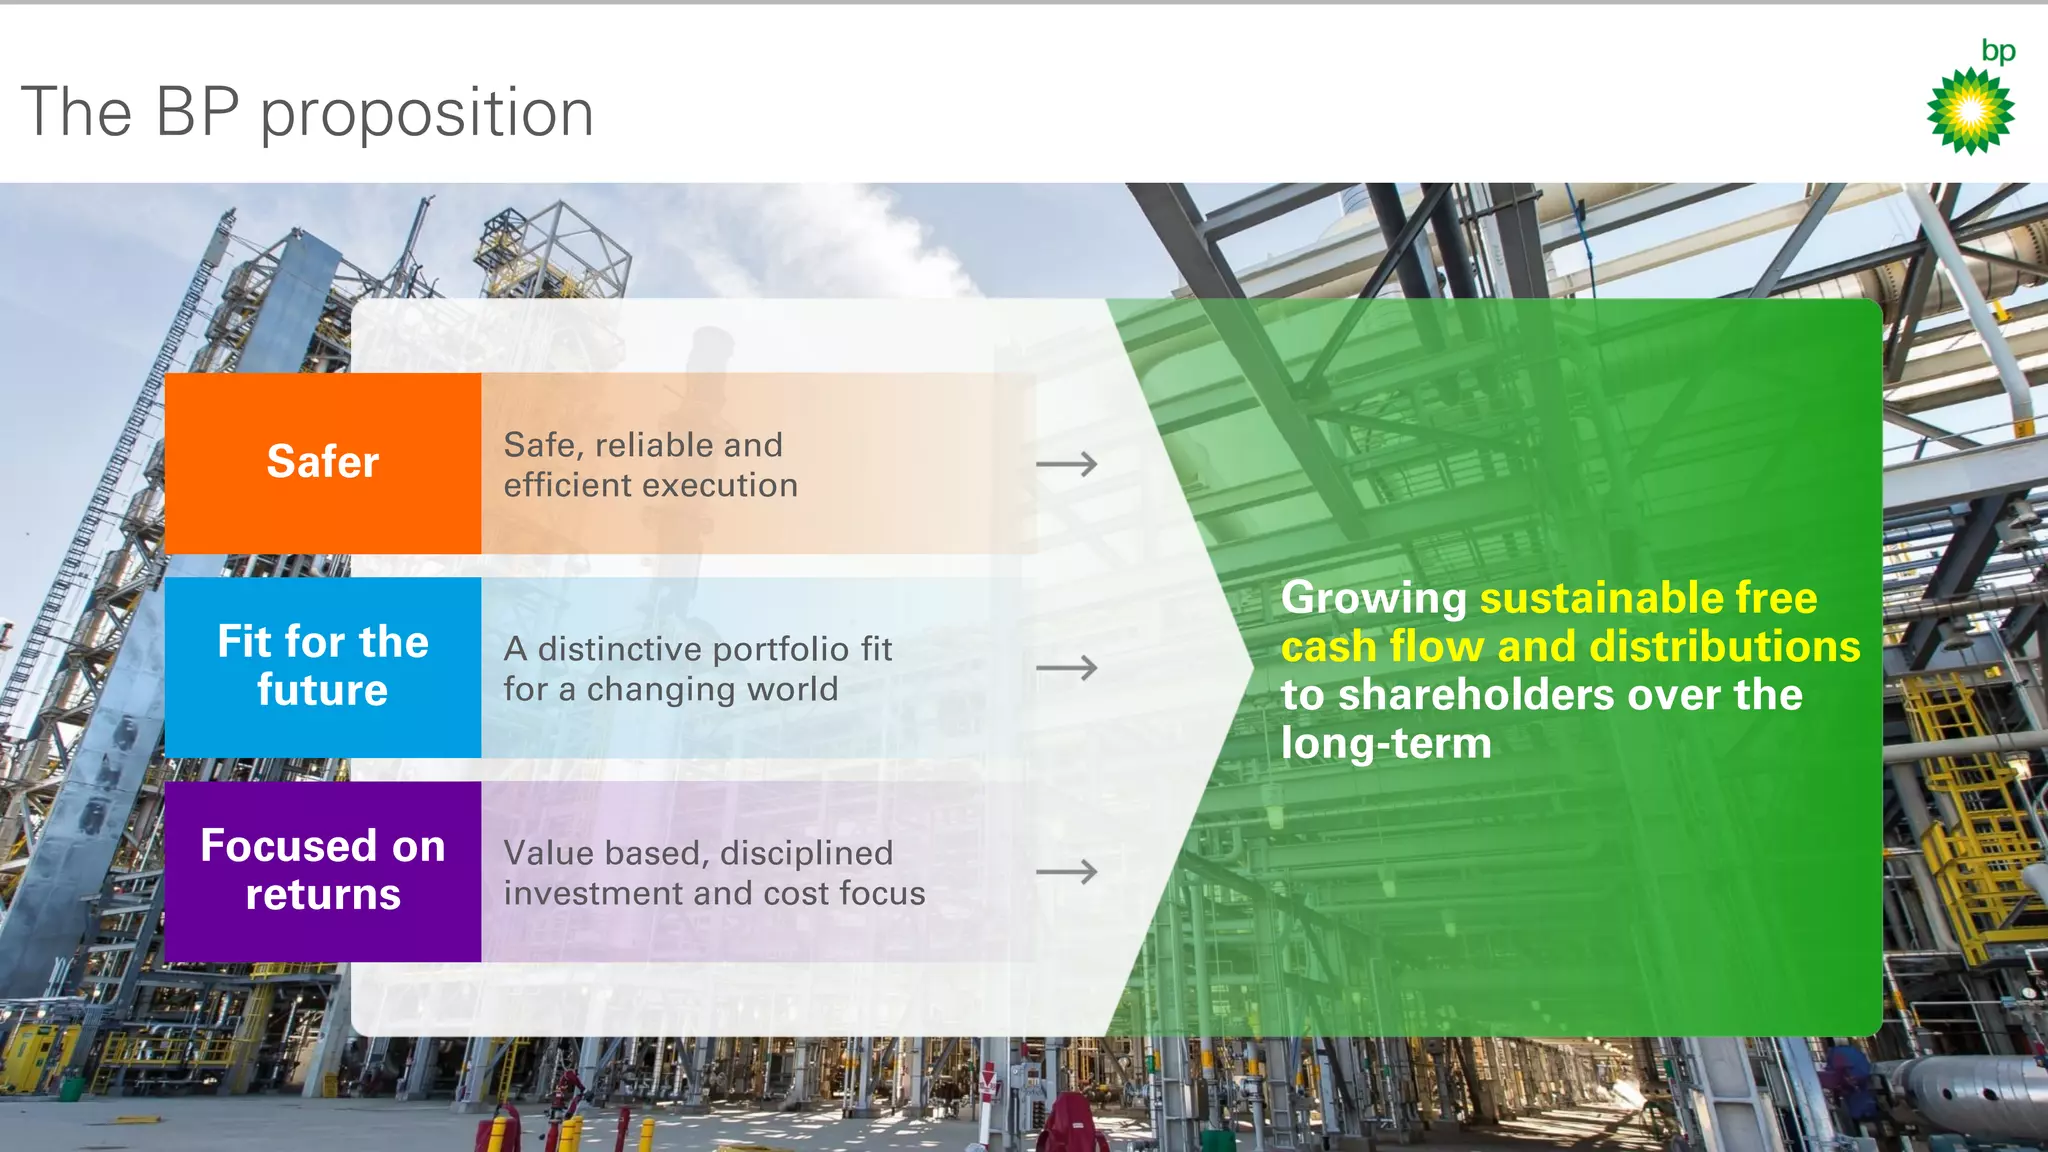

BP reported $2.3 billion in underlying replacement cost profit for 3Q 2019, down from $2.8 billion in 2Q 2019 due to lower oil and gas prices and production impacts from adverse weather. Cash flow from operations was $6.5 billion for the quarter. BP continues to advance its strategy and energy transition, announcing partnerships to expand electric vehicle charging infrastructure in China and the UK, while growing its solar development business. Production from major projects start-ups and expansion of low carbon businesses supported the company's long-term strategy and financial framework.


