Downloaded 48 times


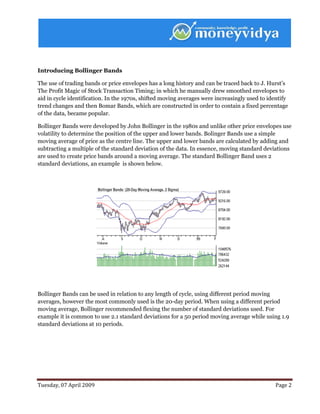

Bollinger Bands, developed by John Bollinger in the 1980s, utilize volatility to create upper and lower price bands around a simple moving average, most commonly using a 20-day period. Two secondary indicators derived from these bands are %b, which indicates the position of the current price within the bands, and bandwidth, which measures the width of the bands as a percentage of the moving average, indicating price volatility. While Bollinger Bands can signal potential buy or sell points, confirming indicators such as RSI or MACD should be used to validate these signals.


![Bollinger Bands powerpoint presentation ]](https://cdn.slidesharecdn.com/ss_thumbnails/redandwhitesimpleminimalistformalthesisdefensepresentation1-260111204004-6282ee28-thumbnail.jpg?width=640&height=640&fit=bounds)


