Downloaded 147 times


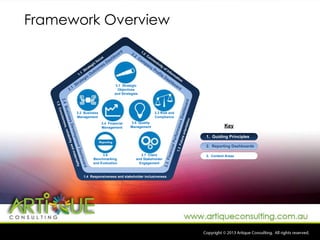

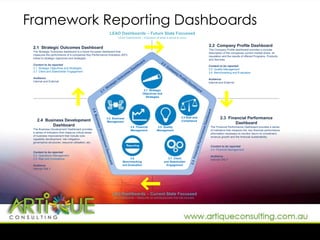

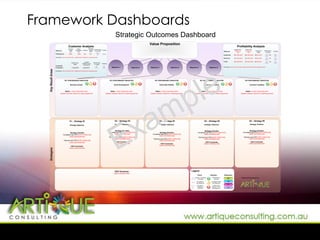


The document provides an overview of an integrated reporting framework for a board of directors. It includes sections on board reporting requirements, typical reporting frameworks, guiding principles, dashboard examples, and content areas. The framework aims to provide concise, reliable information on strategic objectives and performance, business management, risks, finances, quality, benchmarks, and stakeholder engagement. Dashboards include strategic outcomes, company profile, financial performance, and business development. Key principles are strategic focus, connectivity of information, future orientation, and responsiveness.


