Download to read offline
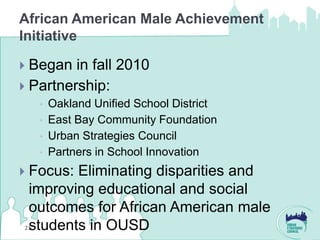
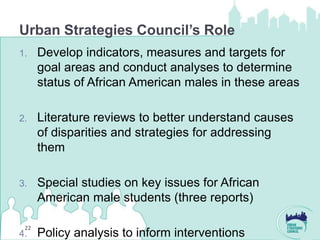
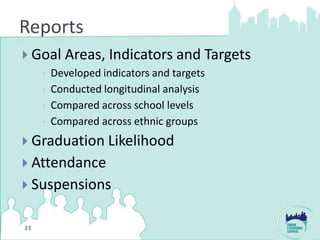
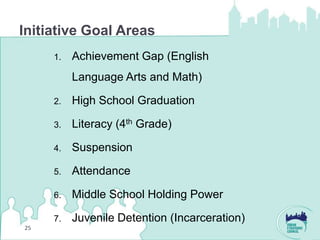
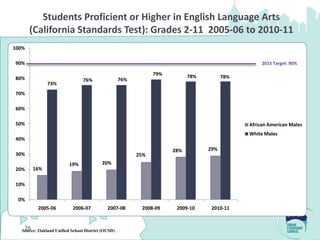
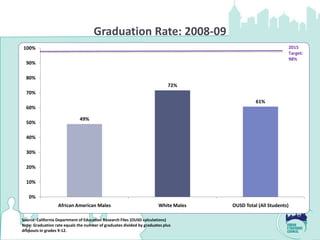
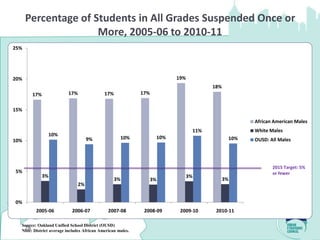


The document outlines the Urban Strategies Council's initiatives focused on improving educational and social outcomes for African American males and boys of color in California, particularly Oakland. It highlights economic benefits linked to higher graduation rates, estimating significant financial returns both for individuals and taxpayers. The document also presents various strategies, partnerships, and action plans aimed at addressing disparities and fostering equity in education and community involvement.


