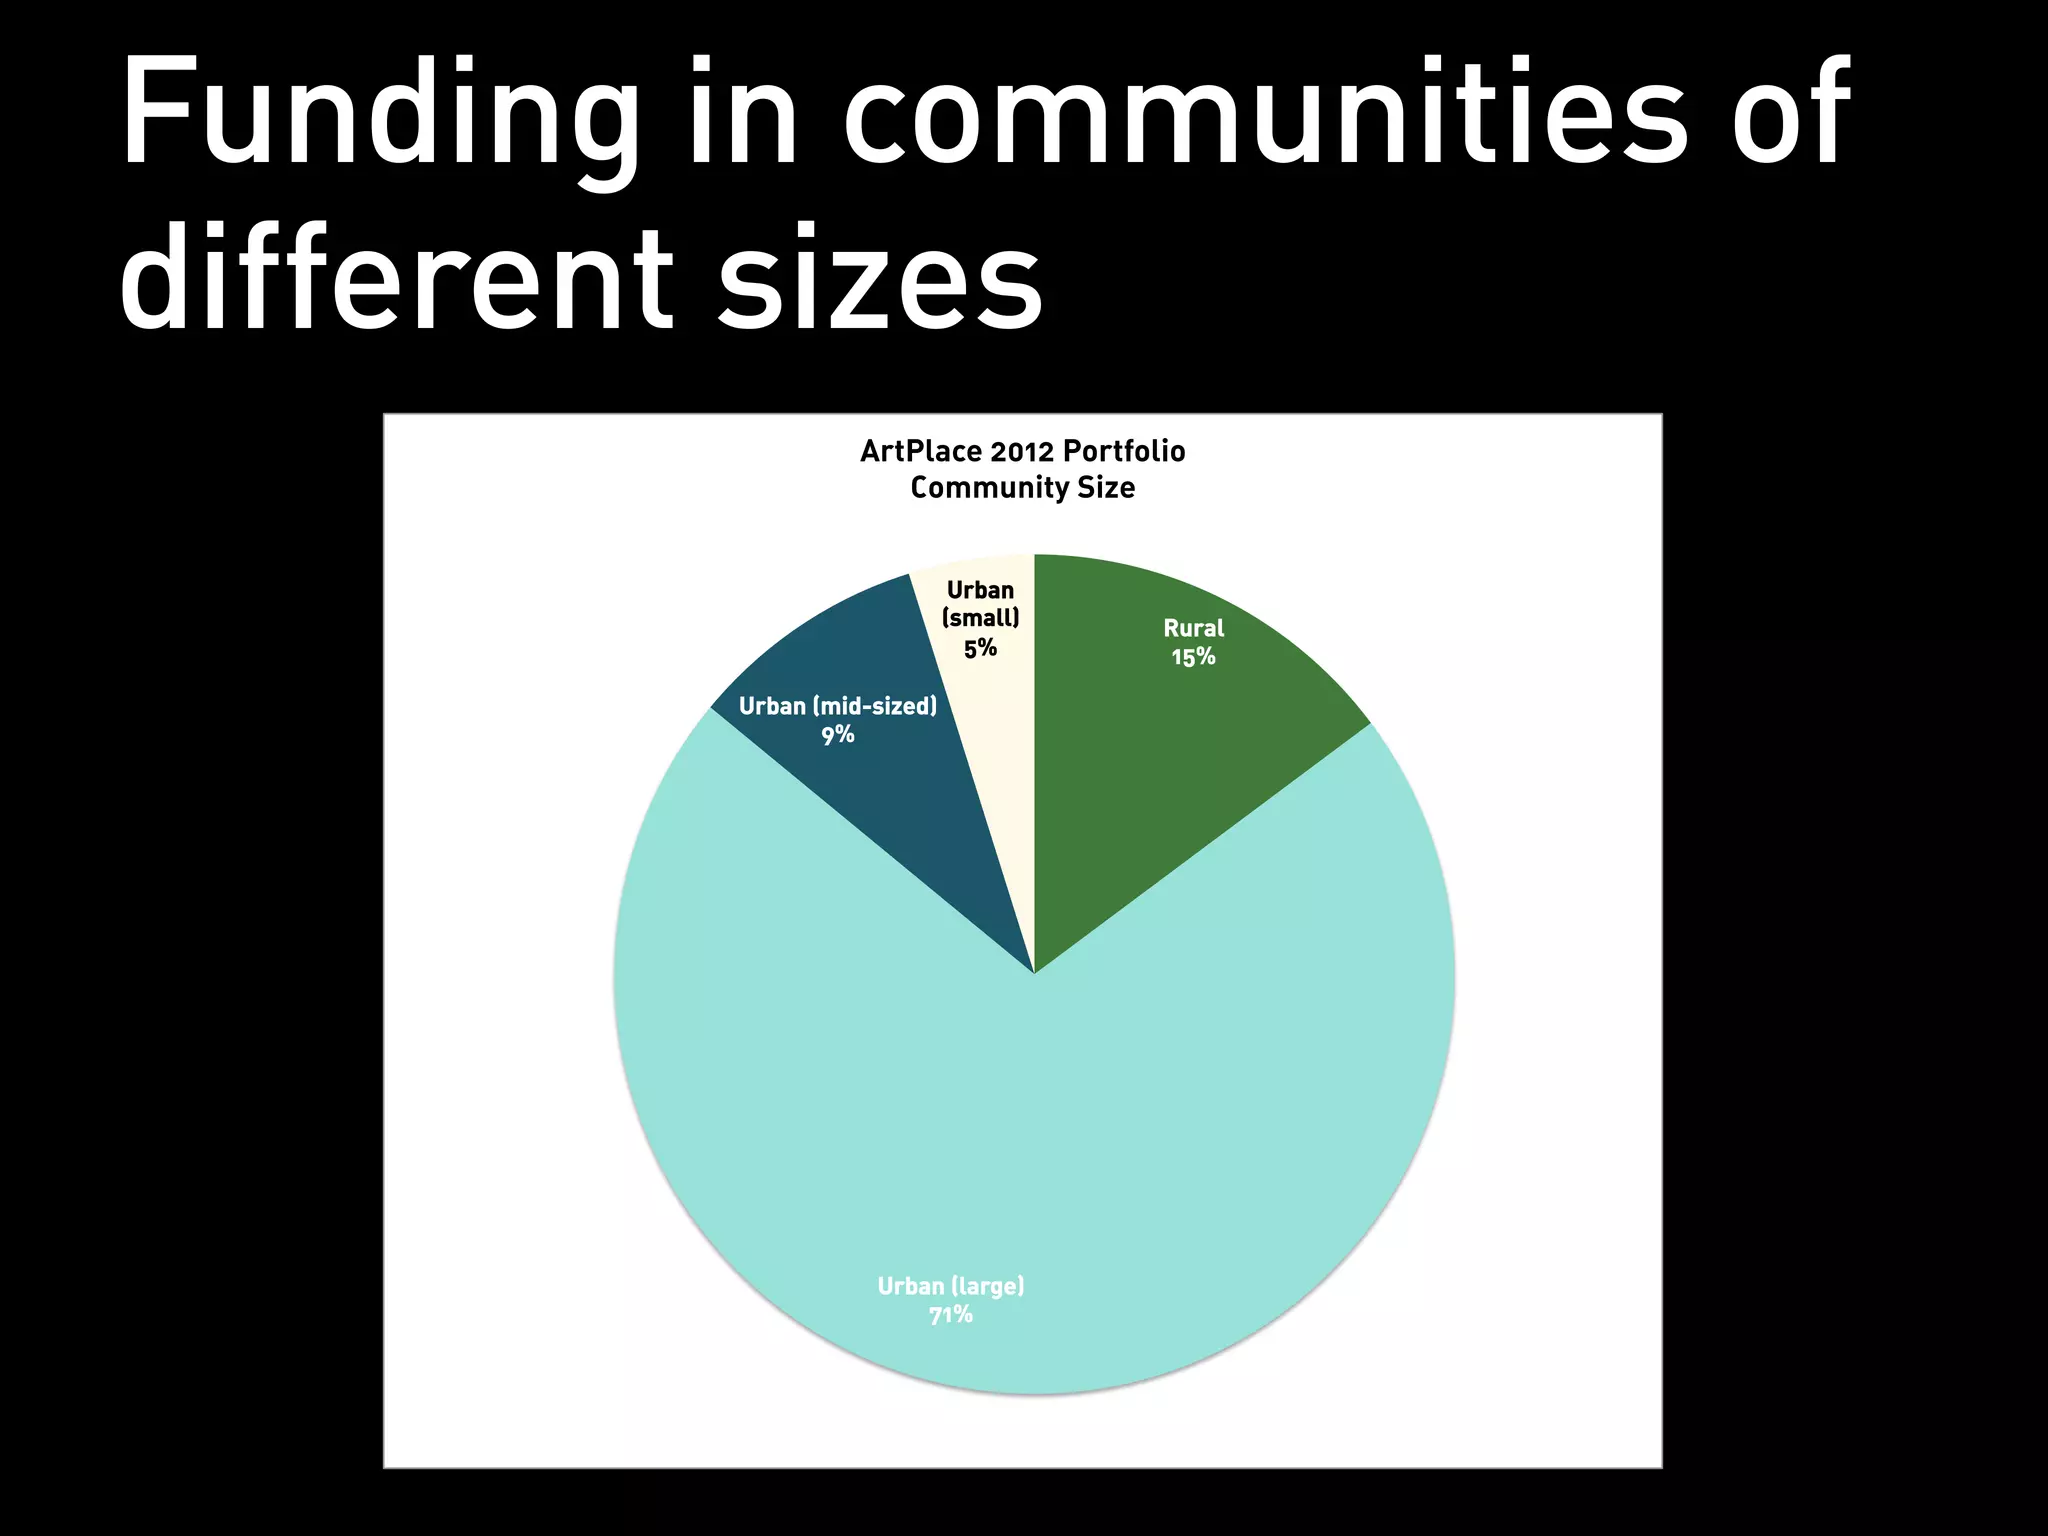
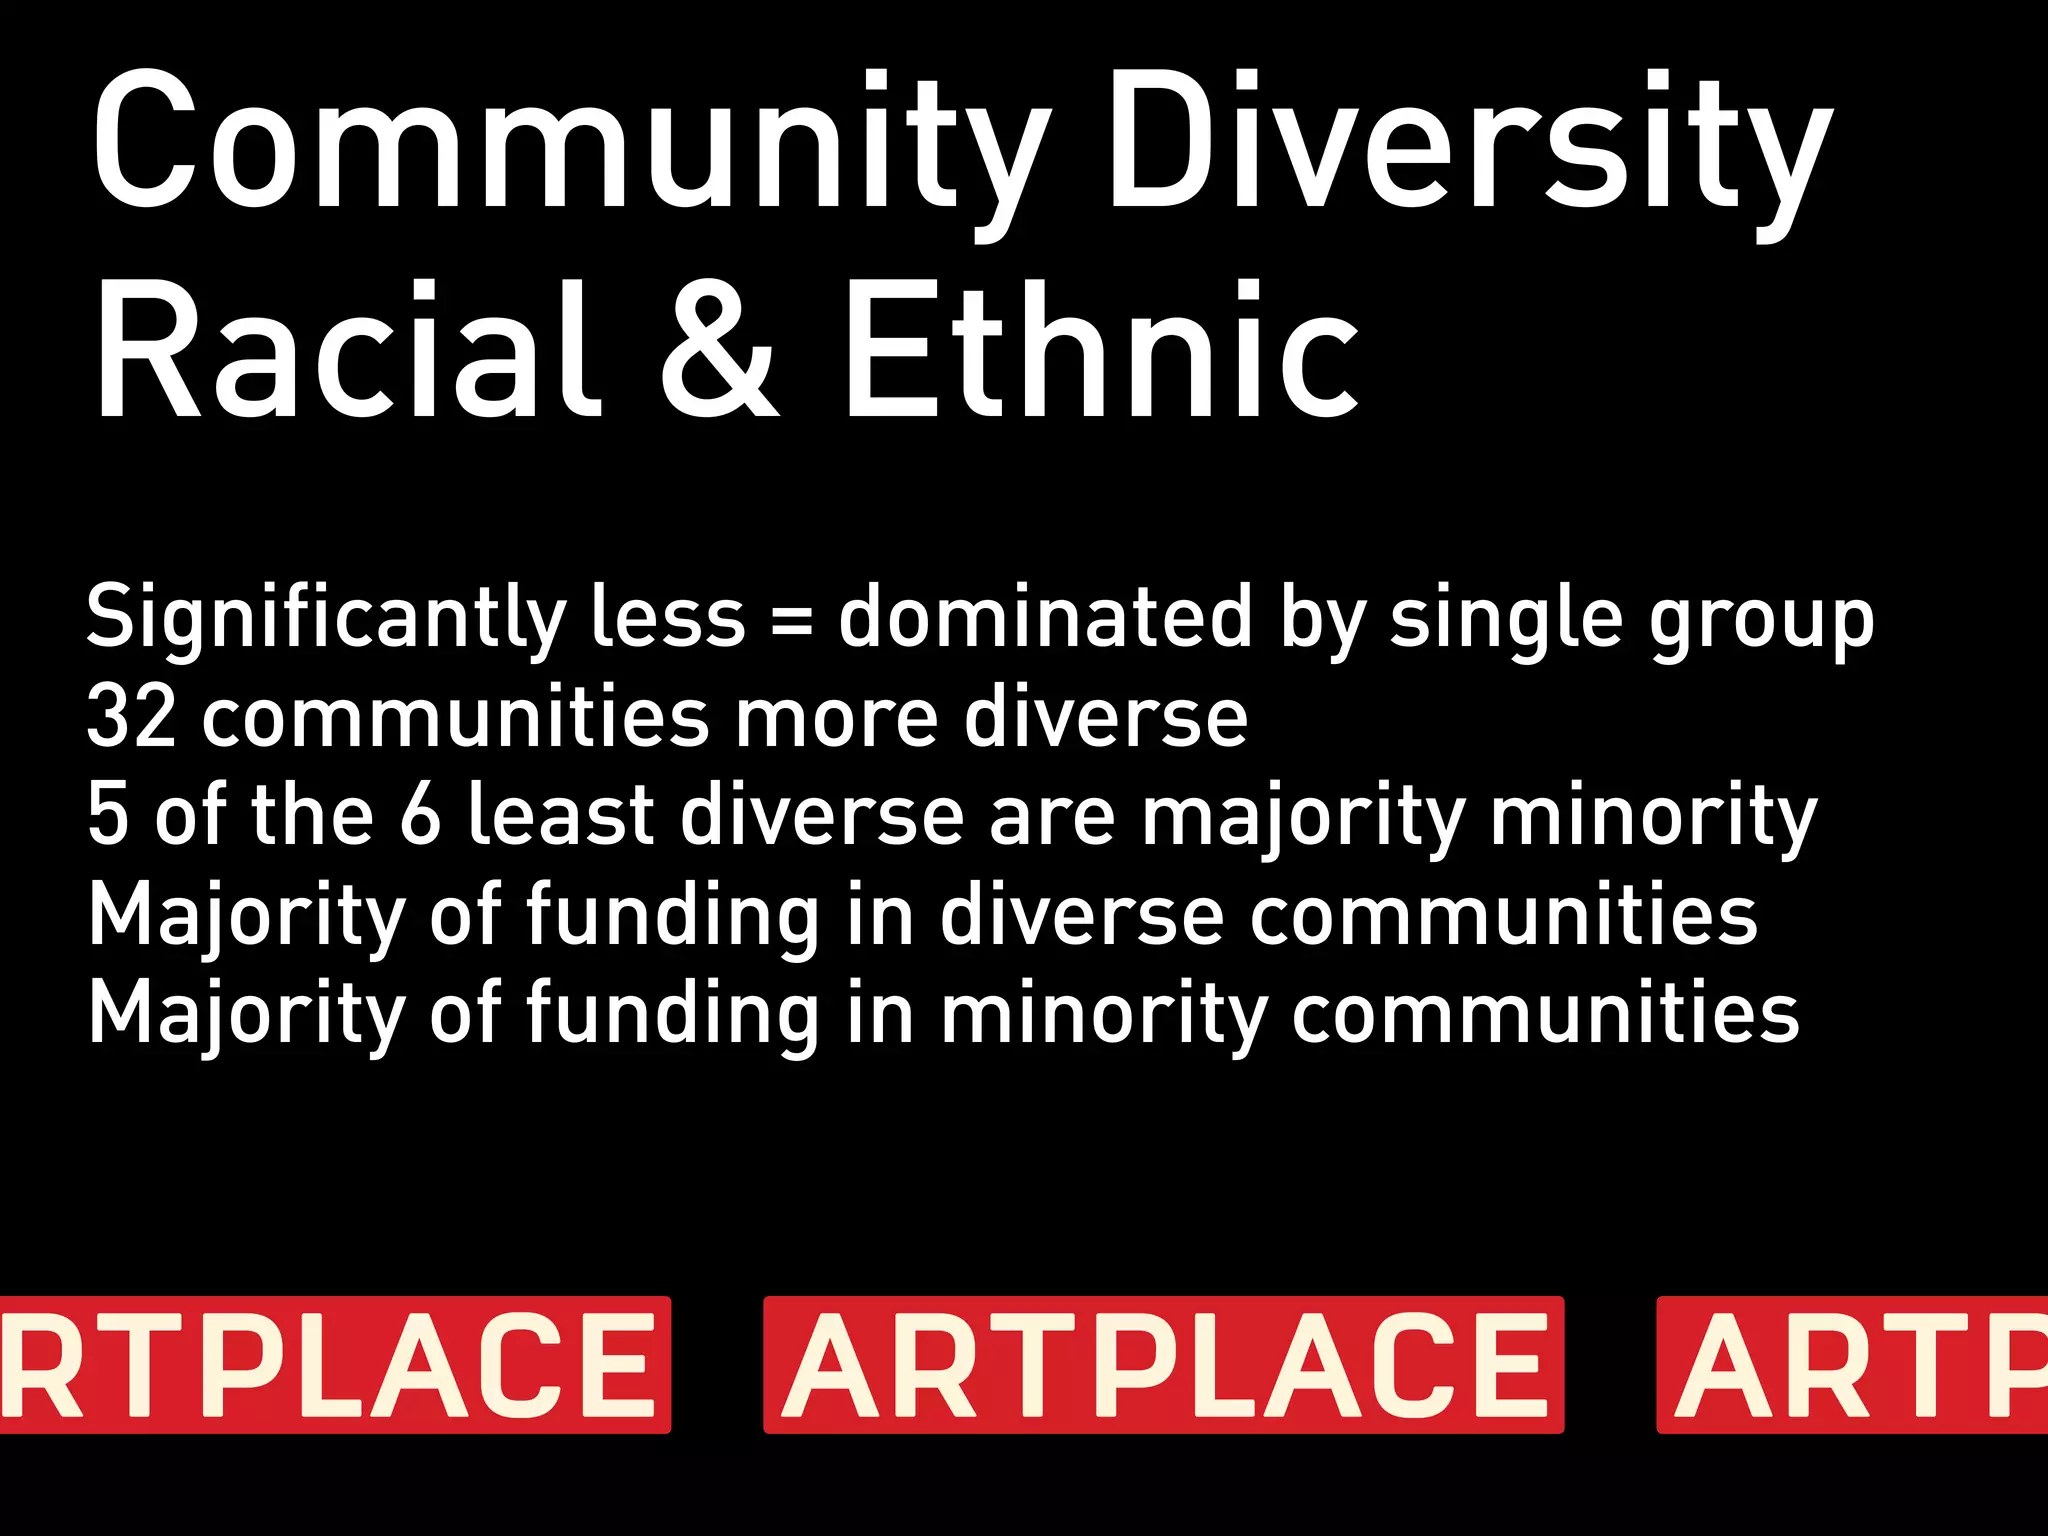
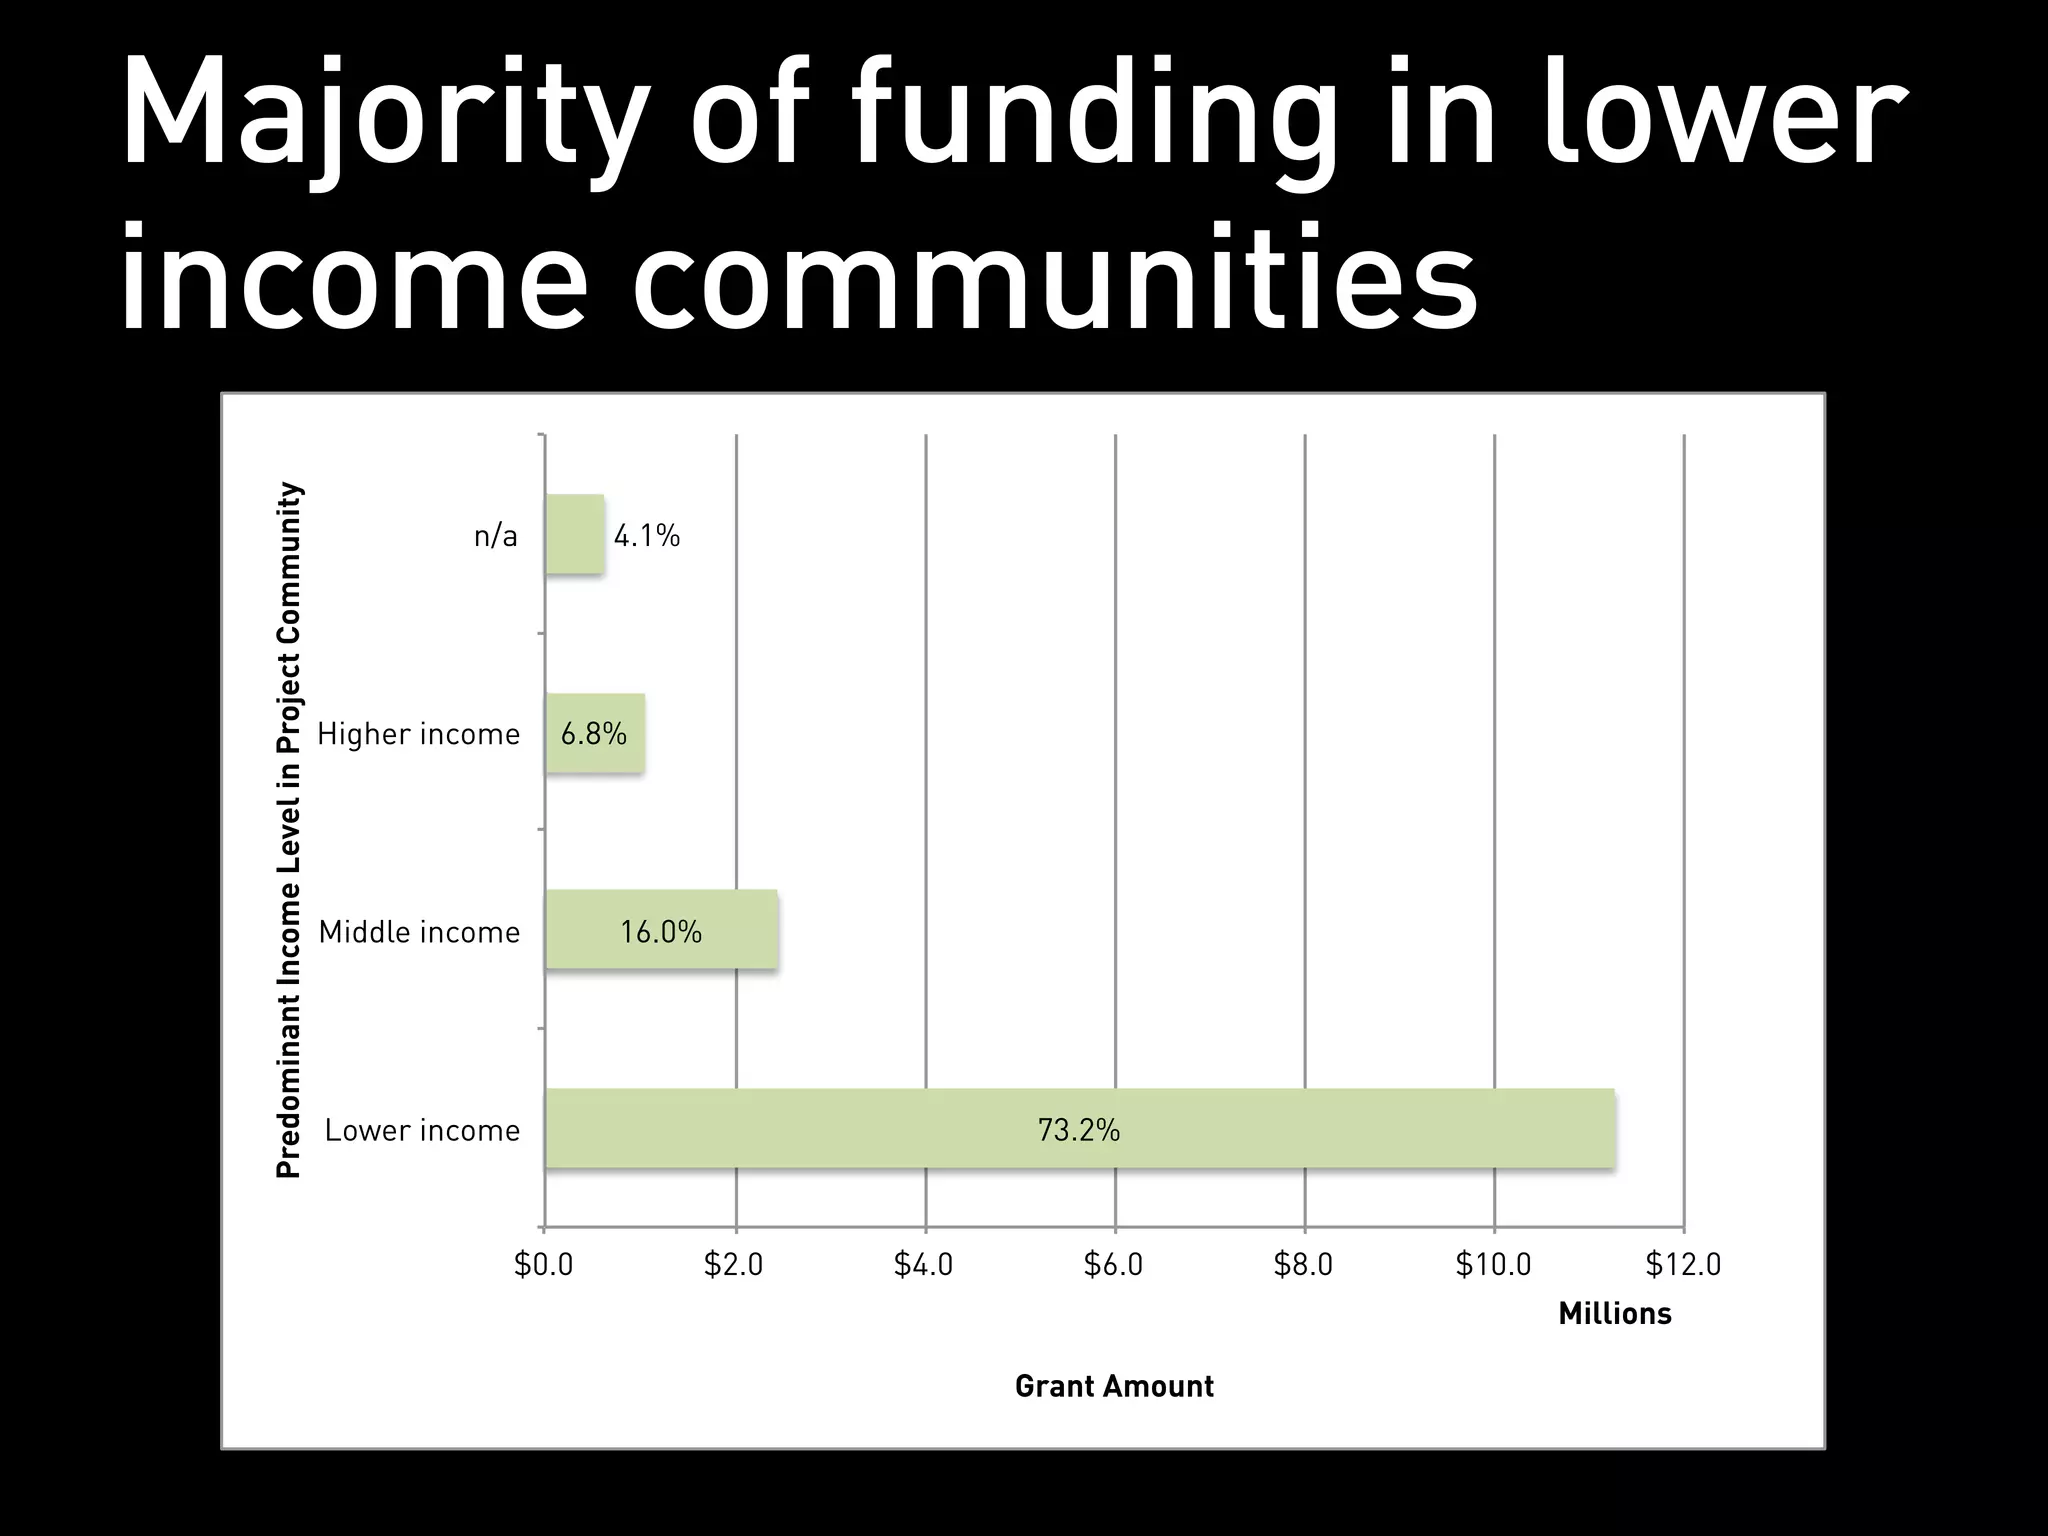
2012 Portfolio
$15.4M
47 projects
22 states
33 communities
Community
Size
Community Size
15% allocated to projects in rural areas
85% allocated to projects in urban areas
Aligns with 2010 Census population figures
Funding in communities of
different sizes
                  ArtPlace 2012 Portfolio
                     Community Size


                             Urban
                            (small)    Rural
                              5%        15%

        Urban (mid-sized)
               9%


                   Urban (large)
                       71%
Community
Diversity:
Racial &
Ethnic
ArtPlace communities are
on average more ethnically
diverse than the metro
areas or counties of which
they are a part. Those that
are less diverse are
composed primarily of
minority populations.
Community Diversity
Racial & Ethnic
Represents the probability that two residents
drawn randomly from the census tract would
be from different/racial ethnic groups

Compares project census tract to its metro
area or county for rural projects
Community Diversity
Racial & Ethnic
Significantly less = dominated by single group
32 communities more diverse
5 of the 6 least diverse are majority minority
Majority of funding in diverse communities
Majority of funding in minority communities
Racial & Ethnic Diversity/     # of
             Dominant Group               Projects Grant Amount
             Significantly less               3        1,328,195
                Black                         3        1,328,195
             Slightly less                    3          715,900
                Hispanic                      2          640,900
                White                         1           75,000
             A roughly average level          7        2,263,579
                Black                         1           400,000
                Hispanic                      1           600,000
Increasing      White                         5        1,263,579
 Diversity   Slightly more                   11        3,561,177
                Black                         3        1,025,000
                Hispanic                      2           710,000
                White                         5        1,626,177
                Asian                         1           200,000
             Significantly more              21        6,905,000
                Black                         6        1,903,500
                Hispanic                      2           554,000
                White                        11        3,947,500
                Asian                         1           250,000
                Other                         1           250,000
             n/a                              2          625,000
                n/a                           2          625,000
             Grand Total                     47      15,398,851
Majority of funding in
diverse communities
                        ArtPlace 2012 Portfolio
                    Community Racial & Ethnic Diversity


                                 n/a
                                 4%    Significantly
                                           less
                                            6%
                                                    Slightly less
                                                         6%


                                                         A roughly average
                                                               level
                                                                15%

        Significantly more
               45%


                                                     Slightly more
                                                          24%
Majority of funding in
minority communities
                                                                    n/a              4.1%
   Predominant Racial/Ethnic Group in Project Community


                                                                  Other           1.6%


                                                                  Asian            2.9%


                                                               Hispanic                  16.3%


                                                                  Black                            30.2%


                                                                  White                                       44.9%


                                                          Total Minority                                          51.1%


                                                                           $0.0      $1.0        $2.0      $3.0       $4.0   $5.0   $6.0   $7.0   $8.0     $9.0
                                                                                                                  Grant Amount                      Millions
Community
Diversity:
Income
ArtPlace communities have
less income diversity than
the metro areas or counties
of which they are a part.
These communities are
typically much poorer than
the metro areas or counties
of which they are a part.
Community Diversity
Income
Measures the degree to which there are a mix
of incomes in a neighborhood, with an
emphasis on families in the middle

Compares project census tract to its metro
area or county for rural projects
Community Diversity
Income
Significantly less = dominated by single level
33 predominantly lower income
$11.3M for lower income communities
Income Diversity/ Dominant Level   # of Projects   Grant Amount
             Significantly less                       20             6,619,891
                Higher income                          2                365,619
                Lower income                          18             6,254,272
             Slightly less                            10             3,727,500
                Higher income                          1                400,000
Increasing      Lower income                           9             3,327,500
             A roughly average level                  10             3,043,460
 Diversity      Lower income                           5             1,393,460
                Middle income                          5             1,650,000
             Slightly more                             2                548,000
                Higher income                          1                275,000
                Middle income                          1                273,000
             Significantly more                        3                835,000
                Lower income                           1                295,000
                Middle income                          2                540,000
             n/a                                       2               625,000
                n/a                                    2               625,000
             Grand Total                              47           15,398,851
Majority of funding in less
income diverse communities
                                     ArtPlace 2012 Portfolio
                                   Community Income Diversity

                                               n/a
                                               4%

                             Significantly
                                more
                                 7%
                  Slightly
                   more
                    4%


                                                                Significantly less
                                                                       43%

      A roughly average level
               21%


                                       Slightly less
                                           21%
Majority of funding in lower
income communities
  Predominant Income Level in Project Community


                                                           n/a       4.1%


                                                  Higher income   6.8%


                                                  Middle income      16.0%


                                                  Lower income                              73.2%


                                                              $0.0           $2.0   $4.0       $6.0       $8.0   $10.0         $12.0
                                                                                                                         Millions

                                                                                           Grant Amount
ArtPlace 2012 Portfolio

ArtPlace 2012 Portfolio

  • 2.
  • 3.
  • 4.
    Community Size 15% allocatedto projects in rural areas 85% allocated to projects in urban areas Aligns with 2010 Census population figures
  • 5.
    Funding in communitiesof different sizes ArtPlace 2012 Portfolio Community Size Urban (small) Rural 5% 15% Urban (mid-sized) 9% Urban (large) 71%
  • 6.
  • 7.
    ArtPlace communities are onaverage more ethnically diverse than the metro areas or counties of which they are a part. Those that are less diverse are composed primarily of minority populations.
  • 8.
    Community Diversity Racial &Ethnic Represents the probability that two residents drawn randomly from the census tract would be from different/racial ethnic groups Compares project census tract to its metro area or county for rural projects
  • 9.
    Community Diversity Racial &Ethnic Significantly less = dominated by single group 32 communities more diverse 5 of the 6 least diverse are majority minority Majority of funding in diverse communities Majority of funding in minority communities
  • 10.
    Racial & EthnicDiversity/ # of Dominant Group Projects Grant Amount Significantly less 3 1,328,195 Black 3 1,328,195 Slightly less 3 715,900 Hispanic 2 640,900 White 1 75,000 A roughly average level 7 2,263,579 Black 1 400,000 Hispanic 1 600,000 Increasing White 5 1,263,579 Diversity Slightly more 11 3,561,177 Black 3 1,025,000 Hispanic 2 710,000 White 5 1,626,177 Asian 1 200,000 Significantly more 21 6,905,000 Black 6 1,903,500 Hispanic 2 554,000 White 11 3,947,500 Asian 1 250,000 Other 1 250,000 n/a 2 625,000 n/a 2 625,000 Grand Total 47 15,398,851
  • 11.
    Majority of fundingin diverse communities ArtPlace 2012 Portfolio Community Racial & Ethnic Diversity n/a 4% Significantly less 6% Slightly less 6% A roughly average level 15% Significantly more 45% Slightly more 24%
  • 12.
    Majority of fundingin minority communities n/a 4.1% Predominant Racial/Ethnic Group in Project Community Other 1.6% Asian 2.9% Hispanic 16.3% Black 30.2% White 44.9% Total Minority 51.1% $0.0 $1.0 $2.0 $3.0 $4.0 $5.0 $6.0 $7.0 $8.0 $9.0 Grant Amount Millions
  • 13.
  • 14.
    ArtPlace communities have lessincome diversity than the metro areas or counties of which they are a part. These communities are typically much poorer than the metro areas or counties of which they are a part.
  • 15.
    Community Diversity Income Measures thedegree to which there are a mix of incomes in a neighborhood, with an emphasis on families in the middle Compares project census tract to its metro area or county for rural projects
  • 16.
    Community Diversity Income Significantly less= dominated by single level 33 predominantly lower income $11.3M for lower income communities
  • 17.
    Income Diversity/ DominantLevel # of Projects Grant Amount Significantly less 20 6,619,891 Higher income 2 365,619 Lower income 18 6,254,272 Slightly less 10 3,727,500 Higher income 1 400,000 Increasing Lower income 9 3,327,500 A roughly average level 10 3,043,460 Diversity Lower income 5 1,393,460 Middle income 5 1,650,000 Slightly more 2 548,000 Higher income 1 275,000 Middle income 1 273,000 Significantly more 3 835,000 Lower income 1 295,000 Middle income 2 540,000 n/a 2 625,000 n/a 2 625,000 Grand Total 47 15,398,851
  • 18.
    Majority of fundingin less income diverse communities ArtPlace 2012 Portfolio Community Income Diversity n/a 4% Significantly more 7% Slightly more 4% Significantly less 43% A roughly average level 21% Slightly less 21%
  • 19.
    Majority of fundingin lower income communities Predominant Income Level in Project Community n/a 4.1% Higher income 6.8% Middle income 16.0% Lower income 73.2% $0.0 $2.0 $4.0 $6.0 $8.0 $10.0 $12.0 Millions Grant Amount