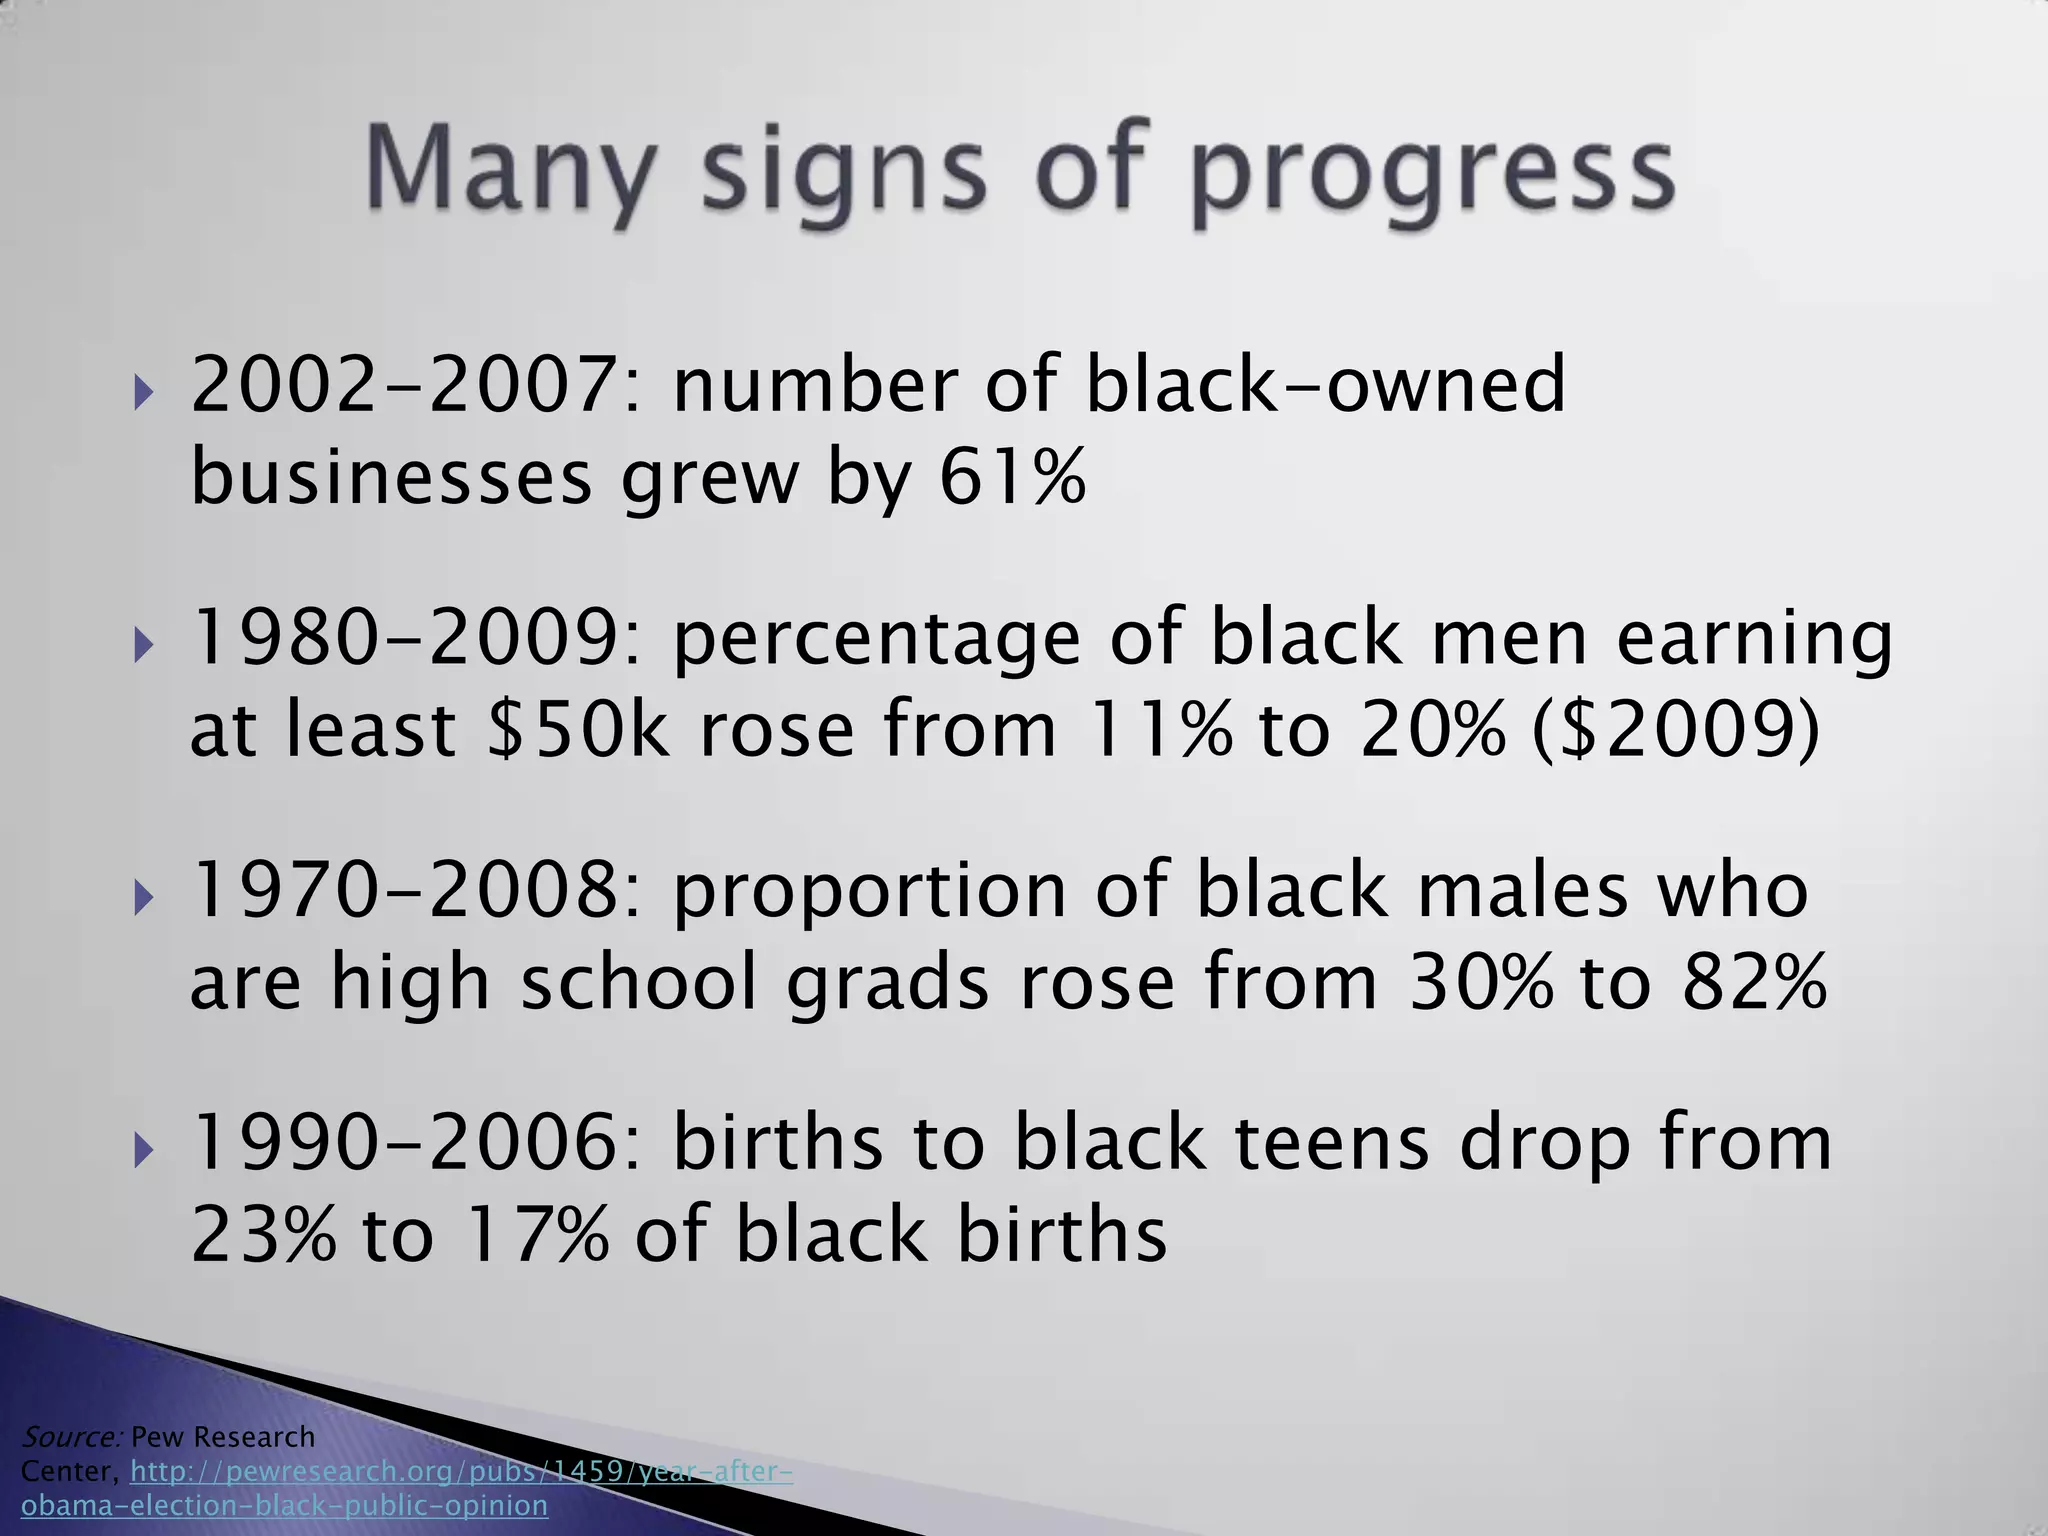
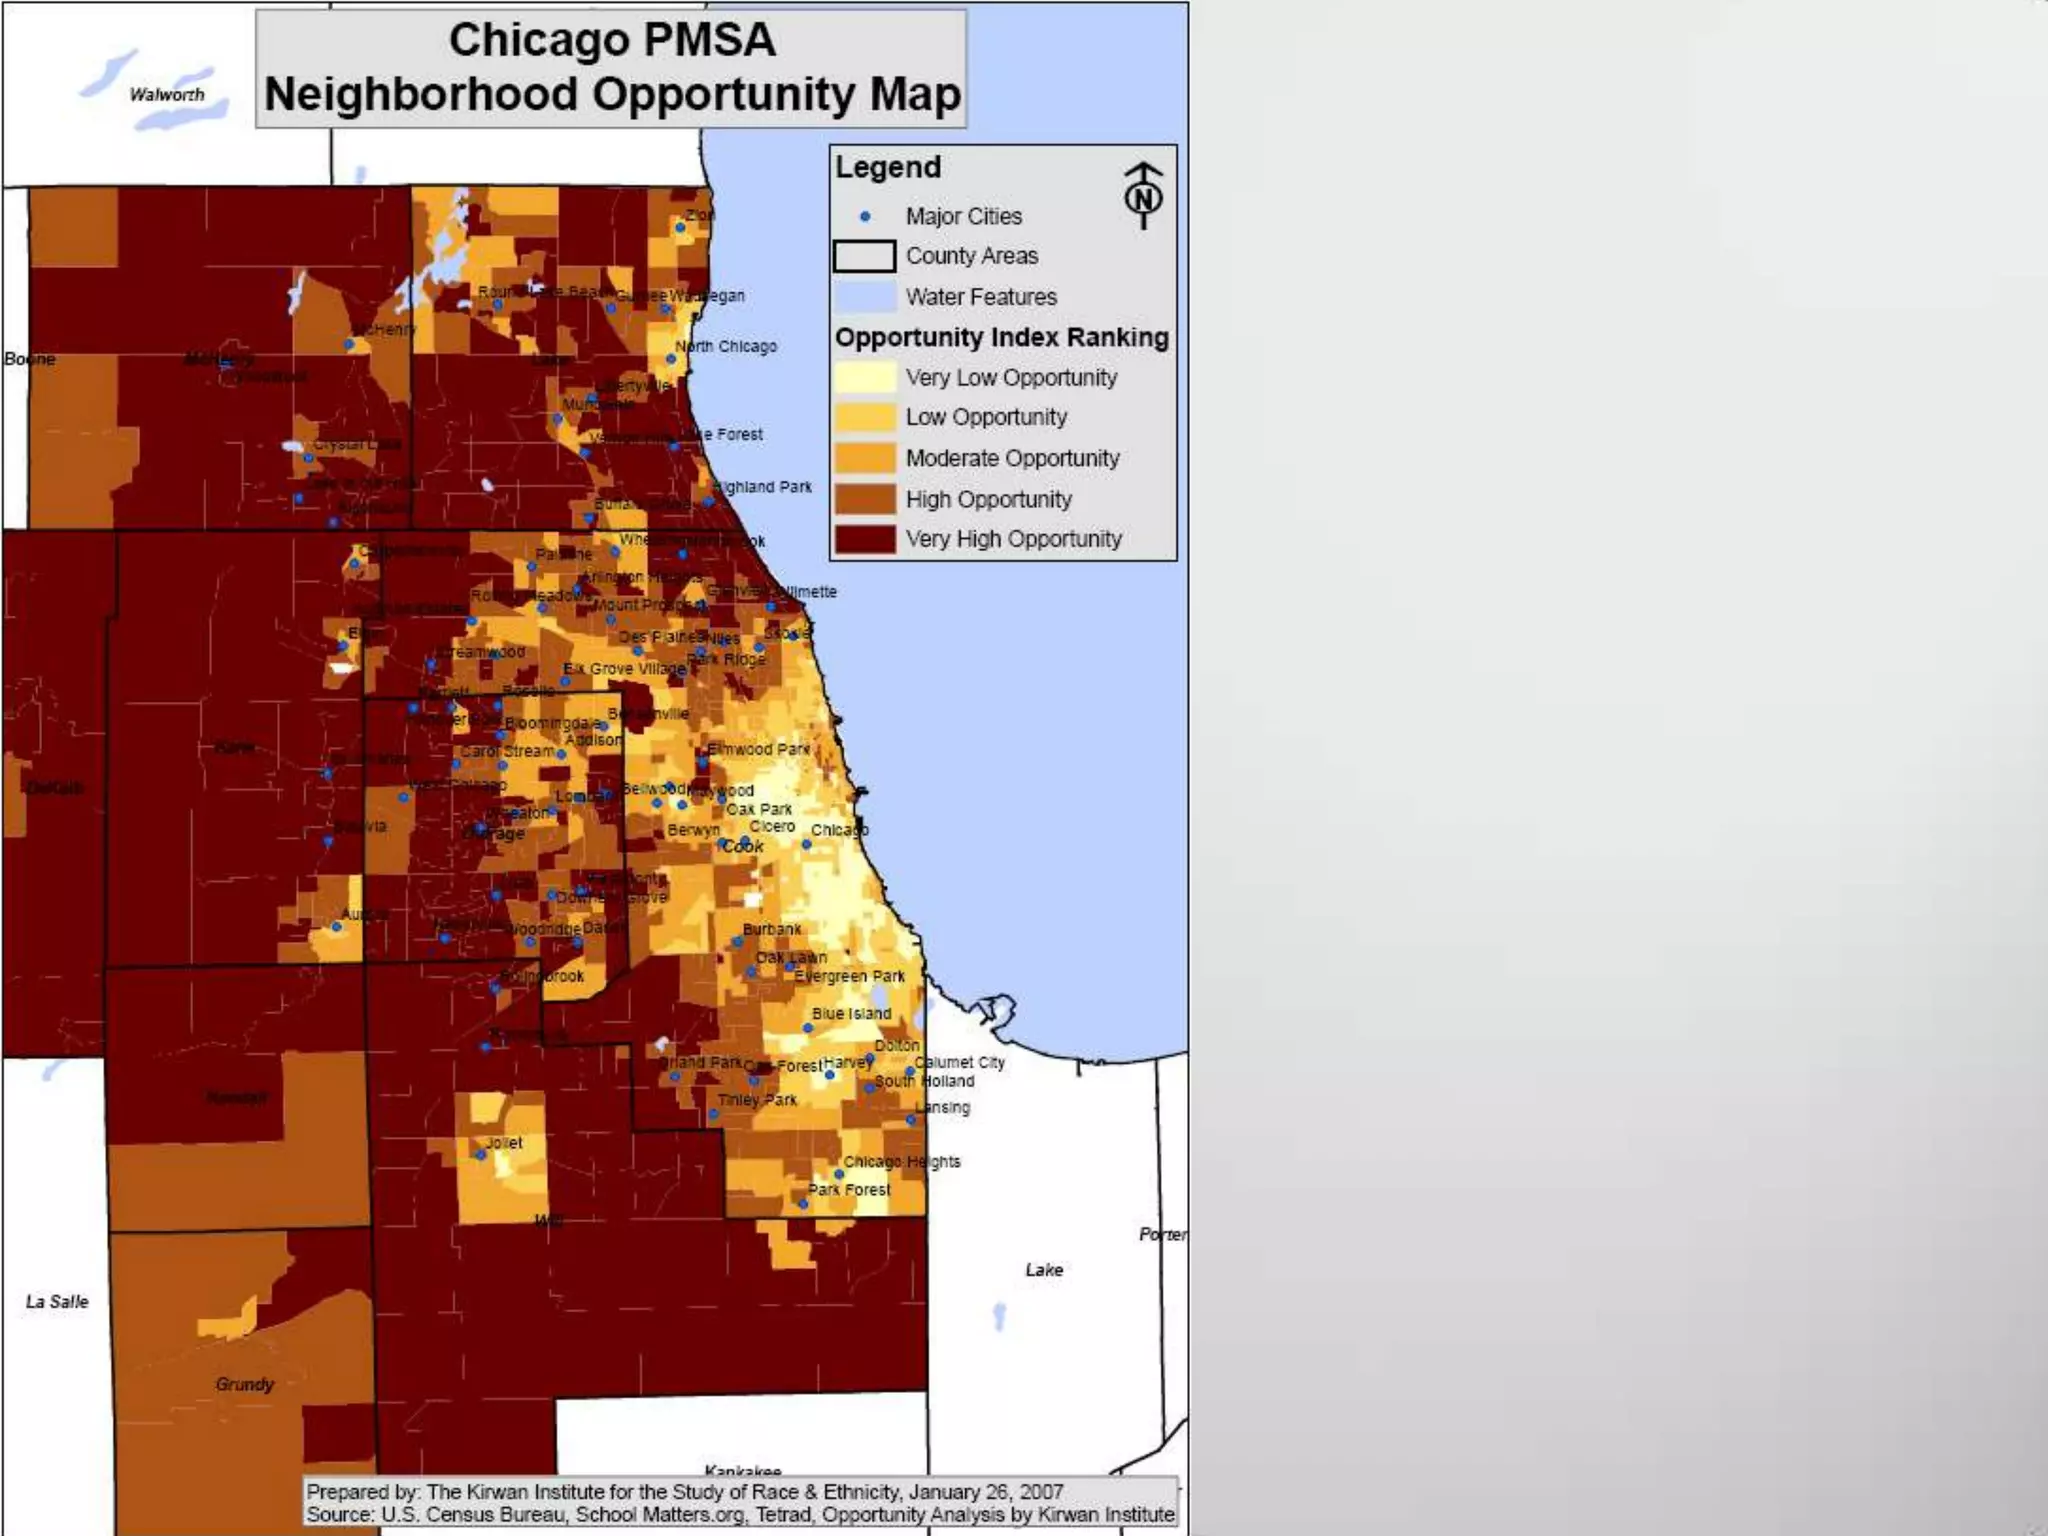
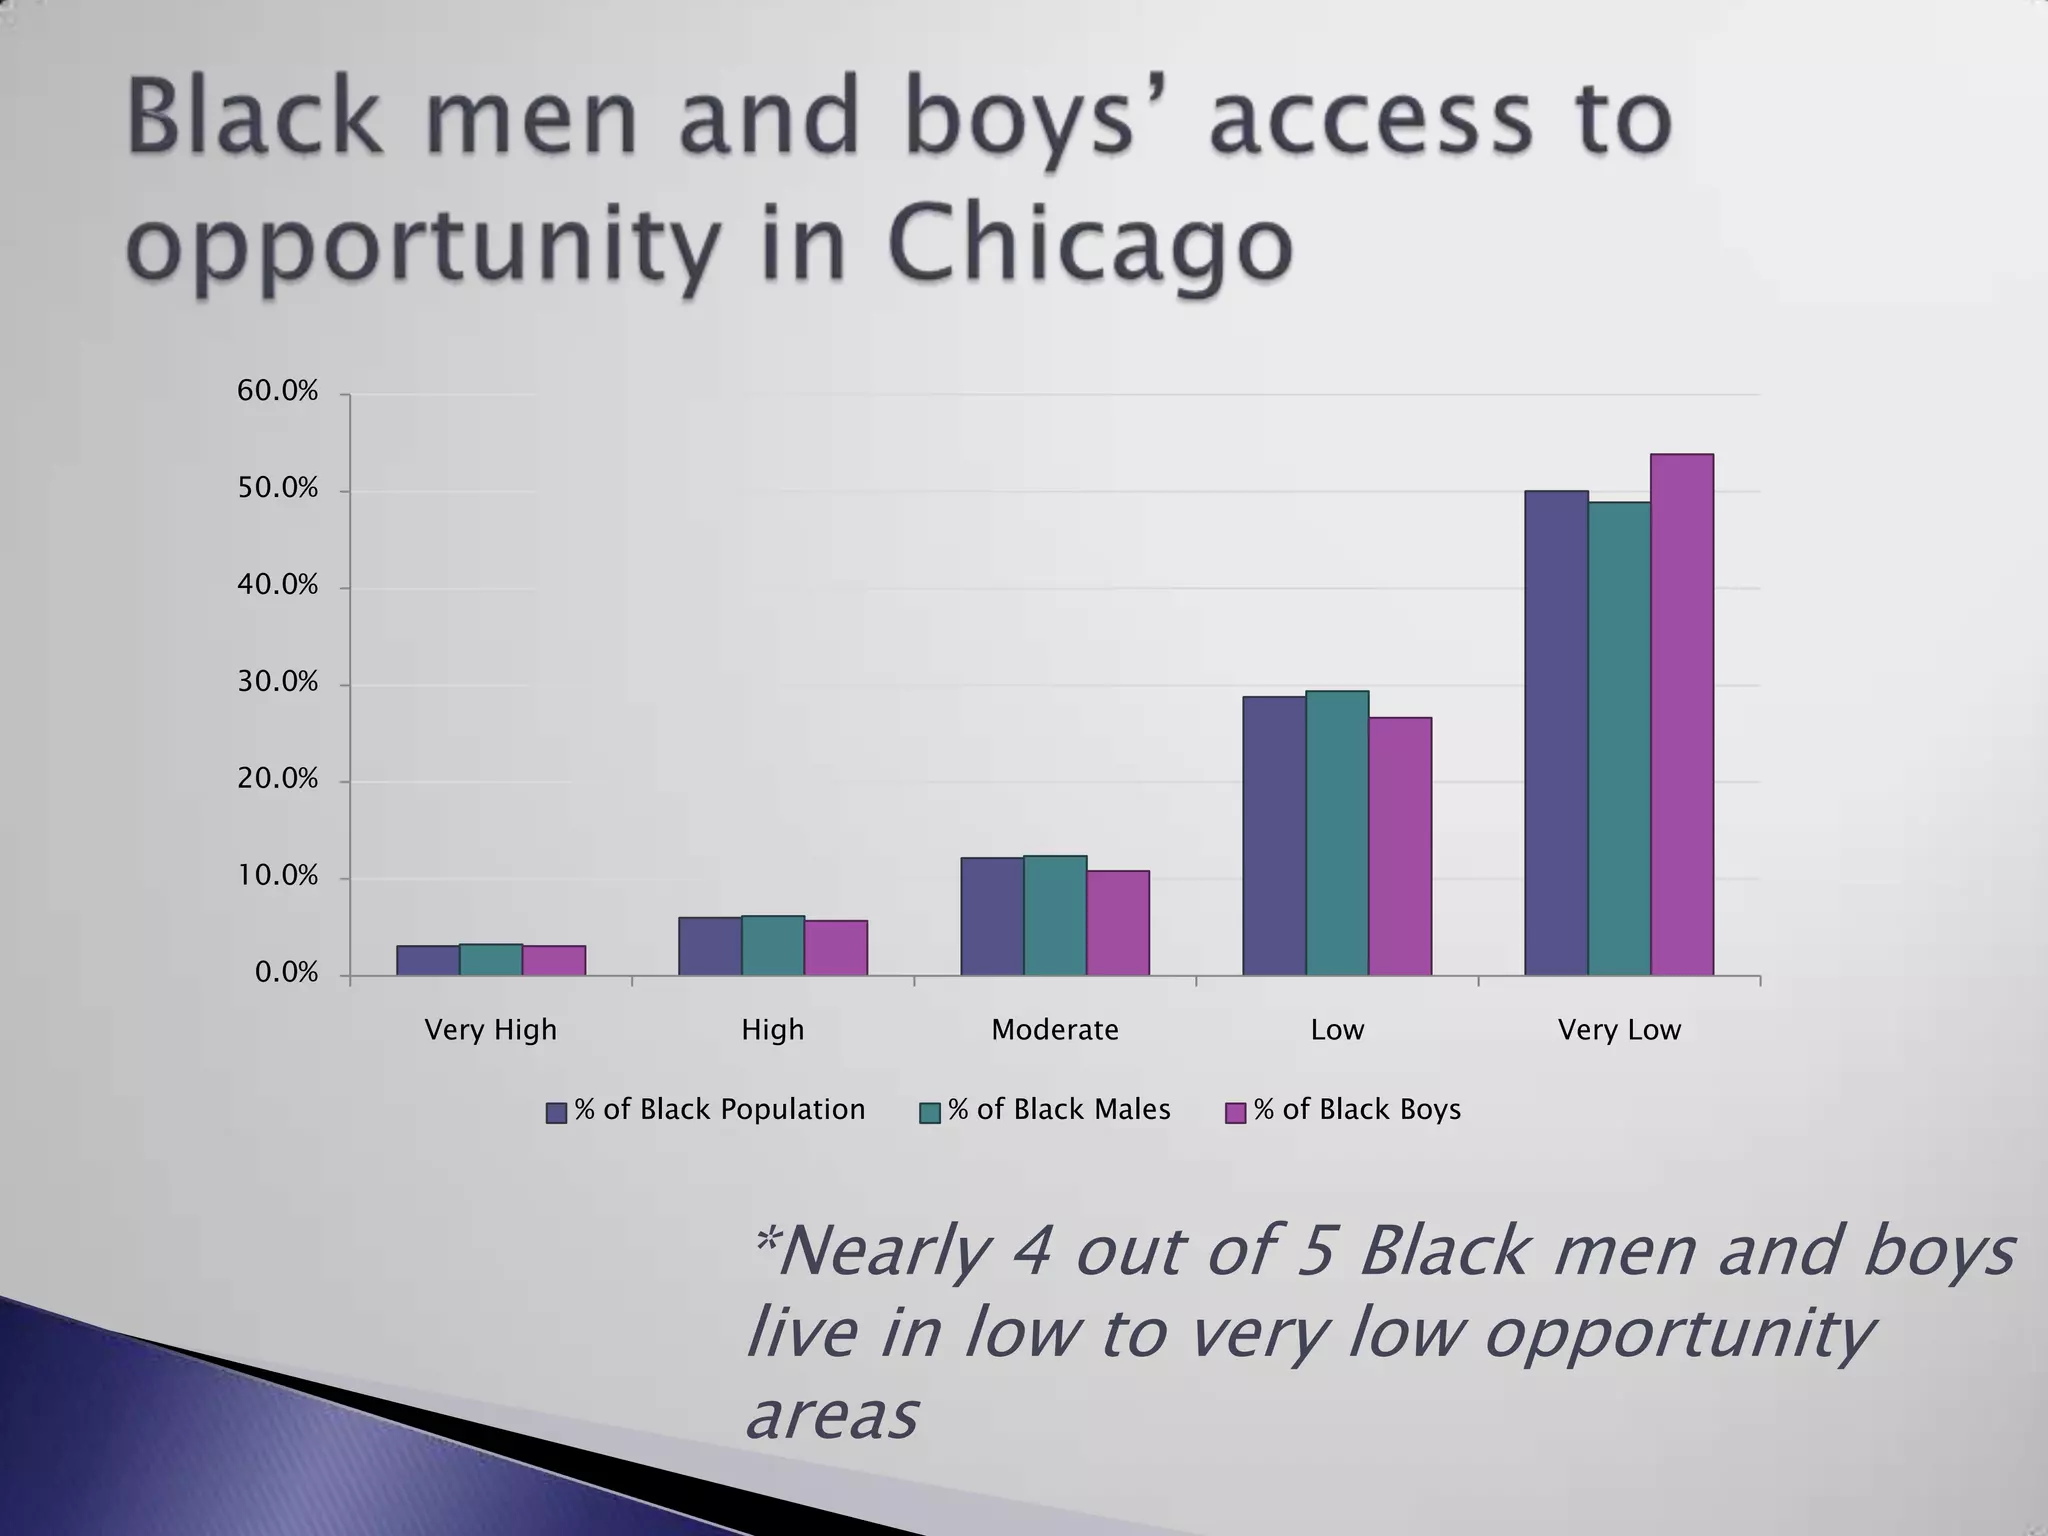
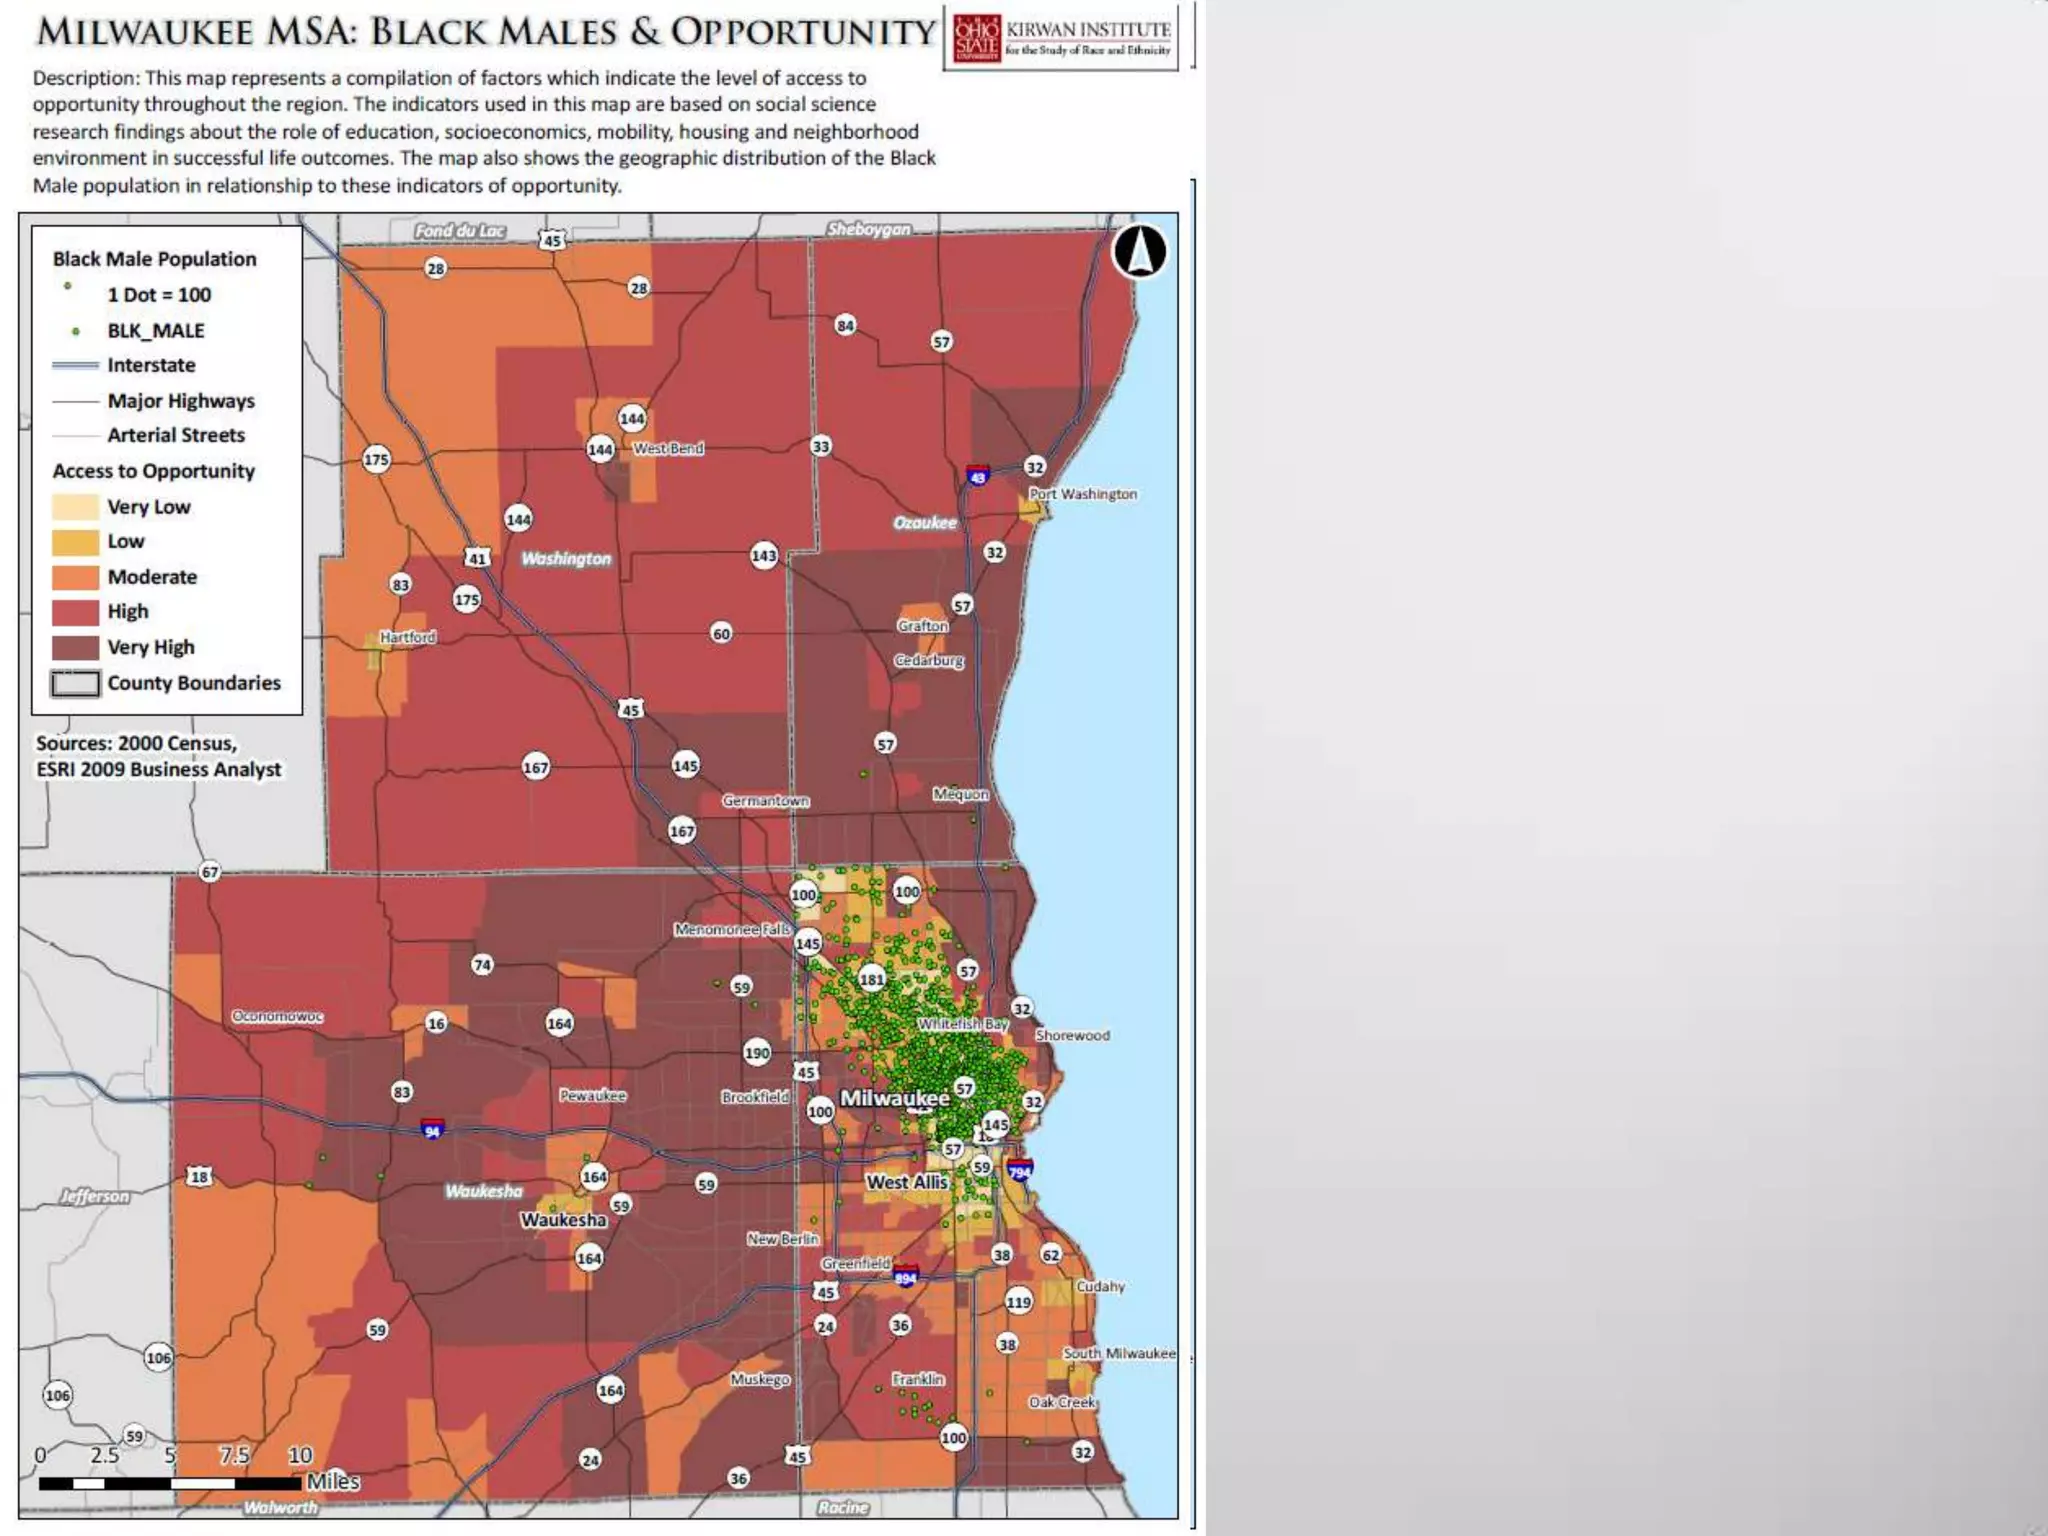
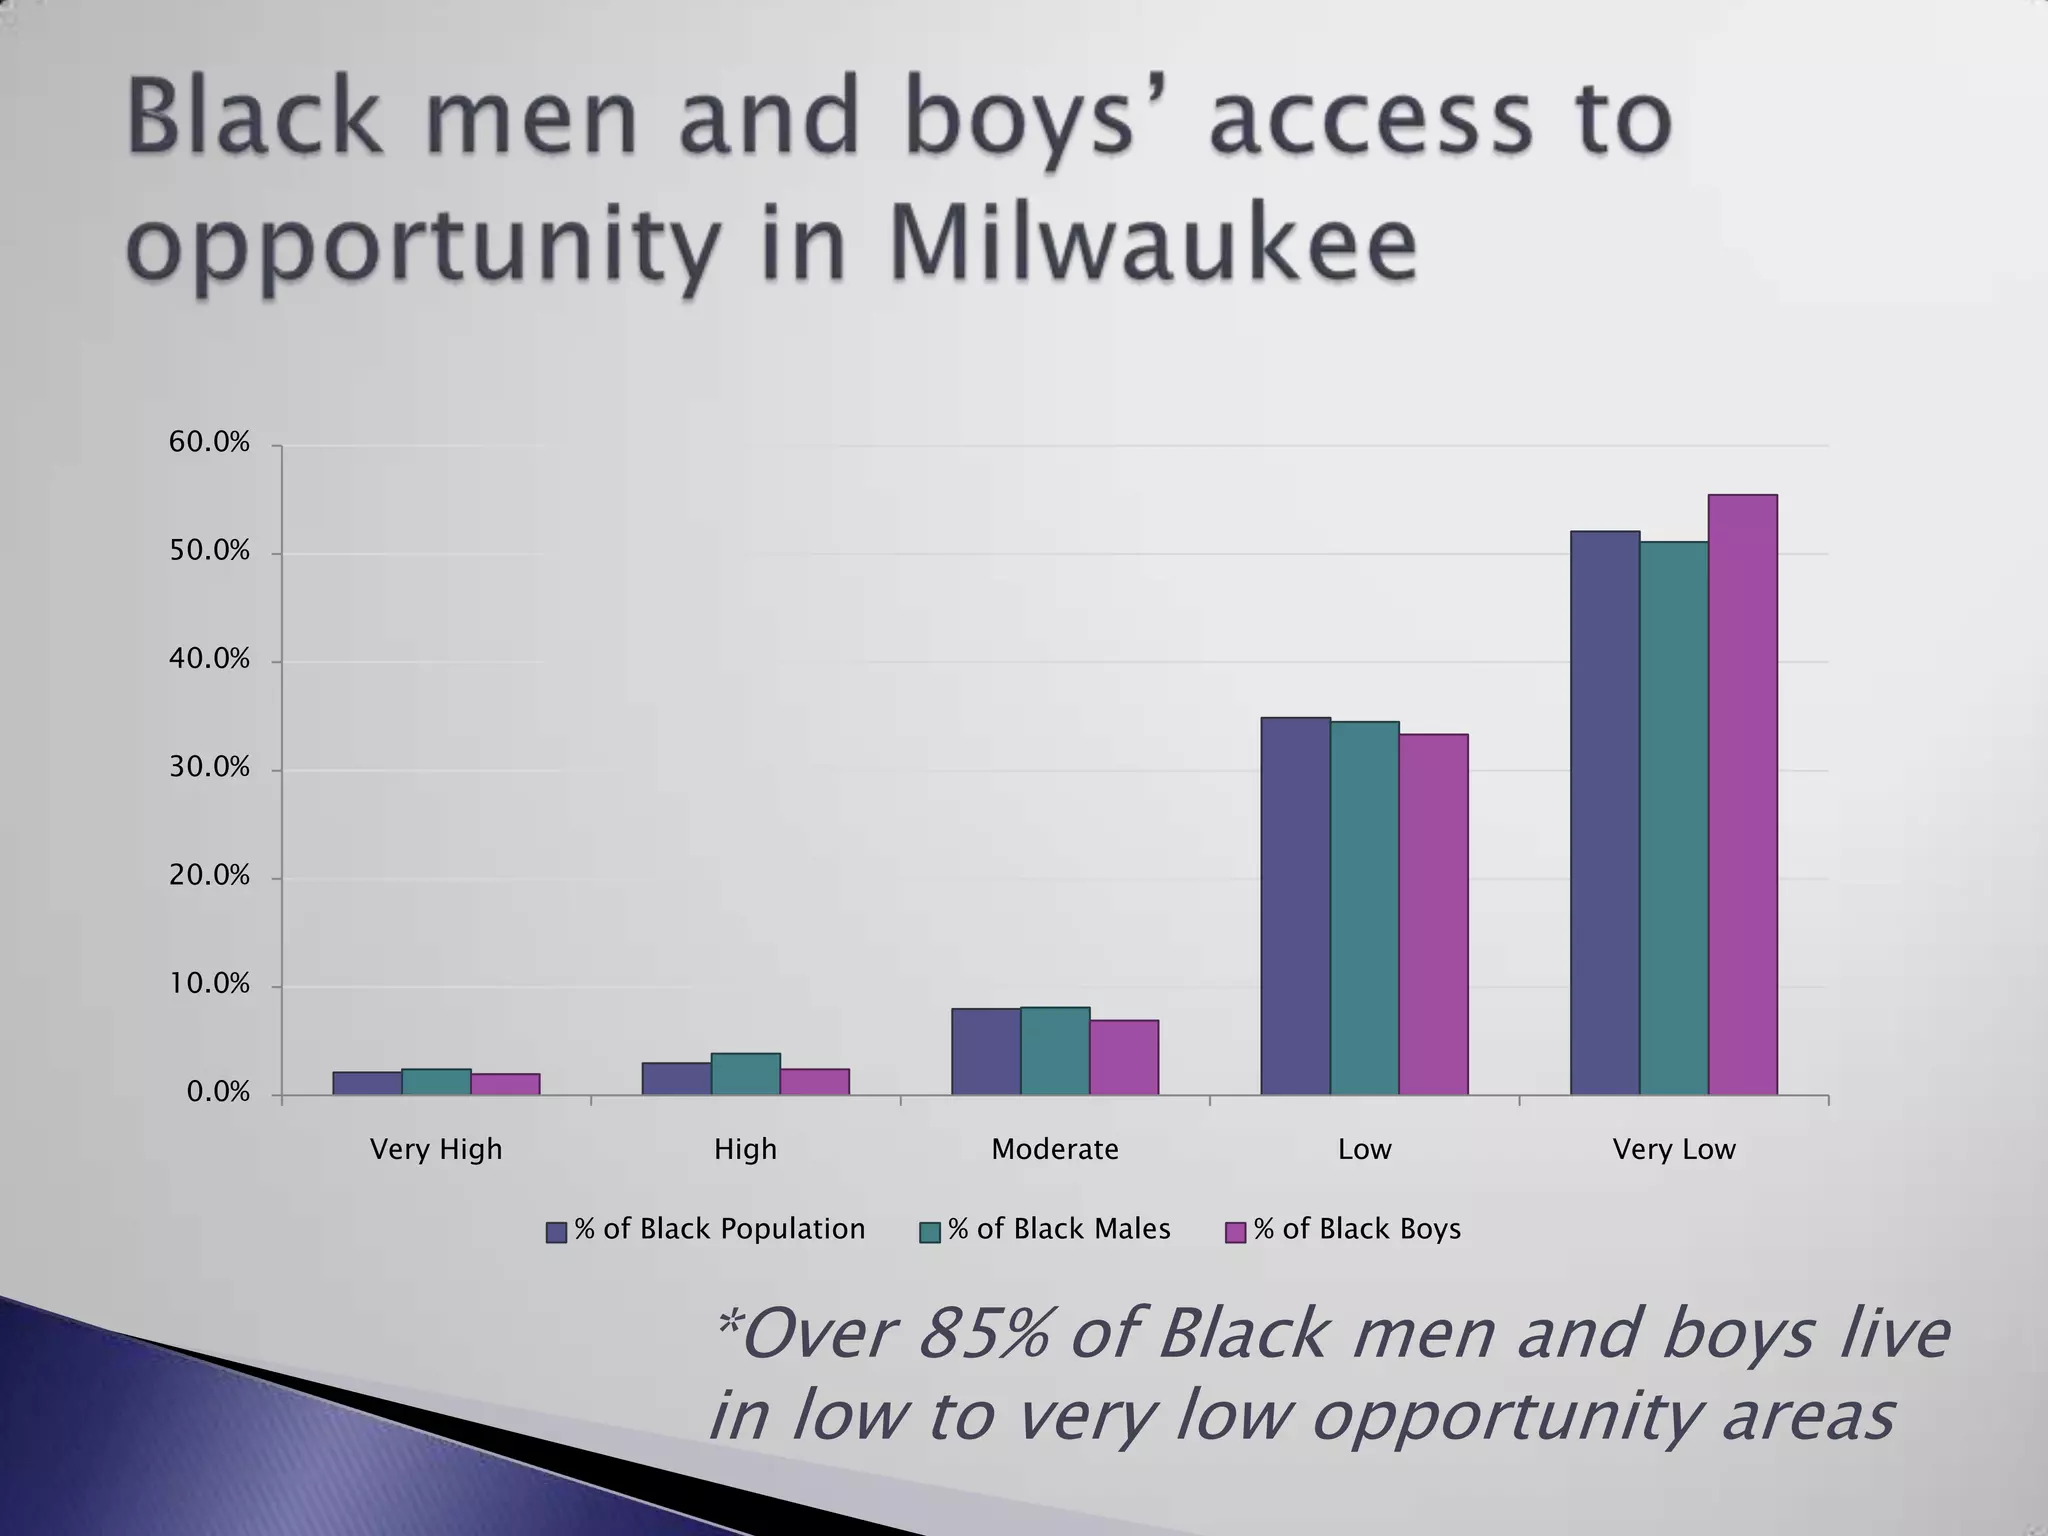
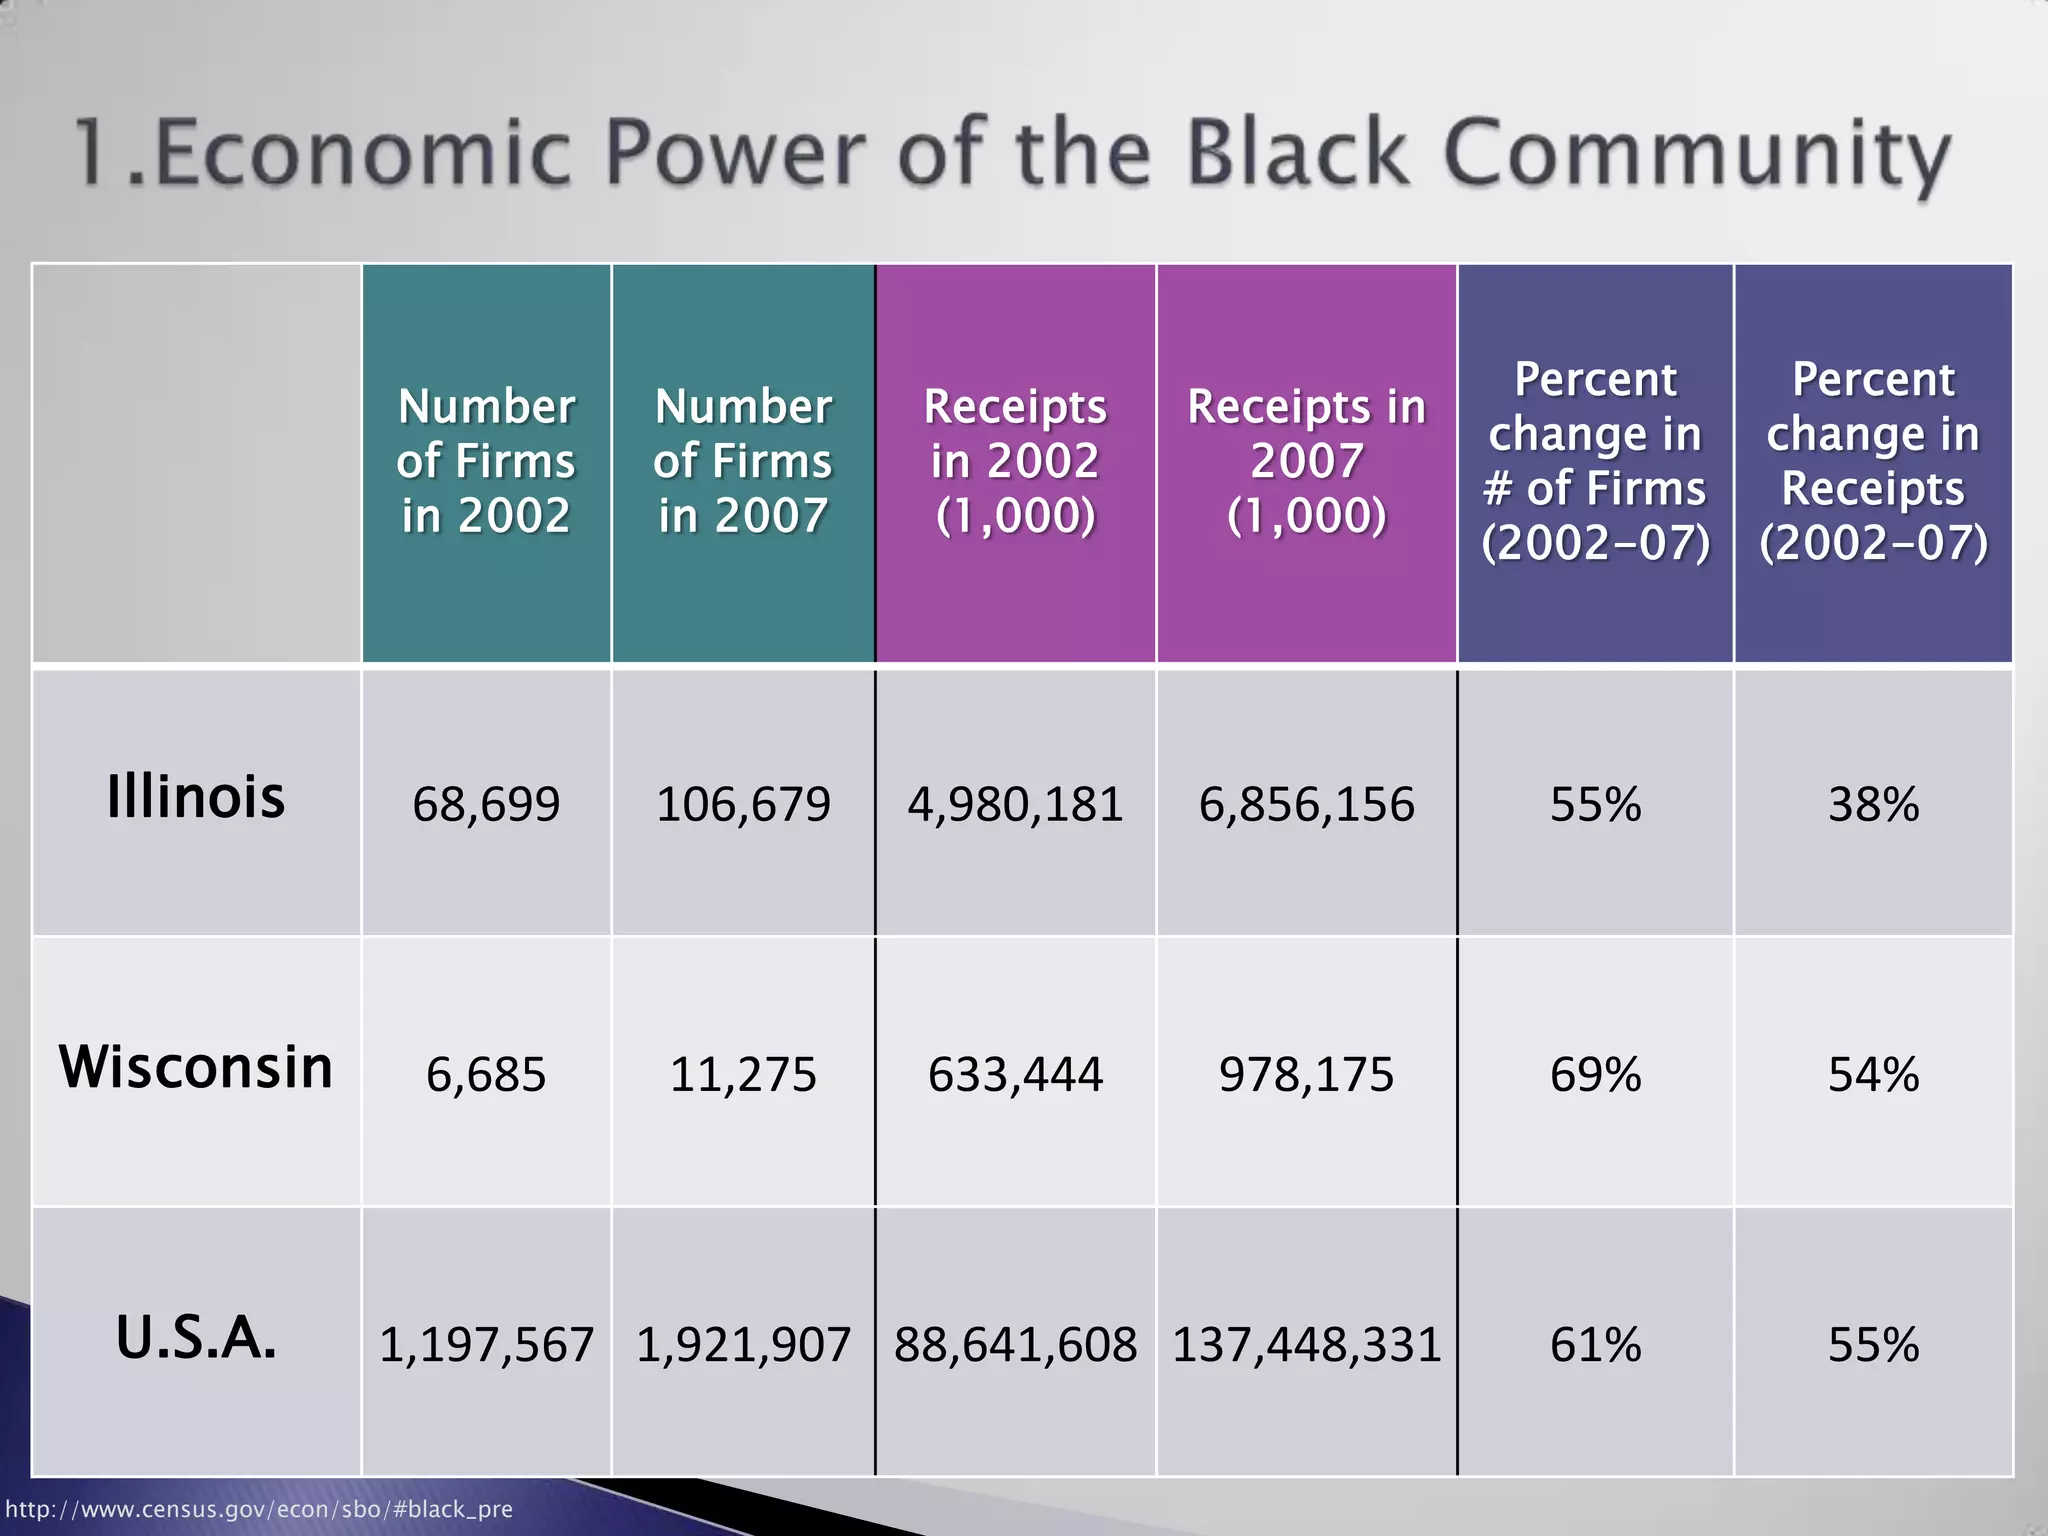
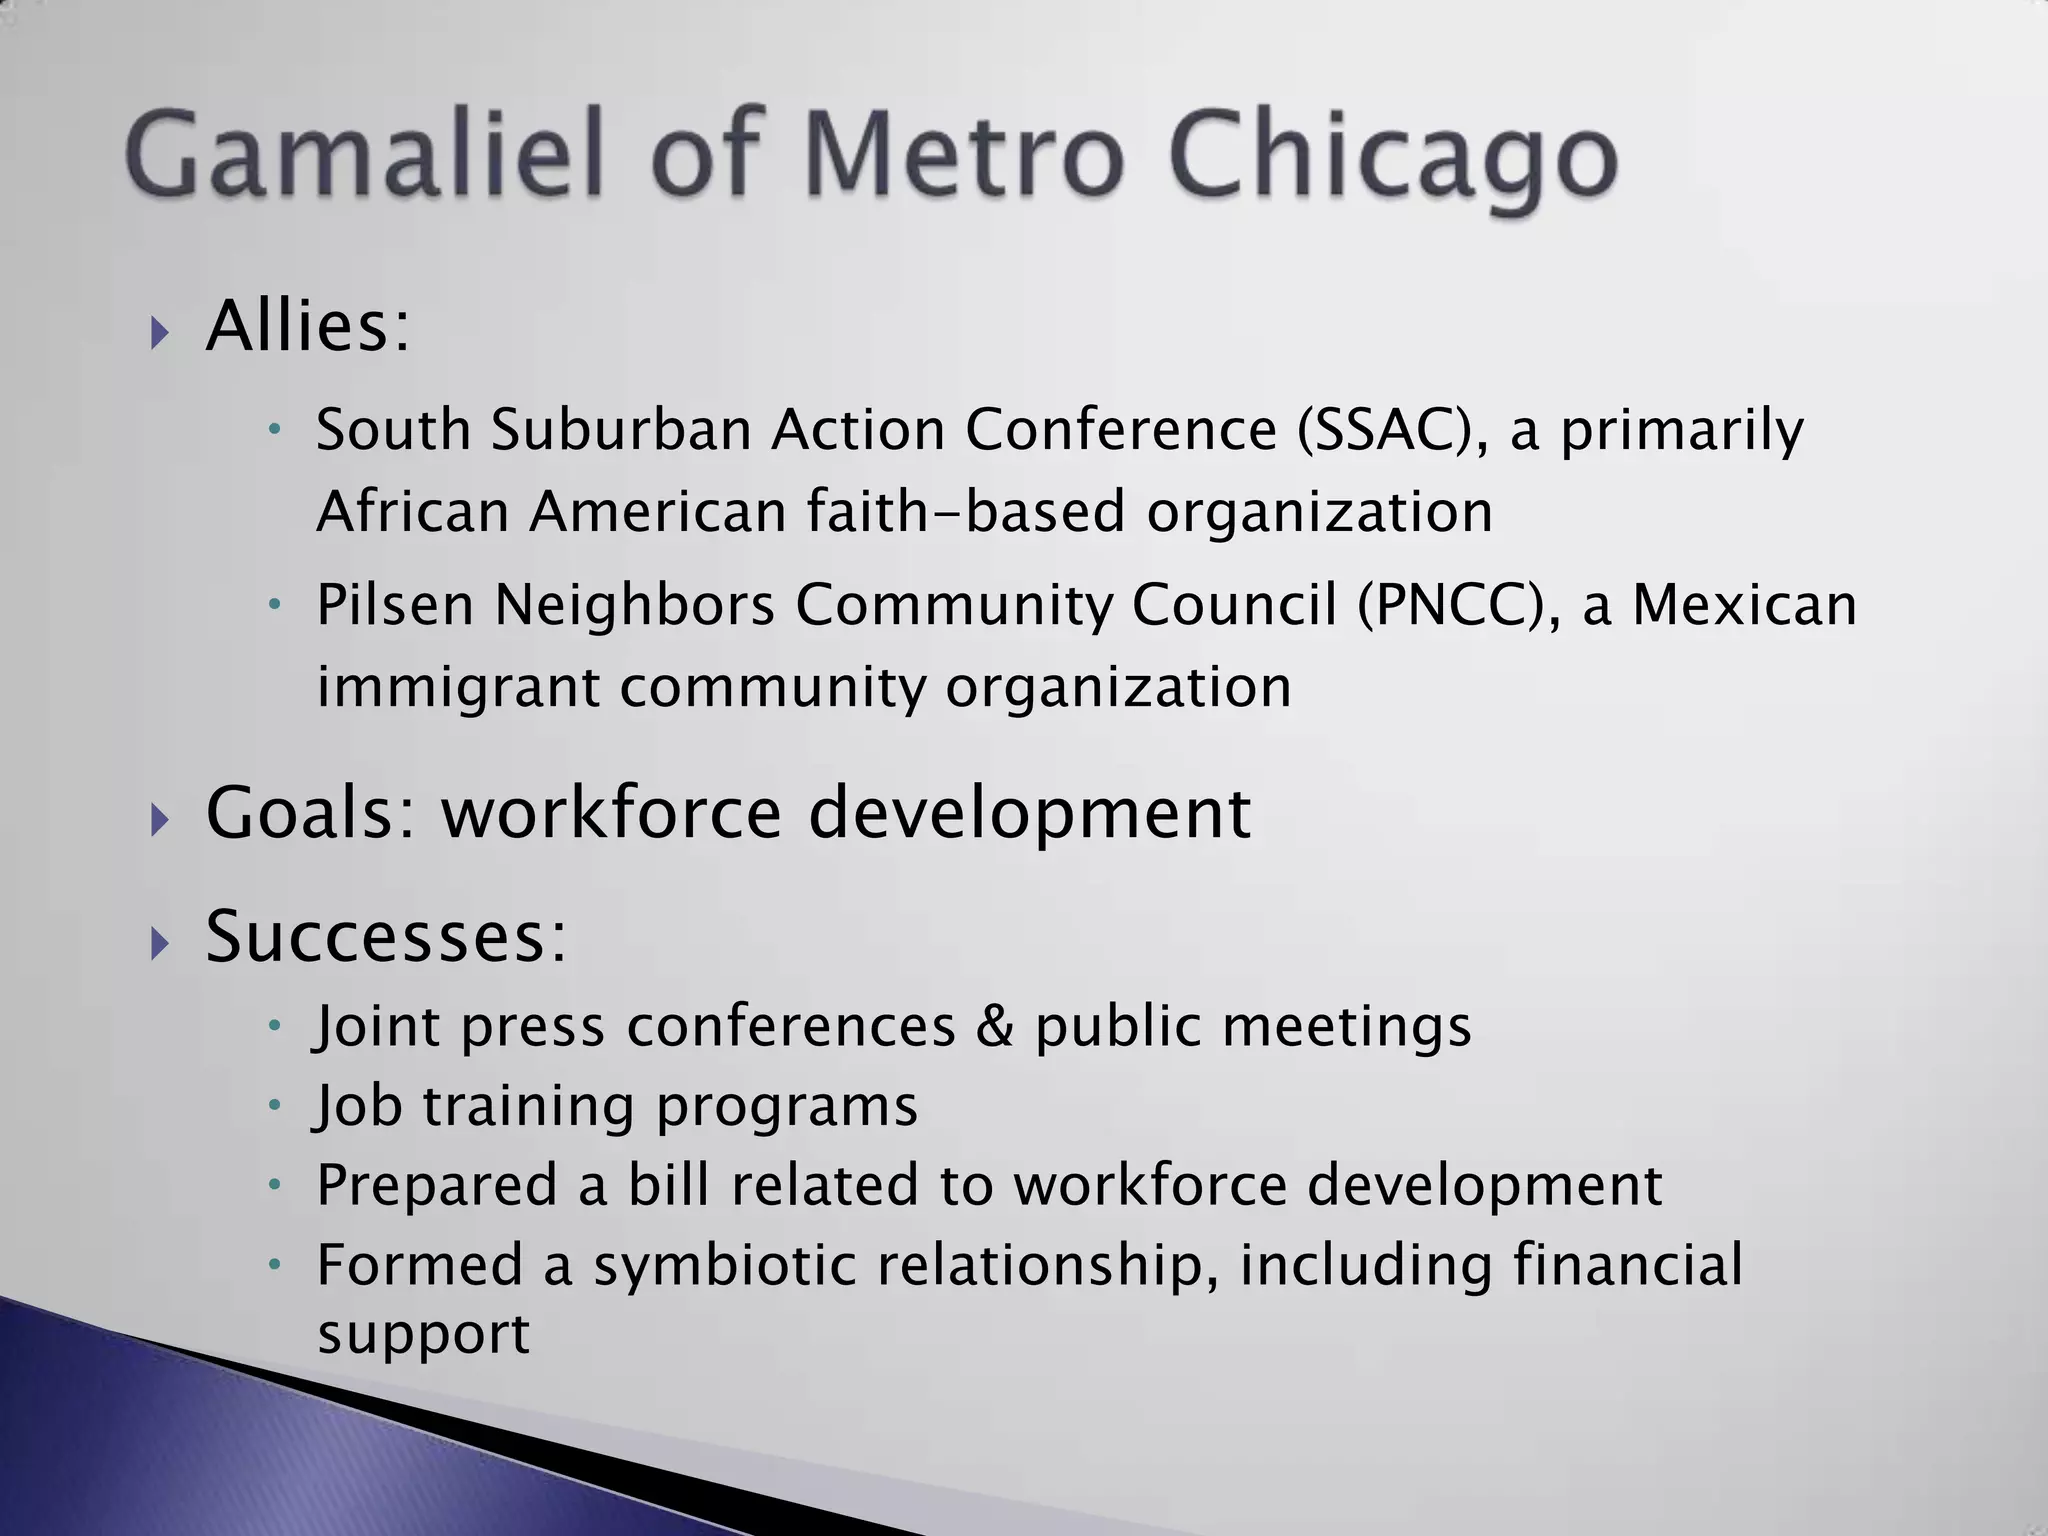
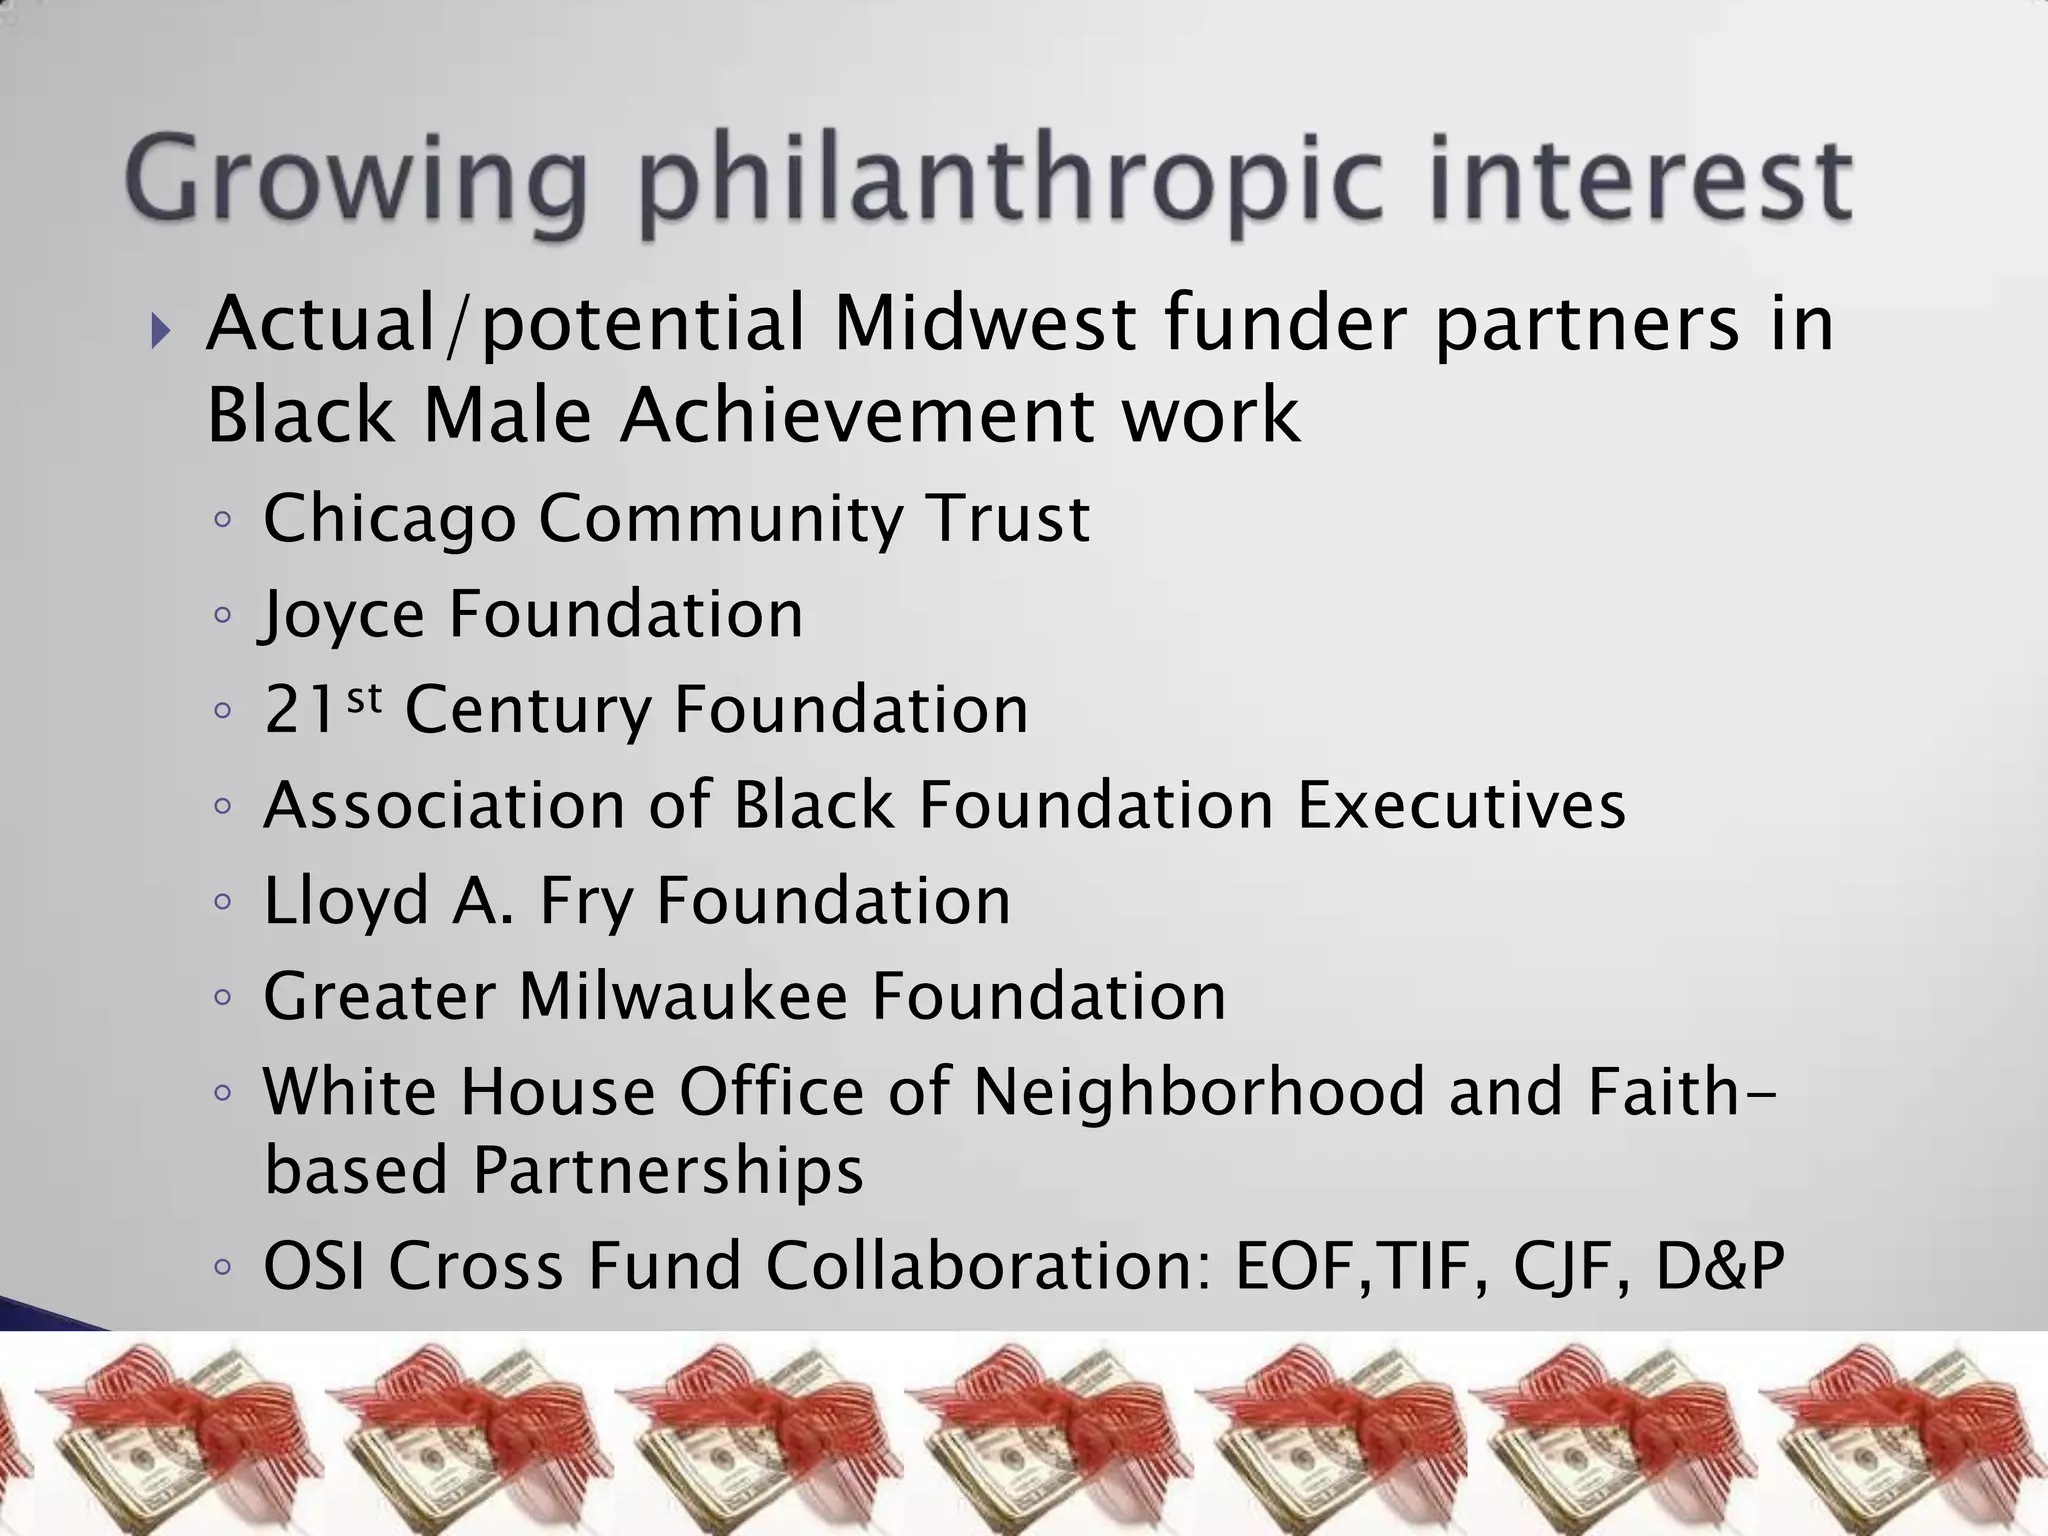
Black Male Achievement:Taking Stock, Moving ForwardAndrew Grant-ThomasDeputy Director, Kirwan Institute for the Study of Race and EthnicityBlack Male Achievement Campaign, Midwest Regional ConveningMilwaukee, WIDecember 1-2, 2010
A Demographic snapshotEconomics EducationFamilyLooking for explanations: A research reviewWhat the research saysSome critical gapsMoving forward: Identifying (some) community assets and strengthsOverview
I. A Demographic SnapshotTremendous progress AND tremendous vulnerability
Many signs of progress2002-2007: number of black-owned businesses grew by 61%1980-2009: percentage of black men earning at least $50k rose from 11% to 20% ($2009) 1970-2008: proportion of black males who are high school grads rose from 30% to 82%1990-2006: births to black teens drop from 23% to 17% of black birthsSource: Pew Research Center, http://pewresearch.org/pubs/1459/year-after-obama-election-black-public-opinion
“Blacks more upbeat” – the Obama factorThe OBAMA
Opportunity Mapping: Describing the geography of opportunity 6Why identify the “geography “of opportunity”?“Place” makes a differenceDifferent racial groups are differently situatedDifferences in opportunity are made, not bornWe can change the landscape of opportunityThe Kirwan Institute has drawn “opportunity maps” for many states & metro areas
Indicators of economic well-beingaccess to jobs unemployment job trendsIndicators of educational well-beingstudent poverty ratestest scoresstudent/teacher ratiosIndicators of neighborhood qualityvacant and abandoned properties crime ratesneighborhood poverty ratesMapping opportunity for Black males in 7 large metro areas
Black men and boys’ access to opportunity in Chicago*Nearly 4 out of 5 Black men and boys live in low to very low opportunity areas
Black men and boys’ access to opportunity in Milwaukee*Over 85% of Black men and boys live in low to very low opportunity areas
http://www4.uwm.edu/ced/publications/blackjoblessness_2010.pdf
Poverty trends (Chicago)
Poverty trends (Milwaukee)
Median earnings (Chicago)
Median earnings (Milwaukee)
High school graduation (Chicago)
High school graduation (Milwaukee)
Without college degree (Chicago)
Without college degree (Milwaukee)
Single-mom homes (Chicago)
Single-mom homes (Milwaukee)
3 in 4 black Americans say “more single women having children” is a bad thingPew Research Center. “The Decline of Marriage and Rise of New Families.” November 18, 2010 http://pewsocialtrends.org/2010/11/18/the-decline-of-marriage-and-rise-of-new-families/
II. Looking for explanations: A research reviewEconomic, Education, Family
Factors underlying economic hardshipEconomic restructuringResidential-jobs spatial mismatchLow educational attainmentSkills mismatchDiscriminationStigma of criminal recordsHigh out-of-wedlock birthsLow marriage rates
Factors underlying educational status Cultural incompetenceLowered teacher expectationsDiscrimination/student misclassificationPoor school funding and resourcesZero-tolerance policiesWeak supports for college persistencePoor college preparation
Factors underlying family instabilityLack of “marriageable” menMale/female status mismatchMale joblessness/underemploymentMass incarceration“Perverse welfare disincentives”Lower cultural premium on marriageNormalization of unwed parentingRacism and social stresses
“Ill effects of single-mom homes”Higher HS drop-out rates Lower rate 4-year college enrollment and graduation ratesGreater likelihood of children outside marriage Higher incarceration ratesAre these findings about single moms OR about the hard conditions under which they     	often must raise children?
Resiliency of many black males- vs. “deficits” Relationship instability-vs. “family pathology”Opportunity structures - vs. “culture” and individual behaviorsHidden bias and its effects – vs. explicit biasImpact of race-and-gender identityCross-issue/domain connections(Counterproductive) social policiesMore research attention needed
Moving ForwardIdentifying our assets and strengths
1.Economic Power of the Black Communityhttp://www.census.gov/econ/sbo/#black_pre
2. Political Power of the Black CommunityFrom 1970 to 2000 the number of elected Black officials in local, state, and federal government rose more than six-foldWisconsin was among the first states to grant its African American residents the right to vote, thanks to Milwaukee native Ezekiel Gillespie.As of Nov. 2010, 9 African Americans are considering running for Chicago mayor to replace Daley.The importance in gaining the Black vote has been recognized as critical to the success of political campaigns.
3. Coalition-building OpportunitiesCoalitions among Blacks and immigrant communities can:Enhance the impact and reach of an organizationAttract funding from public and private sourcesEnhance cultural understanding Ensure common concerns are heard by policymakers, elected officials, etcExamples:United Congress of Community and Religious Organizations (UCCRO)-  Chicago, IL Gamalielof Metro Chicago-  Chicago, IL
United Congress of Community and Religious Organizations (UCCRO)A grassroots multi-ethnic and multi-cultural human rights alliance founded in 200512 members, both individuals and organizations5 policy areas: health, education, employment, wealth building, and safetySuccesses:Racial justice report cards for IL state legislatorsCollaborated with the governor for youth summer job creationJustice training & human rights leadership boot camp for high school and college age young people
Gamaliel of Metro ChicagoAllies:South Suburban Action Conference (SSAC), a primarily African American faith-based organizationPilsen Neighbors Community Council (PNCC), a Mexican immigrant community organizationGoals: workforce developmentSuccesses:Joint press conferences & public meetingsJob training programsPrepared a bill related to workforce developmentFormed a symbiotic relationship, including financial support
Actual/potential Midwest funder partners in Black Male Achievement workChicago Community TrustJoyce Foundation21st Century FoundationAssociation of Black Foundation ExecutivesLloyd A. Fry FoundationGreater Milwaukee FoundationWhite House Office of Neighborhood and Faith-based PartnershipsOSI Cross Fund Collaboration: EOF,TIF, CJF, D&PGrowing philanthropic interest
For More Information Visit Us On-Line:www.KirwanInstitute.org

CBMA Midwest, Presentation by Andrew Grant-Thomas, Black Male Achievement: Taking Stock, Moving Forward, December 2, 2010

  • 1.
    Black Male Achievement:TakingStock, Moving ForwardAndrew Grant-ThomasDeputy Director, Kirwan Institute for the Study of Race and EthnicityBlack Male Achievement Campaign, Midwest Regional ConveningMilwaukee, WIDecember 1-2, 2010
  • 2.
    A Demographic snapshotEconomicsEducationFamilyLooking for explanations: A research reviewWhat the research saysSome critical gapsMoving forward: Identifying (some) community assets and strengthsOverview
  • 3.
    I. A DemographicSnapshotTremendous progress AND tremendous vulnerability
  • 4.
    Many signs ofprogress2002-2007: number of black-owned businesses grew by 61%1980-2009: percentage of black men earning at least $50k rose from 11% to 20% ($2009) 1970-2008: proportion of black males who are high school grads rose from 30% to 82%1990-2006: births to black teens drop from 23% to 17% of black birthsSource: Pew Research Center, http://pewresearch.org/pubs/1459/year-after-obama-election-black-public-opinion
  • 5.
    “Blacks more upbeat”– the Obama factorThe OBAMA
  • 6.
    Opportunity Mapping: Describingthe geography of opportunity 6Why identify the “geography “of opportunity”?“Place” makes a differenceDifferent racial groups are differently situatedDifferences in opportunity are made, not bornWe can change the landscape of opportunityThe Kirwan Institute has drawn “opportunity maps” for many states & metro areas
  • 7.
    Indicators of economicwell-beingaccess to jobs unemployment job trendsIndicators of educational well-beingstudent poverty ratestest scoresstudent/teacher ratiosIndicators of neighborhood qualityvacant and abandoned properties crime ratesneighborhood poverty ratesMapping opportunity for Black males in 7 large metro areas
  • 15.
    Black men andboys’ access to opportunity in Chicago*Nearly 4 out of 5 Black men and boys live in low to very low opportunity areas
  • 17.
    Black men andboys’ access to opportunity in Milwaukee*Over 85% of Black men and boys live in low to very low opportunity areas
  • 18.
  • 19.
  • 20.
  • 21.
  • 22.
  • 23.
  • 24.
  • 25.
  • 26.
  • 27.
  • 28.
  • 29.
    3 in 4black Americans say “more single women having children” is a bad thingPew Research Center. “The Decline of Marriage and Rise of New Families.” November 18, 2010 http://pewsocialtrends.org/2010/11/18/the-decline-of-marriage-and-rise-of-new-families/
  • 30.
    II. Looking forexplanations: A research reviewEconomic, Education, Family
  • 31.
    Factors underlying economichardshipEconomic restructuringResidential-jobs spatial mismatchLow educational attainmentSkills mismatchDiscriminationStigma of criminal recordsHigh out-of-wedlock birthsLow marriage rates
  • 32.
    Factors underlying educationalstatus Cultural incompetenceLowered teacher expectationsDiscrimination/student misclassificationPoor school funding and resourcesZero-tolerance policiesWeak supports for college persistencePoor college preparation
  • 33.
    Factors underlying familyinstabilityLack of “marriageable” menMale/female status mismatchMale joblessness/underemploymentMass incarceration“Perverse welfare disincentives”Lower cultural premium on marriageNormalization of unwed parentingRacism and social stresses
  • 34.
    “Ill effects ofsingle-mom homes”Higher HS drop-out rates Lower rate 4-year college enrollment and graduation ratesGreater likelihood of children outside marriage Higher incarceration ratesAre these findings about single moms OR about the hard conditions under which they often must raise children?
  • 35.
    Resiliency of manyblack males- vs. “deficits” Relationship instability-vs. “family pathology”Opportunity structures - vs. “culture” and individual behaviorsHidden bias and its effects – vs. explicit biasImpact of race-and-gender identityCross-issue/domain connections(Counterproductive) social policiesMore research attention needed
  • 36.
    Moving ForwardIdentifying ourassets and strengths
  • 37.
    1.Economic Power ofthe Black Communityhttp://www.census.gov/econ/sbo/#black_pre
  • 38.
    2. Political Powerof the Black CommunityFrom 1970 to 2000 the number of elected Black officials in local, state, and federal government rose more than six-foldWisconsin was among the first states to grant its African American residents the right to vote, thanks to Milwaukee native Ezekiel Gillespie.As of Nov. 2010, 9 African Americans are considering running for Chicago mayor to replace Daley.The importance in gaining the Black vote has been recognized as critical to the success of political campaigns.
  • 39.
    3. Coalition-building OpportunitiesCoalitionsamong Blacks and immigrant communities can:Enhance the impact and reach of an organizationAttract funding from public and private sourcesEnhance cultural understanding Ensure common concerns are heard by policymakers, elected officials, etcExamples:United Congress of Community and Religious Organizations (UCCRO)- Chicago, IL Gamalielof Metro Chicago- Chicago, IL
  • 40.
    United Congress ofCommunity and Religious Organizations (UCCRO)A grassroots multi-ethnic and multi-cultural human rights alliance founded in 200512 members, both individuals and organizations5 policy areas: health, education, employment, wealth building, and safetySuccesses:Racial justice report cards for IL state legislatorsCollaborated with the governor for youth summer job creationJustice training & human rights leadership boot camp for high school and college age young people
  • 41.
    Gamaliel of MetroChicagoAllies:South Suburban Action Conference (SSAC), a primarily African American faith-based organizationPilsen Neighbors Community Council (PNCC), a Mexican immigrant community organizationGoals: workforce developmentSuccesses:Joint press conferences & public meetingsJob training programsPrepared a bill related to workforce developmentFormed a symbiotic relationship, including financial support
  • 42.
    Actual/potential Midwest funderpartners in Black Male Achievement workChicago Community TrustJoyce Foundation21st Century FoundationAssociation of Black Foundation ExecutivesLloyd A. Fry FoundationGreater Milwaukee FoundationWhite House Office of Neighborhood and Faith-based PartnershipsOSI Cross Fund Collaboration: EOF,TIF, CJF, D&PGrowing philanthropic interest
  • 43.
    For More InformationVisit Us On-Line:www.KirwanInstitute.org

Editor's Notes

  • #5 Education: scores as measured by the main NAEP assessments of the National Assessment of Educational Progress (NAEP)Charts were released January 2010, one year after election
  • #17 Percentage of population on Public AssistanceMean Commute TimeIndicators of educational well-beingAdult Education AttainmentIndicators of housing neighborhood qualityHomeownership rateResidential vacancy rateNeighborhood poverty rates
  • #20 77 percent of black children experience poverty at some point in their childhood, with 37 percent of them being persistently poor.Impoverished black boys are less likely to work as young adults. While males born poor are more likely to be consistently employed as young adults, black males born poor are 33 percent less likely to have consistent employment.The percentage of Black males in Chicago that live at or below the poverty level is significantly higher than the total Chicago population, reaching its biggest difference in 1990 at 18.4% and remaining at 12.2% in 2008. Since 1980, Chicago’s Black male poverty rate has been very similar to the national Black male poverty rate, although it’s been slightly higher since 2005. The poverty rates for all populations have stabilized since 2000, but this likely has changed due to the current recession.
  • #21 The percentage of Milwaukee’s Black male population living in poverty is a much higher rate than the total Milwaukee population. Curiously, in 1990 the poverty rate of Milwaukee’s Black males spiked at 41.3%, rising and then falling over 12%. This is not a trend seen in the national Black male population; in fact, the Black male population in Milwaukee has a much higher poverty rate than the national Black male population consistently since 1990.
  • #22 In the 2006-2008 Community Survey, the median individual earnings for Black men in Chicago was 89% of the median individual earnings for the total Chicago population but was 10% more than the national median individual earnings for Black males. The median earnings for Black males in Chicago remained relatively stagnant, as did the total median individual earnings for Chicago, while the national Black male median individual earnings decreased.
  • #23 The median earnings for Black males in Milwaukee is significantly lower than the national median earnings for Black males, and was only 69% of what the total Milwaukee population median earnings in the 2006-2008 Community Survey. All three groups saw a decline in median individual earnings in the 2006-2008 Community Survey.
  • #24 Today more than two-thirds of African American male dropouts are expected to serve time in state or federal prison.Disparities exist between the high school graduation rates of Black males and White males, both nationally and locally. While White males in Chicago graduate at a rate 15% lower than the national White Male population, the national and local graduation rates for Black males is relatively similar. Nonetheless, the graduation rate for Black males in Chicago is 19% less than the percentage for White males in Chicago.
  • #25 Today more than two-thirds of African American male dropouts are expected to serve time in state or federal prison.Black male students are graduating at a lower rate than White male students, both nationally and locally. According to the Schott Foundation’s 50 State Report on Public Education and Black Males, the high school graduation rates for both White and Black male students in Milwaukee are less than the national average. The graduation rate for Black males in Milwaukee is 7% less than the national percentage for Black males, and 14% less than the percentage for White males in Milwaukee.
  • #26 There is a substantial difference between the percentages of Black men in Chicago that do have a college degree and the total Chicago population. In the 2006-2008 Community Survey, 16.1% more of the Black male population did not have a college degree than the percentage of the total Chicago population. However, the percentage of Black males in Chicago that have a college degree is higher than the percentage of Black males nationally. The increase in all groups can possibly be contributed to the fact that the 2006-2008 Community Survey considered having an Associate degree as not having a college degree.
  • #27 There is a substantial difference between the percentages of Black men in Milwaukee that have a college degree compared to the total Milwaukee population. In the 2006-2008 Community Survey, 20.2% more of the Black male population did not have a college degree than the total Milwaukee population. The percentage of Black males that do not have a college degree is also higher than the national Black male population. The increase in all groups can possibly be contributed to the fact that the 2006-2008 Community Survey considered having an Associate degree as not having a college degree.
  • #28 The percentage of female-headed households has increased in all populations from 1970 to 2008, but has begun to stabilize in recent years. The percentage of Black single-female headed families in Chicago increased 27.6% from 1970 to 2008 but has not changed significantly since 1990, while the overall percentage of female-headed households in Chicago increased only 8% from 1970 to 2008. Not only was the increase in Chicago’s Black population more severe, but the percentage of Black single-mother families in Chicago is also substantially higher than the total Chicago population; at its height in 1990 the disparity was 28.8% and continued at 30.9% in 2008. The percentage of Black female-headed households in Chicago follows the national trend, but has been 4-5% higher in recent years.
  • #29 The percentage of female-headed households has increased in all populations from 1970 to 2008, but has begun to stabilize in recent years. The percentage of Black single-female headed families in Milwaukee increased 8.1% from 1980 to 2008 but has not changed significantly since 1990, while the overall percentage of female-headed households in Milwaukee increased 5.7% from 1980 to 2008. The three populations follow a similar trend, but the percentage of Black single-mother families in Milwaukee is substantially higher than the total Milwaukee population; at its height in 1990 the disparity was 40% and continued at 37.5% in 2008. Furthermore, the percentage of Black female-headed households in Milwaukee has been significantly higher than the national Black percentage (12% higher in 2008).
  • #32 Restructuring:globalized economy marginalizes Black males faster and more harshly than any other demographic group. Spatial Mismatch: as decentralization has increased, unemployment for Black and Latino males is more frequent and for longer periods of time, than for white malesSkills Mismatch: reflecting the shift from manufacturing to a service- and knowledge-based economy. Rapid deindustrialization, especially in Midwest, has been most impactful for young, Black, less- educated men.Employer Discrimination: a field experiment by Bertrand & Mullainathan found, among other things, that having an African-American sounding name on your resume reduced the likelihood that you’ll be called for an interview.
  • #33 Teacher Misperceptions: Perceptions of “good behavior”: Implicit bias and media portrayals of Black males; Leads to higher disciplinary/expulsion ratesStudent Misclassifications: Special Ed: African American males are twice as likely to be classified as Special Needs as are White male students, despite research that shows the percentages of students from all racial groups are approximately the same at each intelligence level AP: Conversely, white males are twice as likely as Black male students to be placed in AP classesZero-tolerance: The fact that African American males are more likely to be punished for perceived disruptive behavior means such a policy has a disproportionate impact on African American male students, leading to more suspensions and expulsions and thus contributing to a growing disparity in educational attainment.
  • #35 Research does not/cannot distinguish between Black single-mother households as a cause or effecti.e. single motherhood per se is not inherently harmful. Circumstance matters!Consider this: popular opinion of Jennifer Aniston deciding to be a single mother, versus popular opinion surrounding single Black mothers
  • #36 Education research has little to say about the out-of-school factors that influence educational outcomes (i.e. neighborhood effects)Education policy is Housing PolicyPoints of Discretion:Police officerProsecutorJudgeProbation officerFathers typically enter prison with a $10,000 child support debt andleave owing $20,000 or more.
  • #38 Figures:from $318 billion in 1990, to $590 billion in 2000, to $910 billion in 2009, with buying power projected to be $1.1 trillion in 2014. Note: Black spending power at $918 billion, but Black owned businesses only account for about $100 billion in annual sales, so only capturing about 10% of Black buying power.
  • #39 According to a Nov. 1, 2010 article on The Root, the 9 African Americans who are considering running for mayor of Chicago are: U.S. Rep. Danny K. Davis, U.S. Sen. Roland W. Burris, State Sen. Rickey R. Hendon, former U.S. Sen. Carol Moseley Braun, State Rep. Annazette Collins, Urban Prep Academy founder Tim King, William Walls, State Sen. James T. Meeks and Board of Review Commissioner Larry R. Rogers. (http://www.theroot.com/views/chicago-power)Article on Ezekiel Gillespie: http://www.expressmilwaukee.com/article-9736-ezekiel-gillespie-milwaukeerss-champion-of-african-american-voting-rights.html