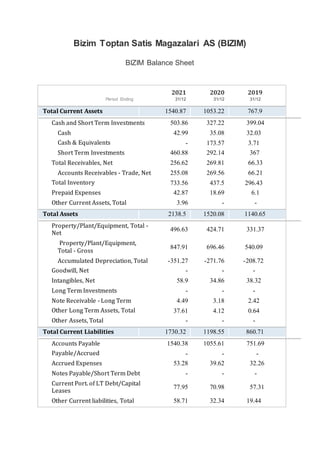
Bizim Toptan Satis Magazalari AS (BIZIM) is a Turkish company that engages in wholesale trade. According to its financial statements for the periods ending December 31, 2021, 2020, and 2019:
- Total assets increased from TRY 1,140.65 million in 2019 to TRY 2,138.5 million in 2021, with current assets growing from TRY 767.9 million to TRY 1,540.87 million over the same period.
- Total revenue grew from TRY 4,520.67 million in 2019 to TRY 7,173.14 million in 2021, while net income increased from TRY 33.08 million to TRY 82
The key fact to grasp is that the cost of capital associated with an investment depends on the risk of that investment.
Thus, the cost of capital for a risk-free investment is the risk-free rate.
The cost of capital for a risky project, is greater than the risk-free rate, and the appropriate discount rate would exceed the risk-free rate.
We will henceforth use the terms required return, appropriate discount rate , and cost of capital more or less interchangeably because they all mean essentially the same thing.
It is a common error to forget this crucial point and fall into the trap of thinking that the cost of capital for an investment depends primarily on how and where the capital is raised.
Ipotesi di massimizzazione del valore di mercato di un’azienda quotata: i managers scelgono le opzioni di investimento e finanziamento che ritengono massimizzino il valore di mercato dell’azienda
Il valore di un’azienda è pari al valore scontato degli utili attesi futuri generati dagli assets posseduti, più il valore presente netto delle nuove opportunità di investimento che coinvolgano nuove spese in conto capitale
Per opportunità d’investimento si intende investire in progetti che hanno un rendimento maggiore a quello del mercato VPN positivo
Se una azienda ha progetti con VPN positivo e annuncia nuove spese in conto capitale (CAPEX) è molto probabile che accresca il suo valore di mercato
Broadening Your Perspective 91 The financial statements of Tootsie.pdfajayelectronisyavatm
Broadening Your Perspective 91
The financial statements of Tootsie Roll are presented below.
TOOTSIE ROLL INDUSTRIES, INC. AND SUBSIDIARIES
CONSOLIDATED STATEMENTS OF
Earnings, Comprehensive Earnings and Retained Earnings (in thousands except per share data)
For the year ended December 31,
2011 2010 2009
Net product sales $528,369 $517,149 $495,592
Rental and royalty revenue 4,136 4,299 3,739
Total revenue 532,505 521,448 499,331
Product cost of goods sold 365,225 349,334 319,775
Rental and royalty cost 1,038 1,088 852
Total costs 366,263 350,422 320,627
Product gross margin 163,144 167,815 175,817
Rental and royalty gross margin 3,098 3,211 2,887
Total gross margin 166,242 171,026 178,704
Selling, marketing and administrative expenses 108,276 106,316 103,755
Impairment charges — — 14,000
Earnings from operations 57,966 64,710 60,949
Other income (expense), net 2,946 8,358 2,100
Earnings before income taxes 60,912 73,068 63,049
Provision for income taxes 16,974 20,005 9,892
Net earnings $43,938 $53,063 $53,157
Other comprehensive earnings (loss) (8,740) 1,183 2,845
Comprehensive earnings $35,198 $54,246 $56,002
Retained earnings at beginning of year. $135,866 $147,687 $144,949
Net earnings 43,938 53,063 53,157
Cash dividends (18,360) (18,078) (17,790)
Stock dividends (47,175) (46,806) (32,629)
Retained earnings at end of year $114,269 $135,866 $147,687
Earnings per share $0.76 $0.90 $0.89
Average Common and Class B Common shares outstanding 57,892 58,685 59,425
(The accompanying notes are an integral part of these statements.)
CONSOLIDATED STATEMENTS OF
Financial Position
TOOTSIE ROLL INDUSTRIES, INC. AND SUBSIDIARIES (in thousands except per share
data)
Assets December 31,
2011 2010
CURRENT ASSETS:
Cash and cash equivalents $78,612 $115,976
Investments 10,895 7,996
Accounts receivable trade, less allowances of $1,731 and $1,531 41,895 37,394
Other receivables 3,391 9,961
Inventories:
Finished goods and workinprocess
42,676 35,416
Raw materials and supplies 29,084 21,236
Prepaid expenses 5,070 6,499
Deferred income taxes 578 689
Total current assets 212,201 235,167
PROPERTY, PLANT AND EQUIPMENT, at cost:
Land 21,939 21,696
Buildings 107,567 102,934
Machinery and equipment 322,993 307,178
Construction in progress 2,598 9,243
455,097 440,974
Less—Accumulated depreciation 242,935 225,482
Net property, plant and equipment 212,162 215,492
OTHER ASSETS:
Goodwill 73,237 73,237
Trademarks 175,024 175,024
Investments 96,161 64,461
Split dollar officer life insurance 74,209 74,441
Prepaid expenses 3,212 6,680
Equity method investment 3,935 4,254
Deferred income taxes 7,715 9,203
Total other assets 433,493 407,300
Total assets $857,856 $857,959
Liabilities and Shareholders’ Equity December 31,
2011 2010
CURRENT LIABILITIES:
Accounts payable $10,683 $9,791
Dividends payable 4,603 4,529
Accrued liabilities 43,069 44,185
Total current liabilities 58,355 58,505
NONCURRENT LIABILITES:
Deferred income taxes 43,521 47,865
P.
The Fiancial model of Nestle India Ltd Include:
- Income Statement, Balance sheet, Cash Flow Statement
- Ratio Analysis
- Scenerio Analysis
- WACC calculation
- Discounted Cash Flow Model
- Financial Dashboard etc,
**Disclaimer: This financial model only for education purpose not for any investment/trade recommendation.
please due your own due diligence before investment/trade in financial market.
Broadening Your Perspective 10-1httpedugen.wiley.comed.docxhartrobert670
Broadening Your Perspective 10-1
http://edugen.wiley.com/edugen/shared/assignment/test/qprint.uni[10/21/2015 2:28:27 PM]
Print by: TAMI BLACKWELL
ACC/291 - 49446137 / Assignment: Week 3 Assignment
Broadening Your Perspective 10-1
The financial statements of Tootsie Roll are presented below.
TOOTSIE ROLL INDUSTRIES, INC. AND SUBSIDIARIES
CONSOLIDATED STATEMENTS OF
Earnings, Comprehensive Earnings and Retained Earnings (in thousands except per share data)
For the year ended December 31,
2011 2010 2009
Net product sales $528,369 $517,149 $495,592
Rental and royalty revenue 4,136 4,299 3,739
Total revenue 532,505 521,448 499,331
Product cost of goods sold 365,225 349,334 319,775
Rental and royalty cost 1,038 1,088 852
Total costs 366,263 350,422 320,627
Product gross margin 163,144 167,815 175,817
Rental and royalty gross margin 3,098 3,211 2,887
Total gross margin 166,242 171,026 178,704
Selling, marketing and administrative expenses 108,276 106,316 103,755
Impairment charges — — 14,000
Earnings from operations 57,966 64,710 60,949
Other income (expense), net 2,946 8,358 2,100
Earnings before income taxes 60,912 73,068 63,049
Provision for income taxes 16,974 20,005 9,892
Net earnings $43,938 $53,063 $53,157
Other comprehensive earnings (loss) (8,740) 1,183 2,845
Comprehensive earnings $35,198 $54,246 $56,002
Retained earnings at beginning of year. $135,866 $147,687 $144,949
Net earnings 43,938 53,063 53,157
Cash dividends (18,360) (18,078) (17,790)
Stock dividends (47,175) (46,806) (32,629)
Retained earnings at end of year $114,269 $135,866 $147,687
Earnings per share $0.76 $0.90 $0.89
Average Common and Class B Common shares outstanding 57,892 58,685 59,425
(The accompanying notes are an integral part of these statements.)
CONSOLIDATED STATEMENTS OF
Financial Position
TOOTSIE ROLL INDUSTRIES, INC. AND SUBSIDIARIES (in thousands except per share data)
Assets December 31,
2011 2010
CURRENT ASSETS:
Cash and cash equivalents $78,612 $115,976
Investments 10,895 7,996
Accounts receivable trade, less allowances of $1,731 and $1,531 41,895 37,394
Other receivables 3,391 9,961
Inventories:
Finished goods and work-in-process 42,676 35,416
Raw materials and supplies 29,084 21,236
Prepaid expenses 5,070 6,499
Deferred income taxes 578 689
Total current assets 212,201 235,167
PROPERTY, PLANT AND EQUIPMENT, at cost:
Land 21,939 21,696
Buildings 107,567 102,934
Machinery and equipment 322,993 307,178
Broadening Your Perspective 10-1
http://edugen.wiley.com/edugen/shared/assignment/test/qprint.uni[10/21/2015 2:28:27 PM]
Construction in progress 2,598 9,243
455,097 440,974
Less—Accumulated depreciation 242,935 225,482
Net property, plant and equipment 212,162 215,492
OTHER ASSETS:
Goodwill 73,237 73,237
Trademarks 175,024 175,024
Investments 96,161 64,461
Split dollar officer life insurance 74,209 74,441
Prepaid expenses 3,212 6,680
Equity method investment 3,935 4,254
Deferred income taxes 7,715 9,203
...
The Impact of Artificial Intelligence on Modern Society.pdfssuser3e63fc
Just a game Assignment 3
1. What has made Louis Vuitton's business model successful in the Japanese luxury market?
2. What are the opportunities and challenges for Louis Vuitton in Japan?
3. What are the specifics of the Japanese fashion luxury market?
4. How did Louis Vuitton enter into the Japanese market originally? What were the other entry strategies it adopted later to strengthen its presence?
5. Will Louis Vuitton have any new challenges arise due to the global financial crisis? How does it overcome the new challenges?Assignment 3
1. What has made Louis Vuitton's business model successful in the Japanese luxury market?
2. What are the opportunities and challenges for Louis Vuitton in Japan?
3. What are the specifics of the Japanese fashion luxury market?
4. How did Louis Vuitton enter into the Japanese market originally? What were the other entry strategies it adopted later to strengthen its presence?
5. Will Louis Vuitton have any new challenges arise due to the global financial crisis? How does it overcome the new challenges?
Want to move your career forward? Looking to build your leadership skills while helping others learn, grow, and improve their skills? Seeking someone who can guide you in achieving these goals?
You can accomplish this through a mentoring partnership. Learn more about the PMISSC Mentoring Program, where you’ll discover the incredible benefits of becoming a mentor or mentee. This program is designed to foster professional growth, enhance skills, and build a strong network within the project management community. Whether you're looking to share your expertise or seeking guidance to advance your career, the PMI Mentoring Program offers valuable opportunities for personal and professional development.
Watch this to learn:
* Overview of the PMISSC Mentoring Program: Mission, vision, and objectives.
* Benefits for Volunteer Mentors: Professional development, networking, personal satisfaction, and recognition.
* Advantages for Mentees: Career advancement, skill development, networking, and confidence building.
* Program Structure and Expectations: Mentor-mentee matching process, program phases, and time commitment.
* Success Stories and Testimonials: Inspiring examples from past participants.
* How to Get Involved: Steps to participate and resources available for support throughout the program.
Learn how you can make a difference in the project management community and take the next step in your professional journey.
About Hector Del Castillo
Hector is VP of Professional Development at the PMI Silver Spring Chapter, and CEO of Bold PM. He's a mid-market growth product executive and changemaker. He works with mid-market product-driven software executives to solve their biggest growth problems. He scales product growth, optimizes ops and builds loyal customers. He has reduced customer churn 33%, and boosted sales 47% for clients. He makes a significant impact by building and launching world-changing AI-powered products. If you're looking for an engaging and inspiring speaker to spark creativity and innovation within your organization, set up an appointment to discuss your specific needs and identify a suitable topic to inspire your audience at your next corporate conference, symposium, executive summit, or planning retreat.
About PMI Silver Spring Chapter
We are a branch of the Project Management Institute. We offer a platform for project management professionals in Silver Spring, MD, and the DC/Baltimore metro area. Monthly meetings facilitate networking, knowledge sharing, and professional development. For event details, visit pmissc.org.
New Explore Careers and College Majors 2024.pdfDr. Mary Askew
Explore Careers and College Majors is a new online, interactive, self-guided career, major and college planning system.
The career system works on all devices!
For more Information, go to https://bit.ly/3SW5w8W
1. Bizim Toptan Satis Magazalari AS (BIZIM)
BIZIM Balance Sheet
Period Ending:
2021
31/12
2020
31/12
2019
31/12
Total Current Assets 1540.87 1053.22 767.9
Cash and Short Term Investments 503.86 327.22 399.04
Cash 42.99 35.08 32.03
Cash & Equivalents - 173.57 3.71
Short Term Investments 460.88 292.14 367
Total Receivables, Net 256.62 269.81 66.33
Accounts Receivables - Trade, Net 255.08 269.56 66.21
Total Inventory 733.56 437.5 296.43
Prepaid Expenses 42.87 18.69 6.1
Other Current Assets, Total 3.96 - -
Total Assets 2138.5 1520.08 1140.65
Property/Plant/Equipment, Total -
Net
496.63 424.71 331.37
Property/Plant/Equipment,
Total - Gross
847.91 696.46 540.09
Accumulated Depreciation, Total -351.27 -271.76 -208.72
Goodwill, Net - - -
Intangibles, Net 58.9 34.86 38.32
Long Term Investments - - -
Note Receivable - Long Term 4.49 3.18 2.42
Other Long Term Assets, Total 37.61 4.12 0.64
Other Assets, Total - - -
Total Current Liabilities 1730.32 1198.55 860.71
Accounts Payable 1540.38 1055.61 751.69
Payable/Accrued - - -
Accrued Expenses 53.28 39.62 32.26
Notes Payable/Short Term Debt - - -
Current Port. of LT Debt/Capital
Leases
77.95 70.98 57.31
Other Current liabilities, Total 58.71 32.34 19.44
2. Total Liabilities 1922.38 1367.39 999.37
Total Long Term Debt 143.91 137.19 115.1
Long Term Debt - - -
Capital Lease Obligations 143.91 137.19 115.1
Deferred Income Tax - - -
Minority Interest -0.02 -0 -
Other Liabilities, Total 48.17 31.65 23.56
Total Equity 216.12 152.69 141.28
Redeemable Preferred Stock, Total - - - -
Preferred Stock - Non Redeemable,
Net
- - - -
Common Stock, Total 60 60 60 60
Additional Paid-In Capital - - - -
Retained Earnings (Accumulated
Deficit)
191.22 128.19 98.27
75.
5
Treasury Stock - Common -13.53 -13.53 -13.53
ESOP Debt Guarantee - - - -
Unrealized Gain (Loss) - - -
Other Equity, Total -21.57 -21.97 -3.46
Total Liabilities &
Shareholders' Equity
2138.5 1520.08 1140.65
Total Common Shares
Outstanding
60 60 60
Total Preferred Shares
Outstanding
- - -
* In Millions of TRY (except for per share items)
3. BIZIM Income Statement
Period Ending:
2021
31/12
2020
31/12
2019
31/12
Total Revenue 7173.14 5361.82 4520.67
Revenue 7173.14 5361.82 4520.67
Other Revenue, Total - - -
Cost of Revenue, Total 6290.32 4780.18 4005.21
Gross Profit 882.82 581.64 515.46
Total Operating Expenses 7024.2 5267.53 4441.74
Selling/General/Admin. Expenses,
Total
485.14 329.93 260.13
Research & Development - - -
Depreciation / Amortization 95.13 76.04 66.91
Interest Expense (Income) - Net
Operating
-17.19 -0.31 -0.32
Unusual Expense (Income) 6.56 2.14 2.38
Other Operating Expenses, Total 164.23 79.55 107.43
Operating Income 148.95 94.29 78.93
Interest Income (Expense), Net Non-
Operating
-62.64 -41.71 -34.83
Gain (Loss) on Sale of Assets -10.6 -2.24 -1.13
Other, Net -1.62 -1.78 -1.41
Net Income Before Taxes 74.08 48.56 41.56
Provision for Income Taxes -8.16 10.38 8.48
Net Income After Taxes 82.25 38.18 33.08
Minority Interest 0.02 0.01 -
Equity In Affiliates - - -
U.S GAAP Adjustment - - -
Net Income Before Extraordinary
Items
82.27 38.19 33.08
Total Extraordinary Items - - -
Net Income 82.27 38.19 33.08
Total Adjustments to Net Income - - -
Income Available to Common
Excluding Extraordinary Items
82.27 38.19 33.08
Dilution Adjustment -0.02 - -
Diluted Net Income 82.25 38.19 33.08
Diluted Weighted Average Shares 58.84 58.84 58.84
Diluted EPS Excluding Extraordinary
Items
1.4 0.65 0.56
DPS - Common Stock Primary Issue - 0.32 0.14
Diluted Normalized EPS 1.59 0.71 0.61