
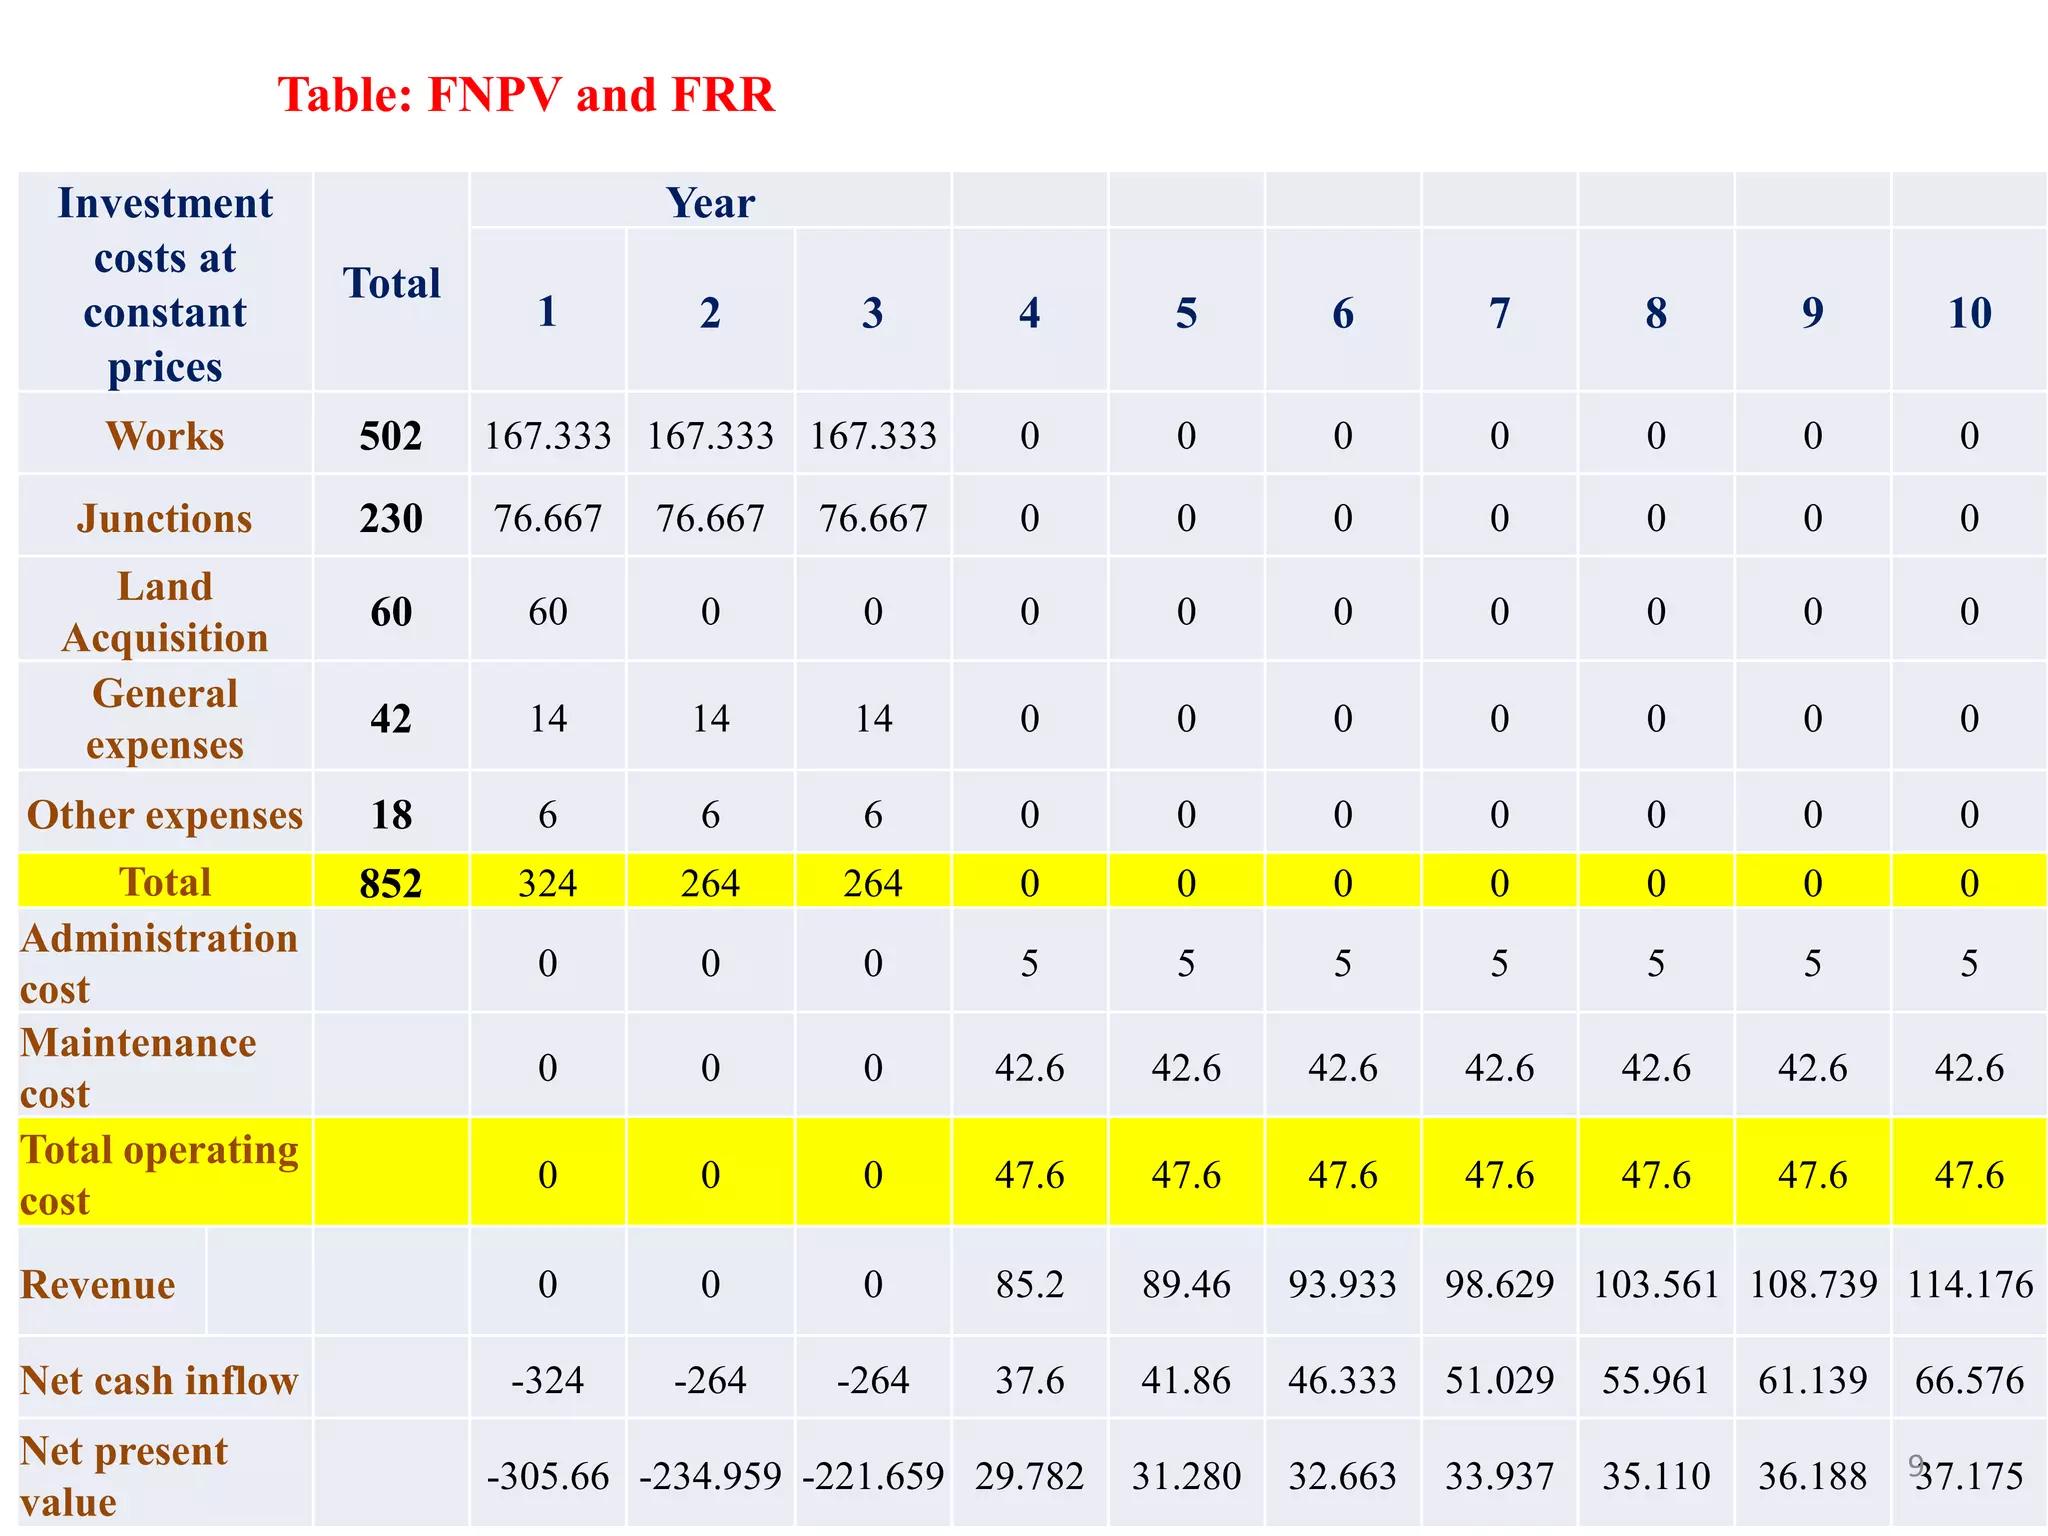
![ Financial return on investment cost
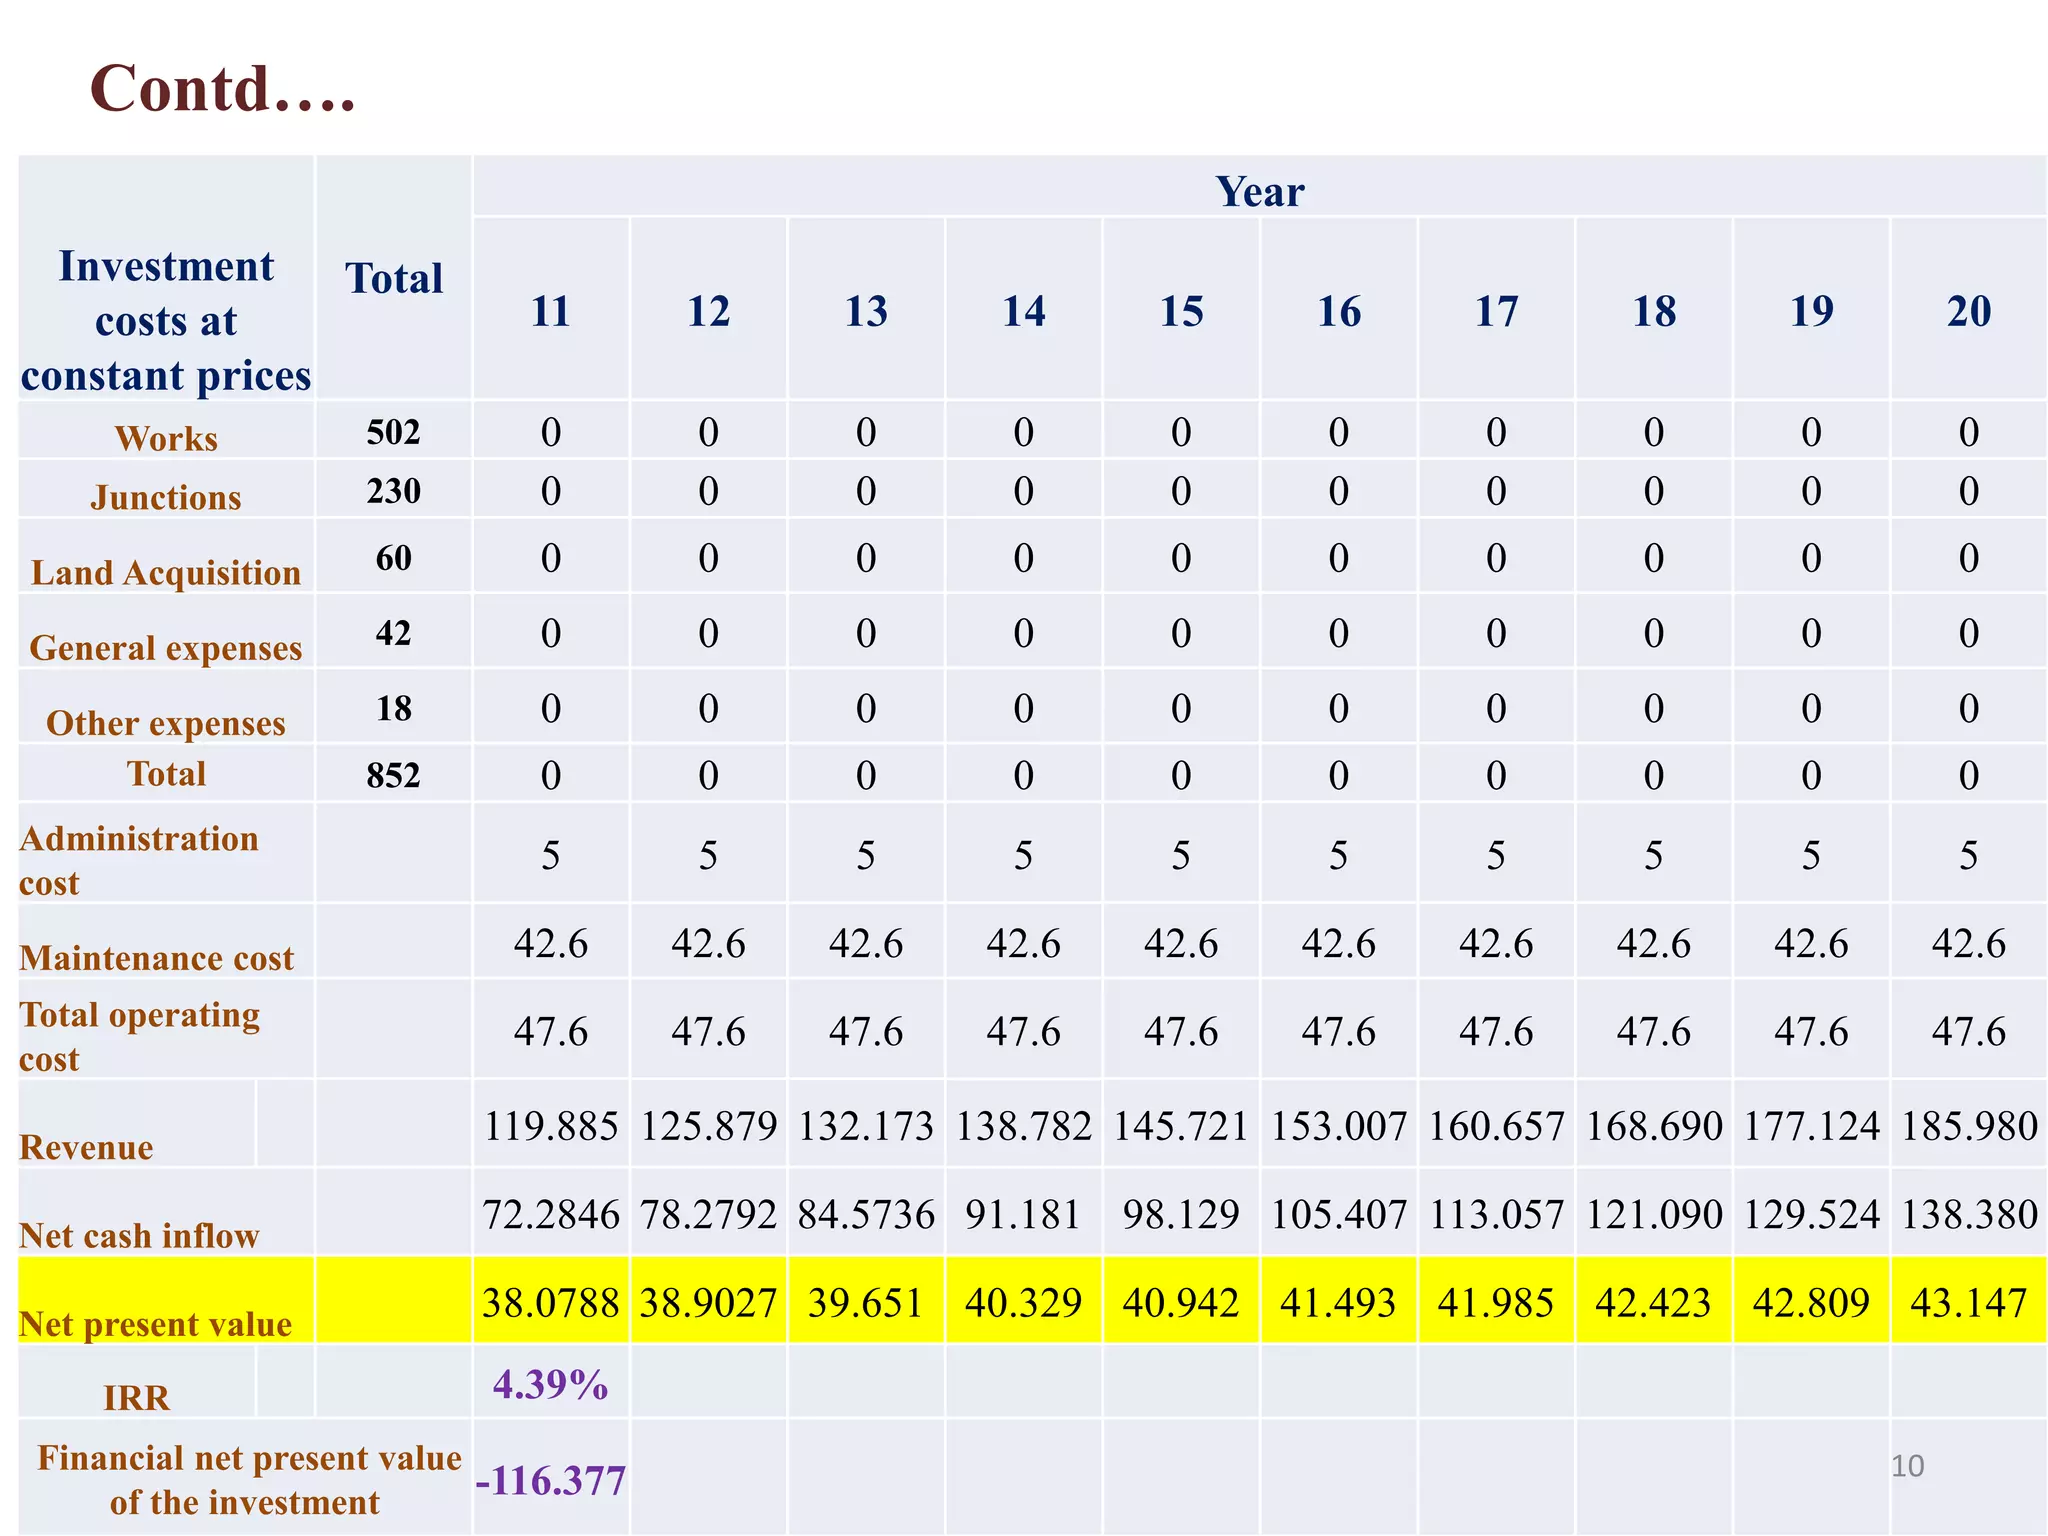
Financial net present value of the project (FNPV)
Financial internal rate of return (FRR)
Where
St =balance of cash flow at time t
nt =financial discount factor chosen for discounting at time t
The financial internal rate of return - discount rate that produces
a zero FNPV
FNPV = Σ [St / (1+FRR)t ] = 0
FNPV= 𝒕=𝟎
𝒎
𝒏𝐭 𝐒𝐭=S0/(1+i)0+S1/(1+i)1+……….+Sn/(1+i)n
8](https://image.slidesharecdn.com/grouppresentation-180217042730/75/Case-study-Investment-in-a-new-Motor-way-Between-IIT-area-and-Midnipur-town-8-2048.jpg)
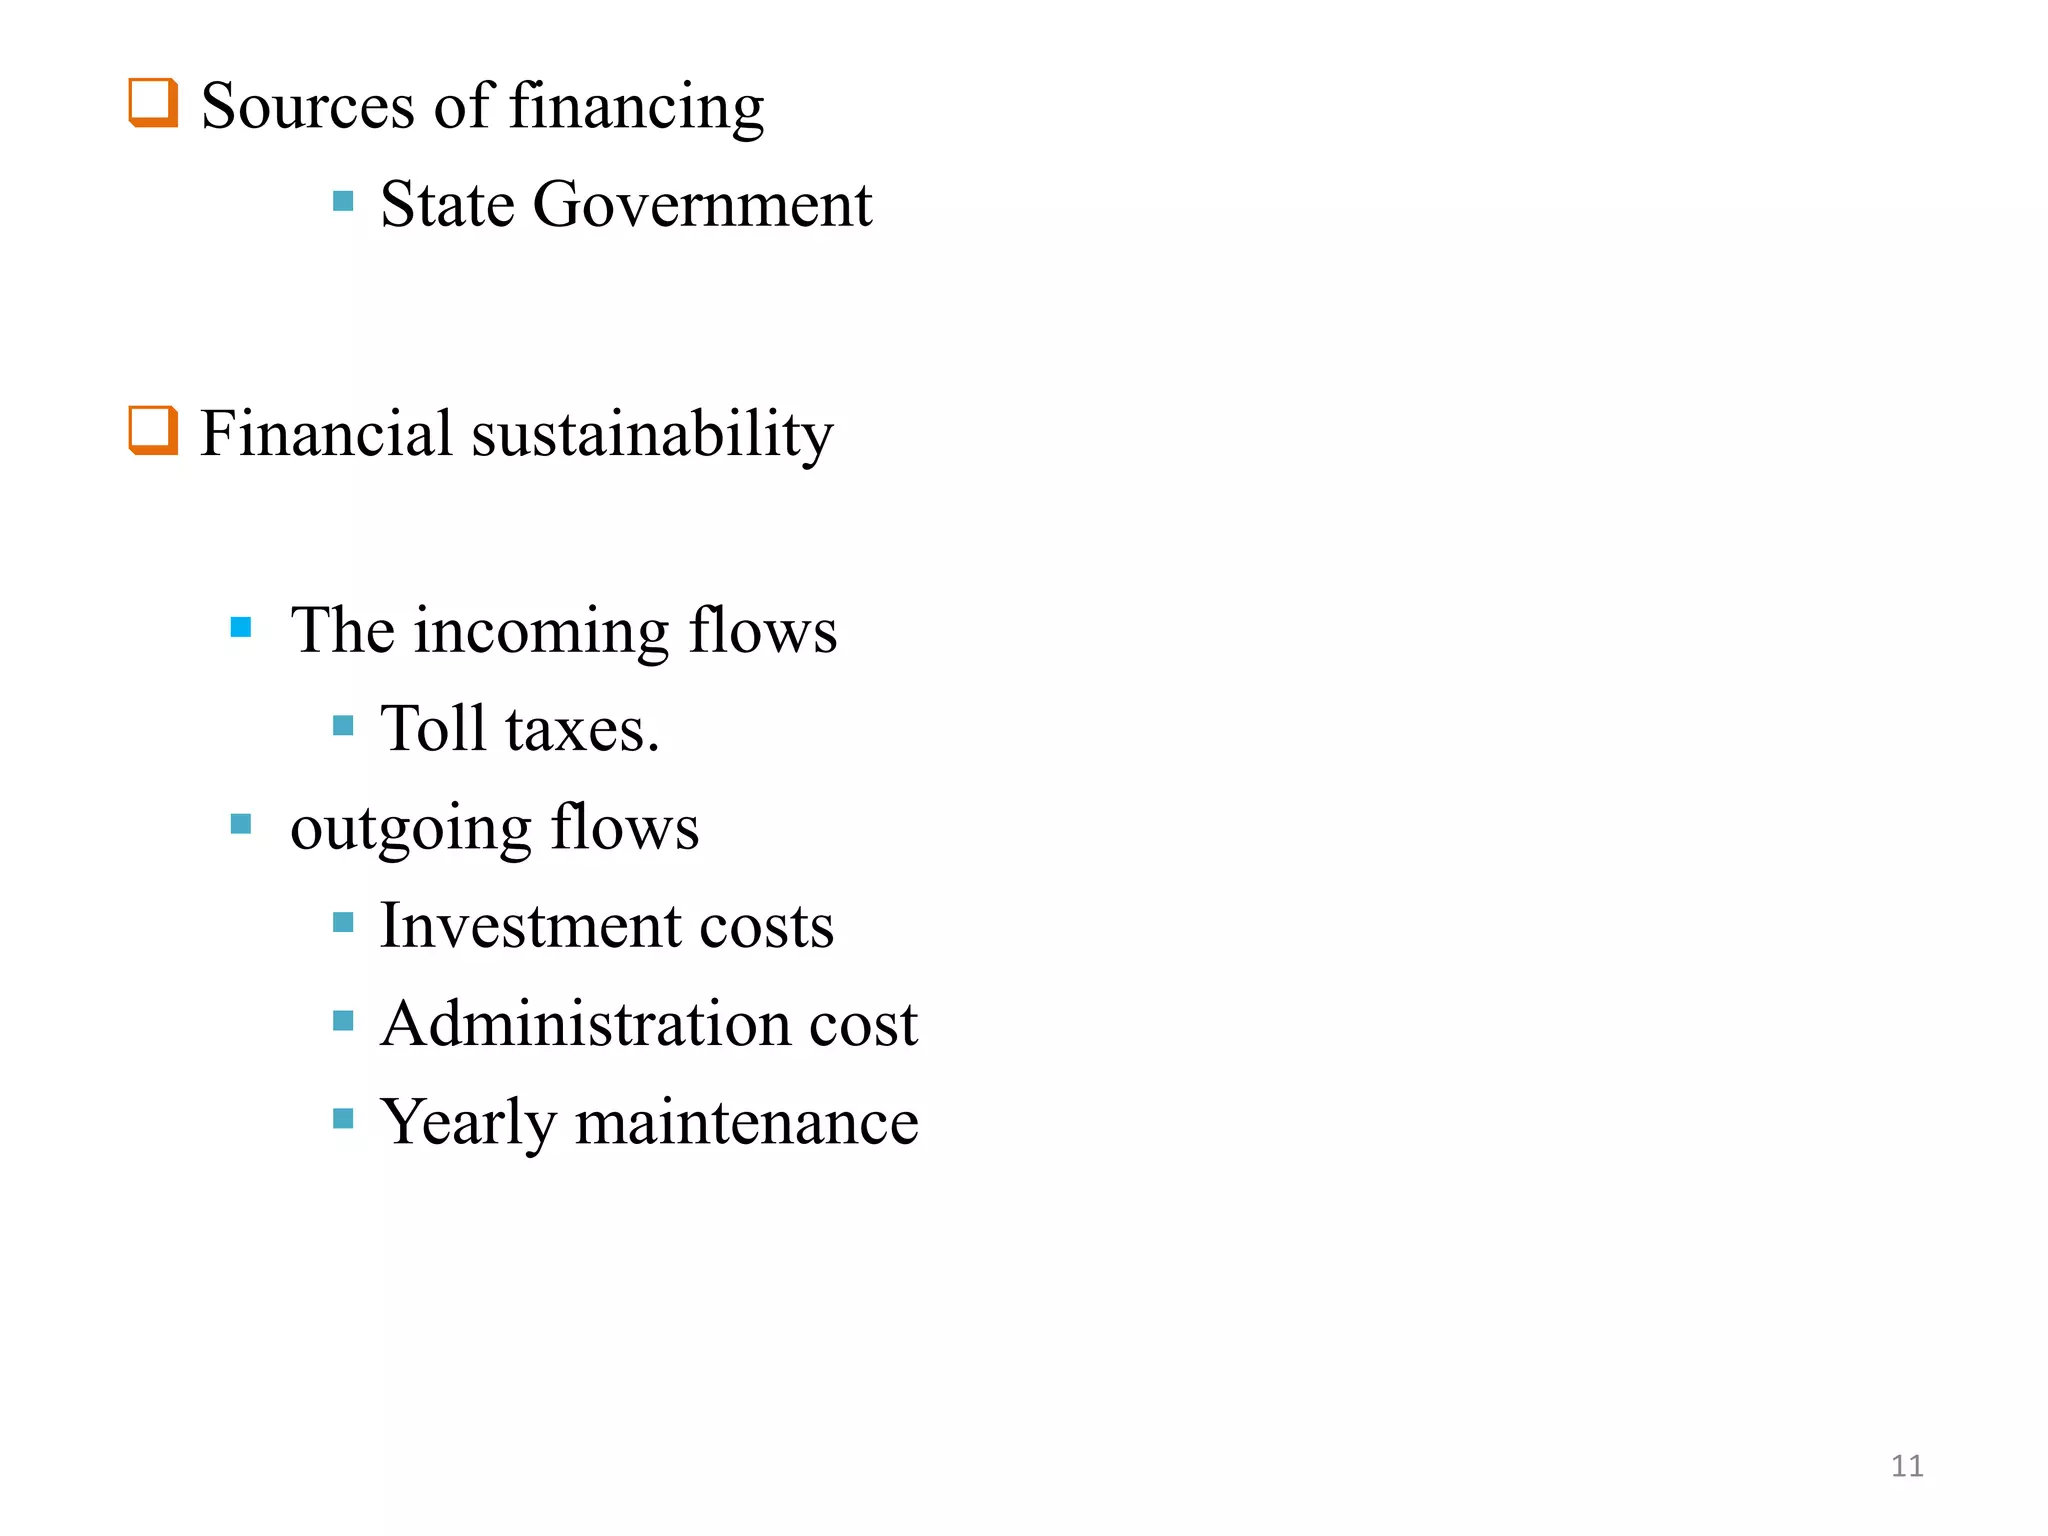
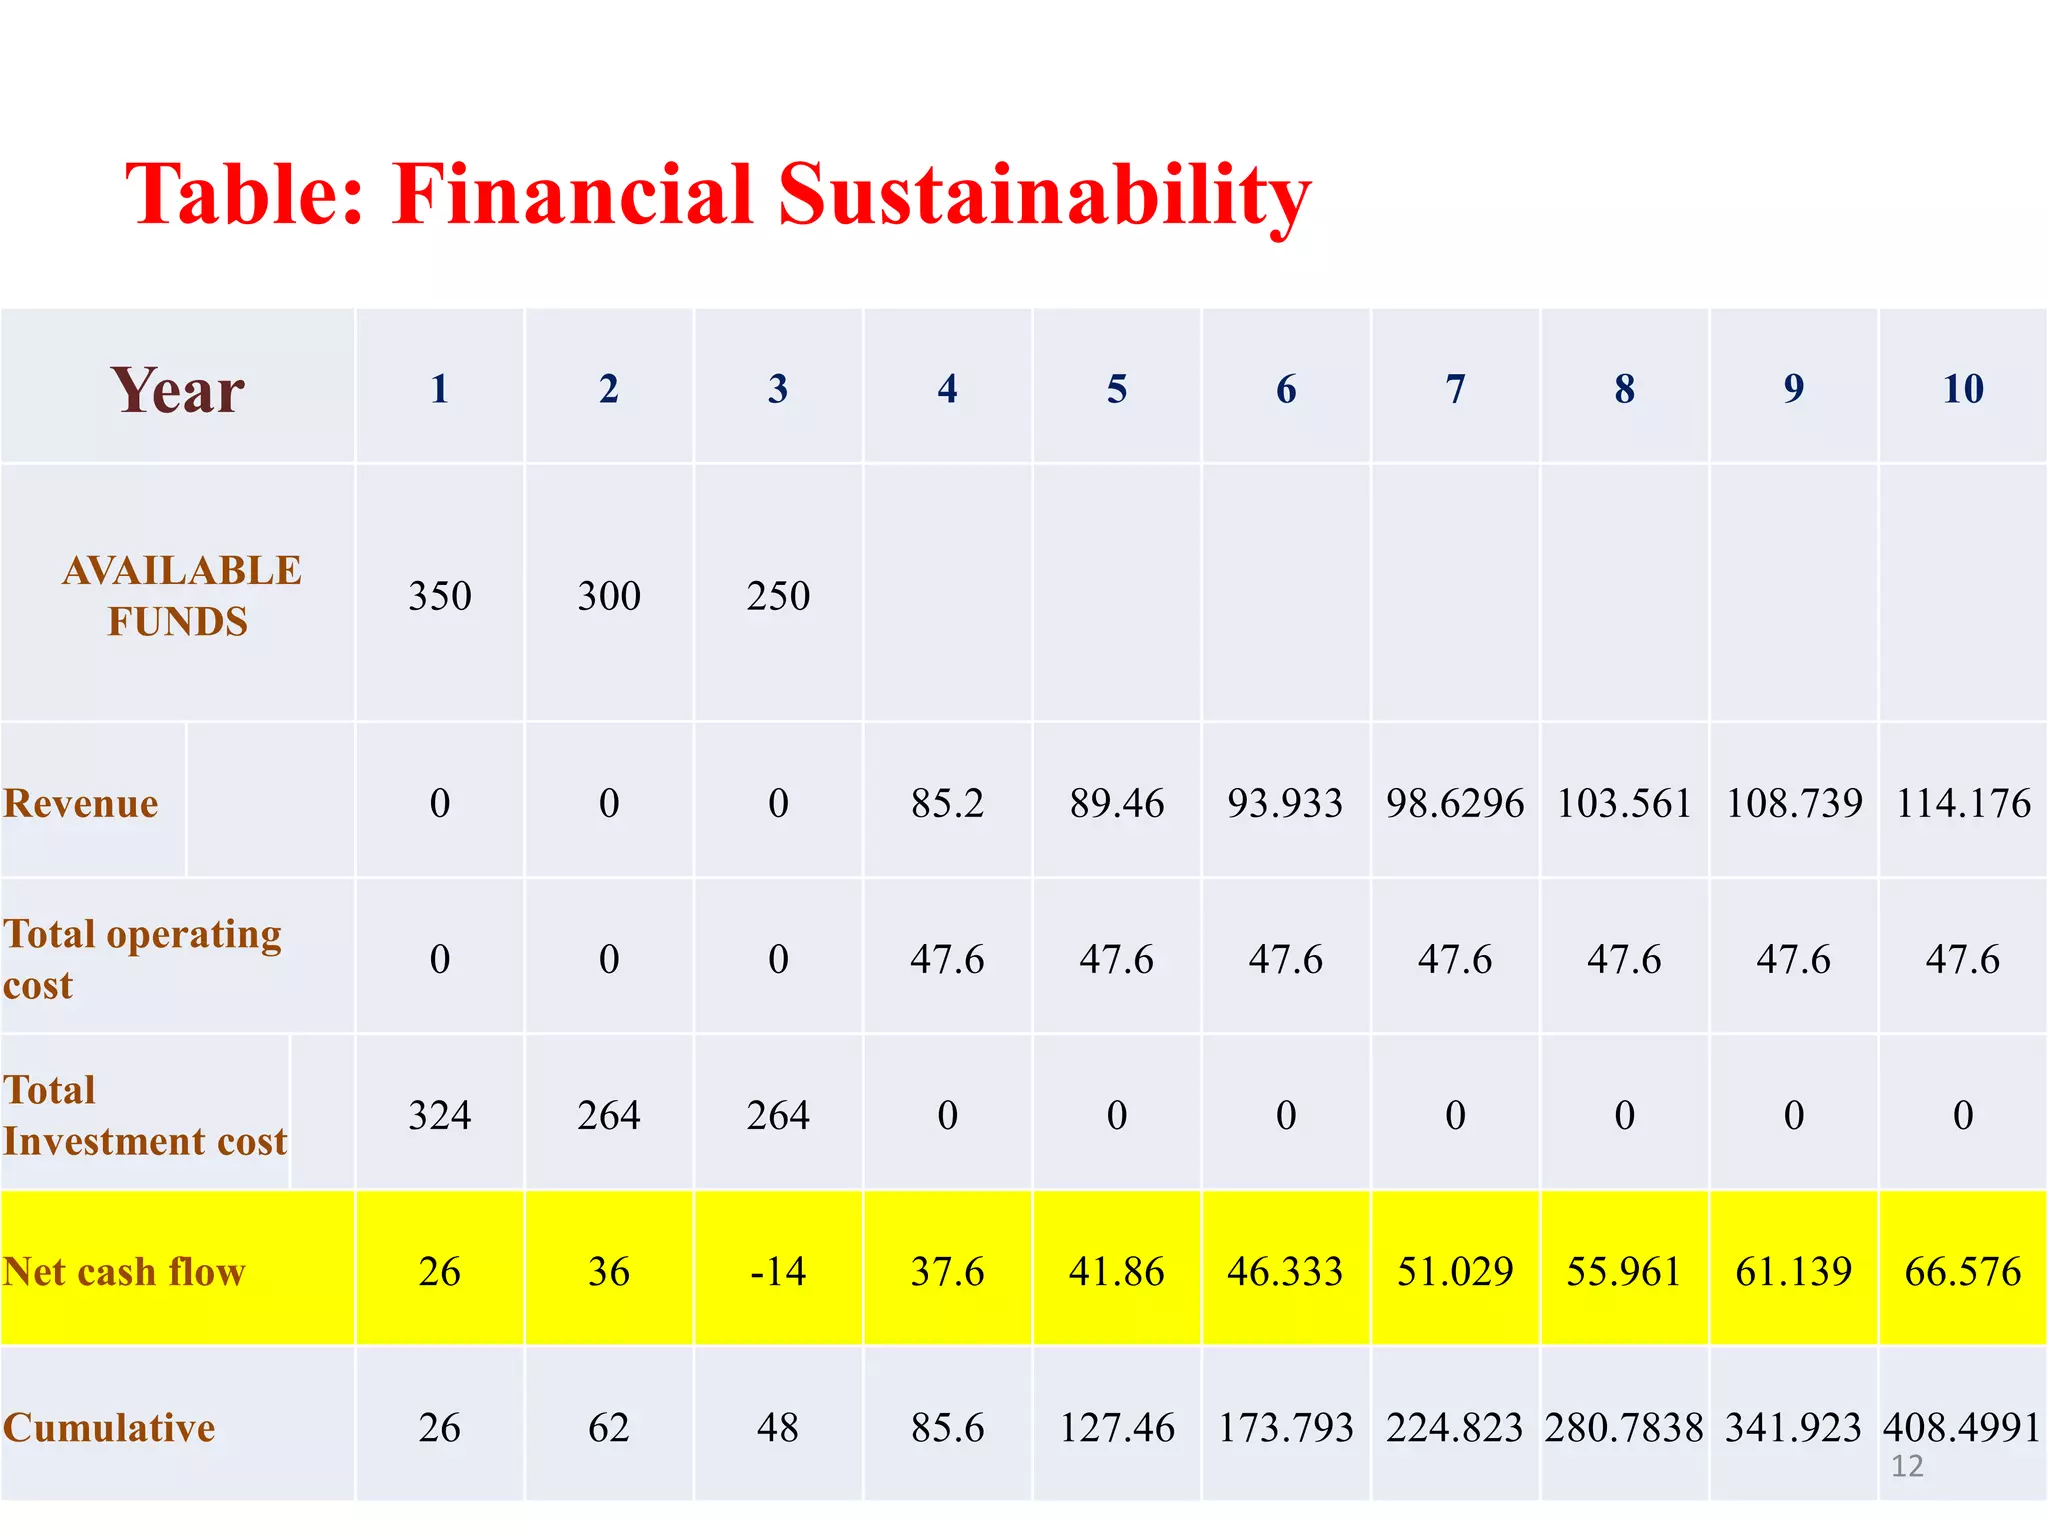
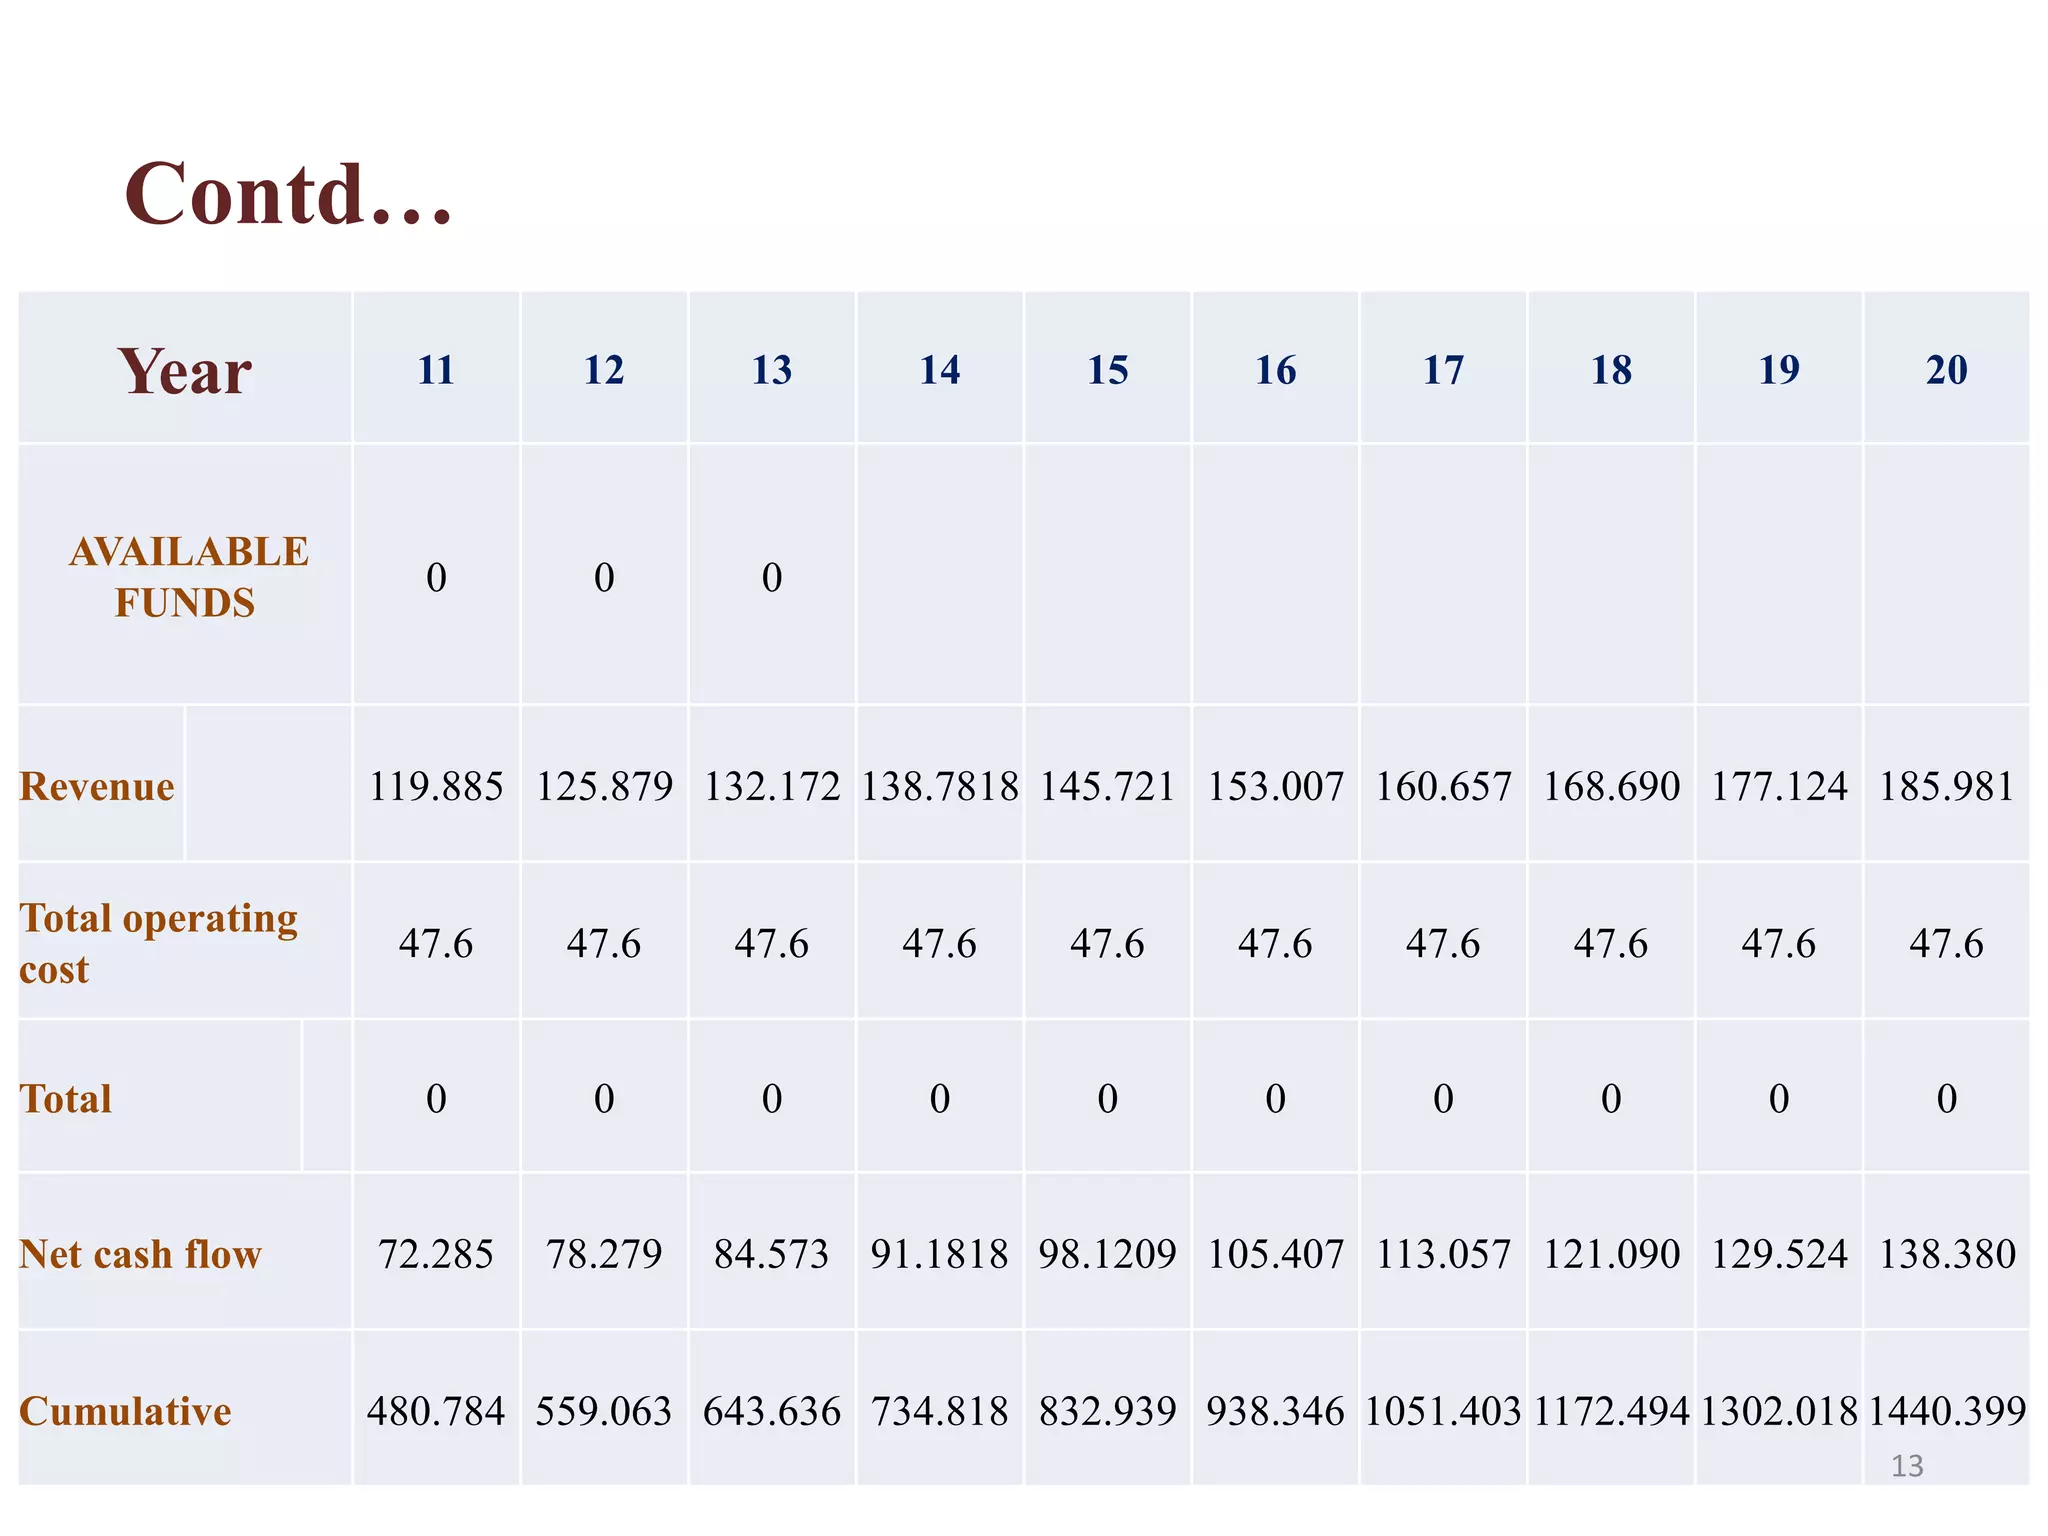
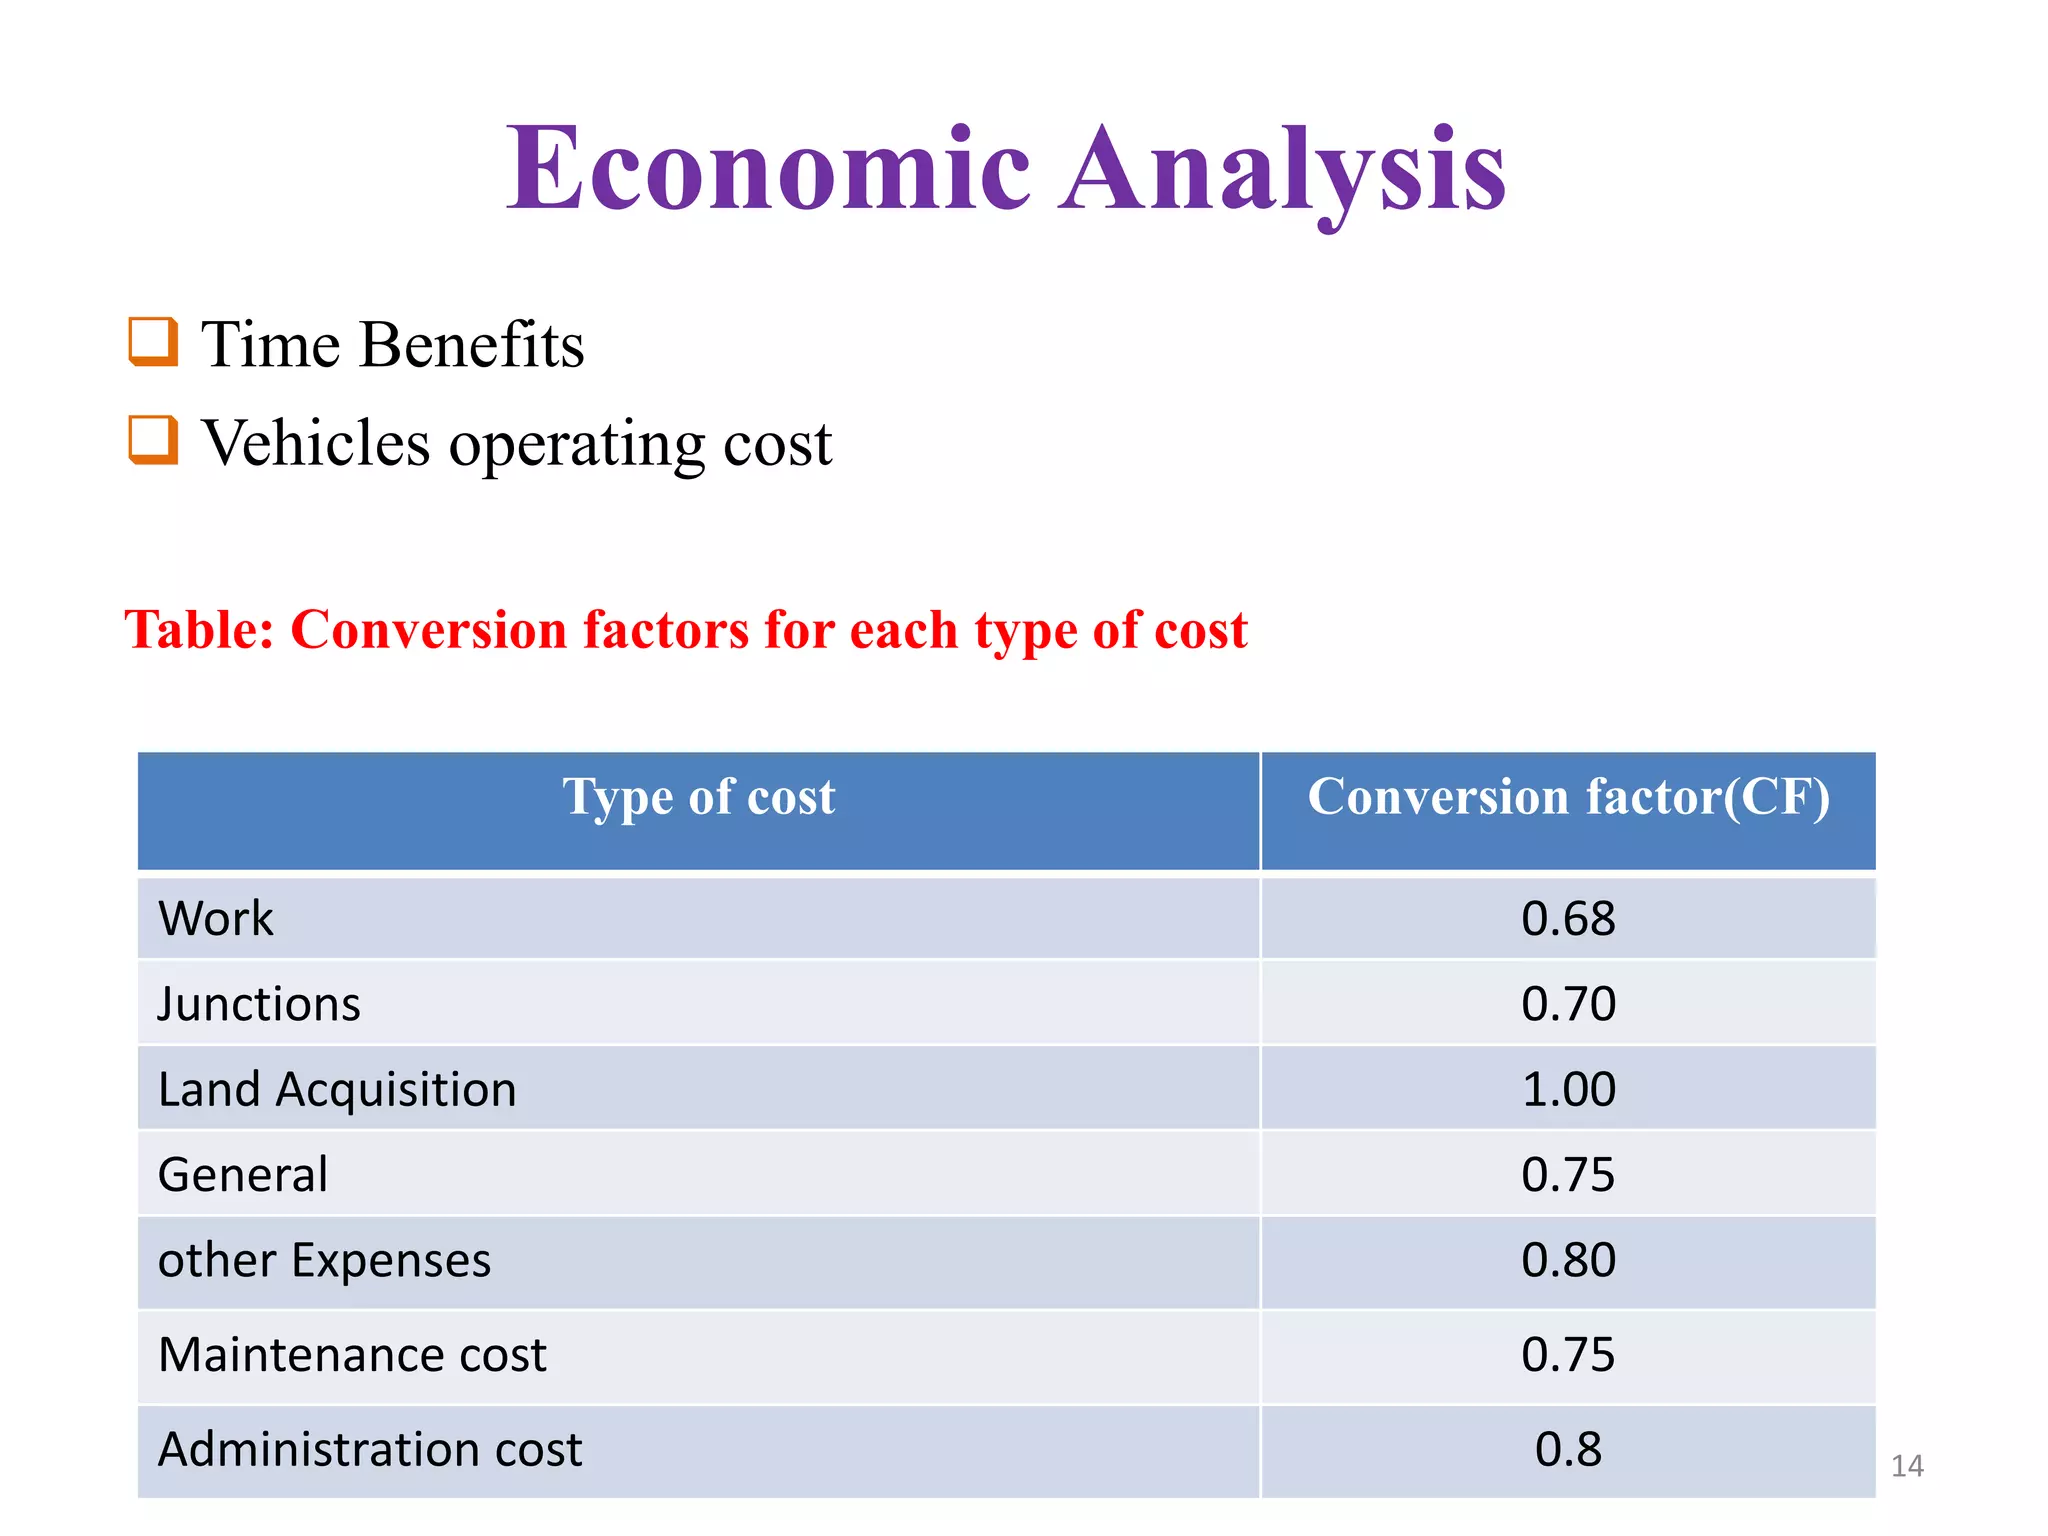
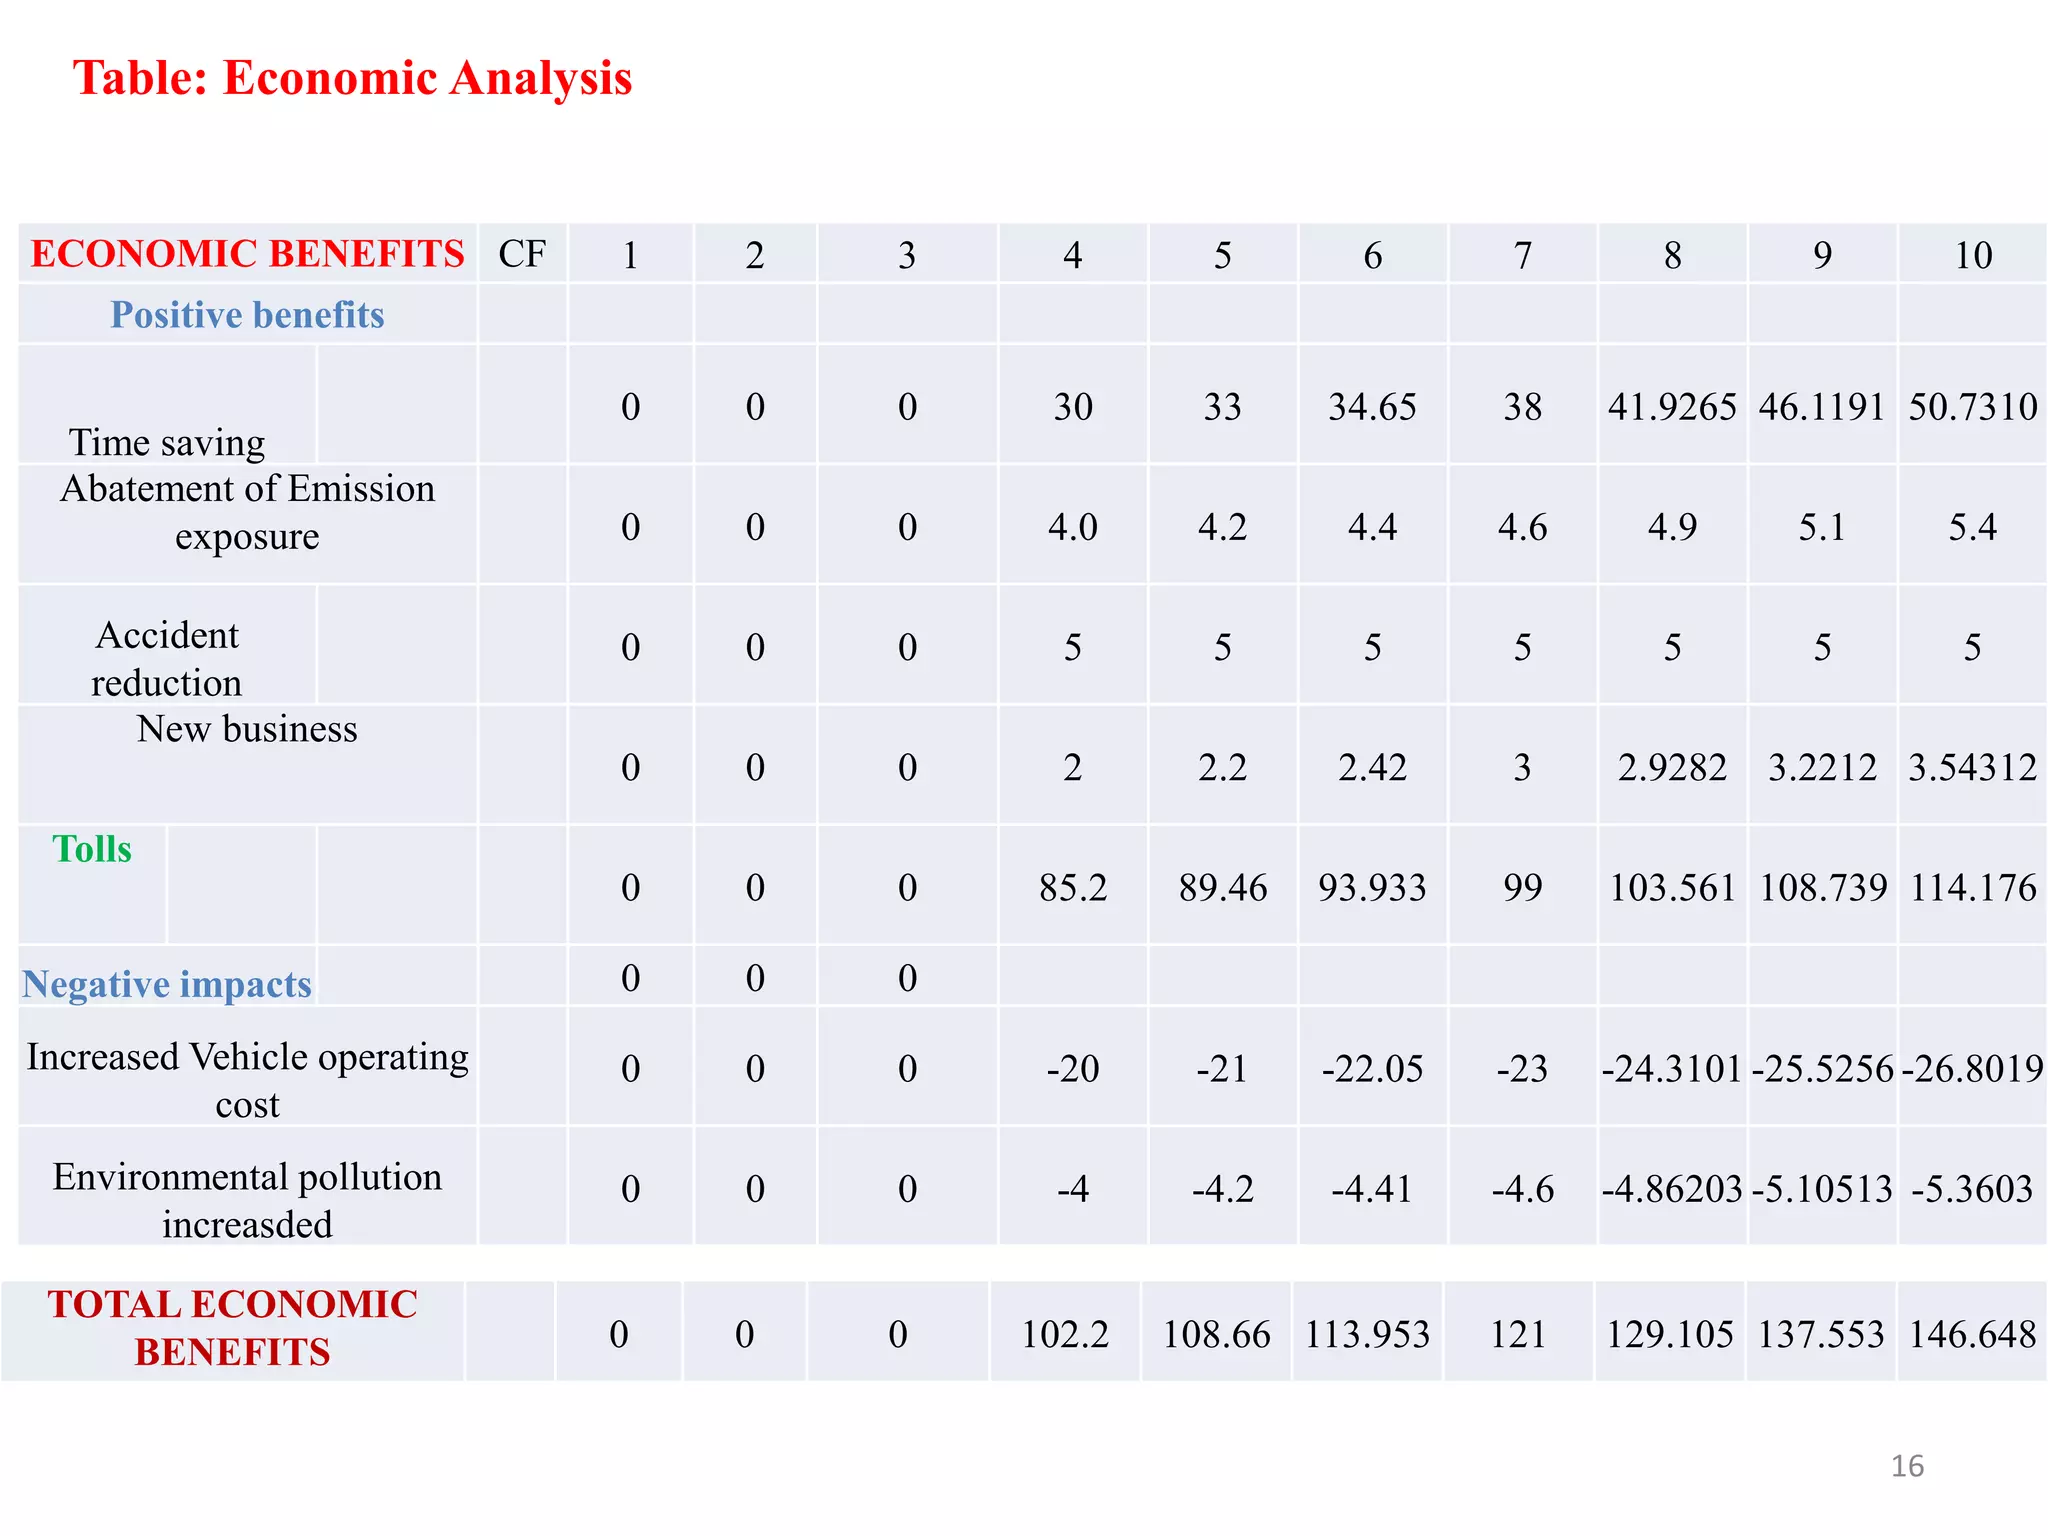
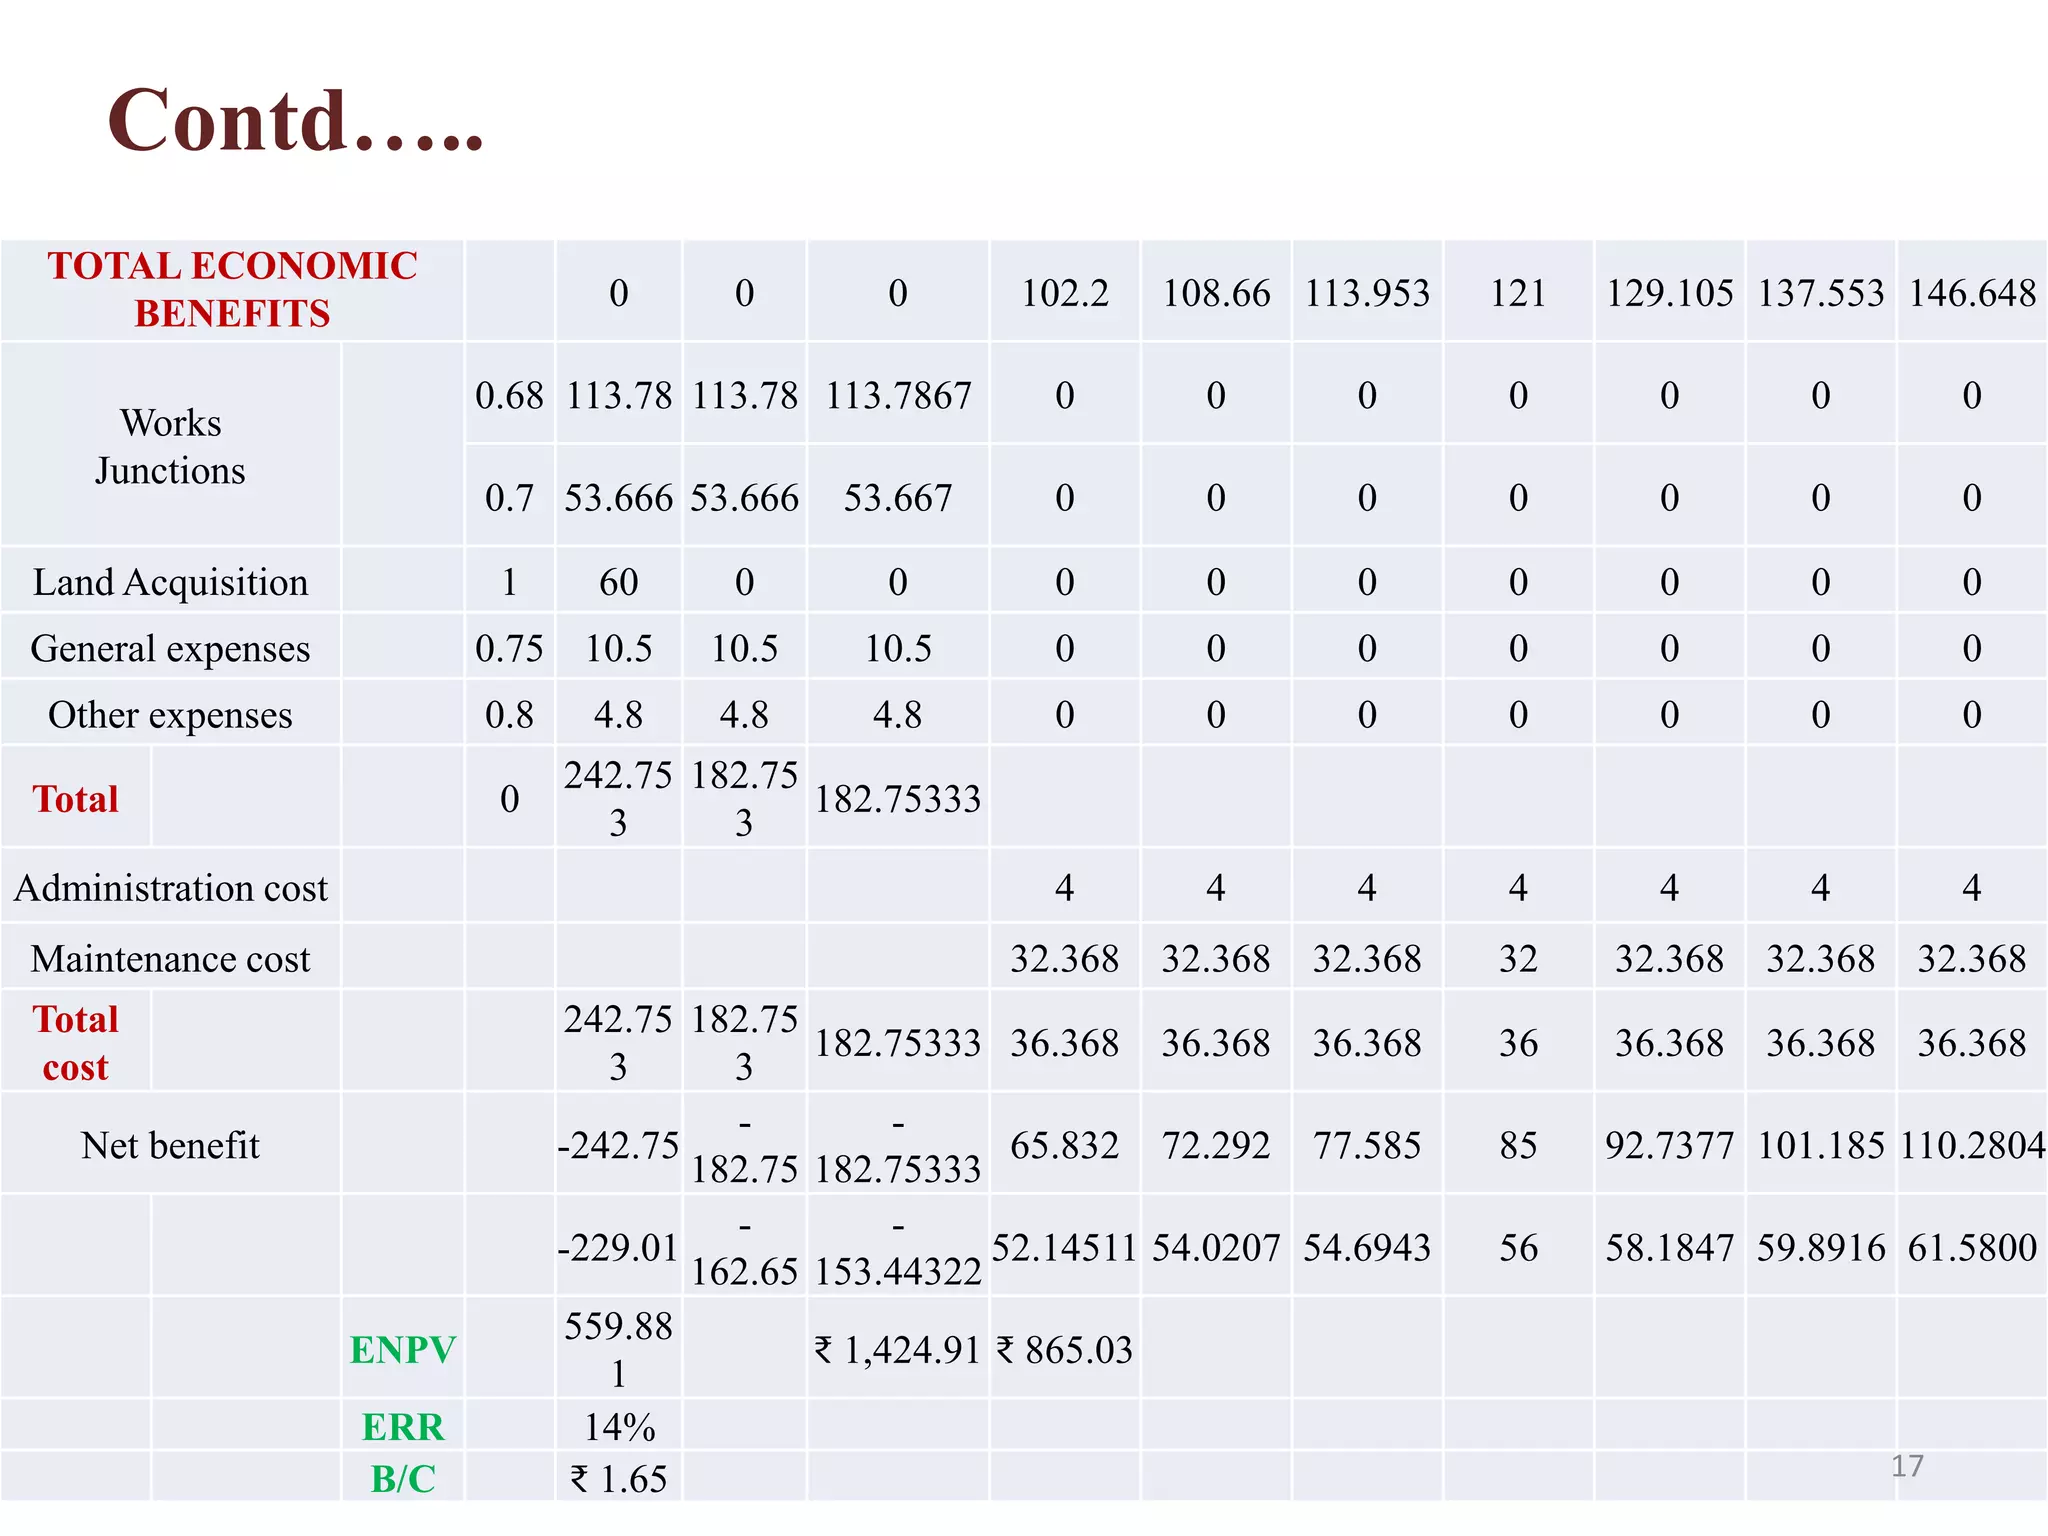
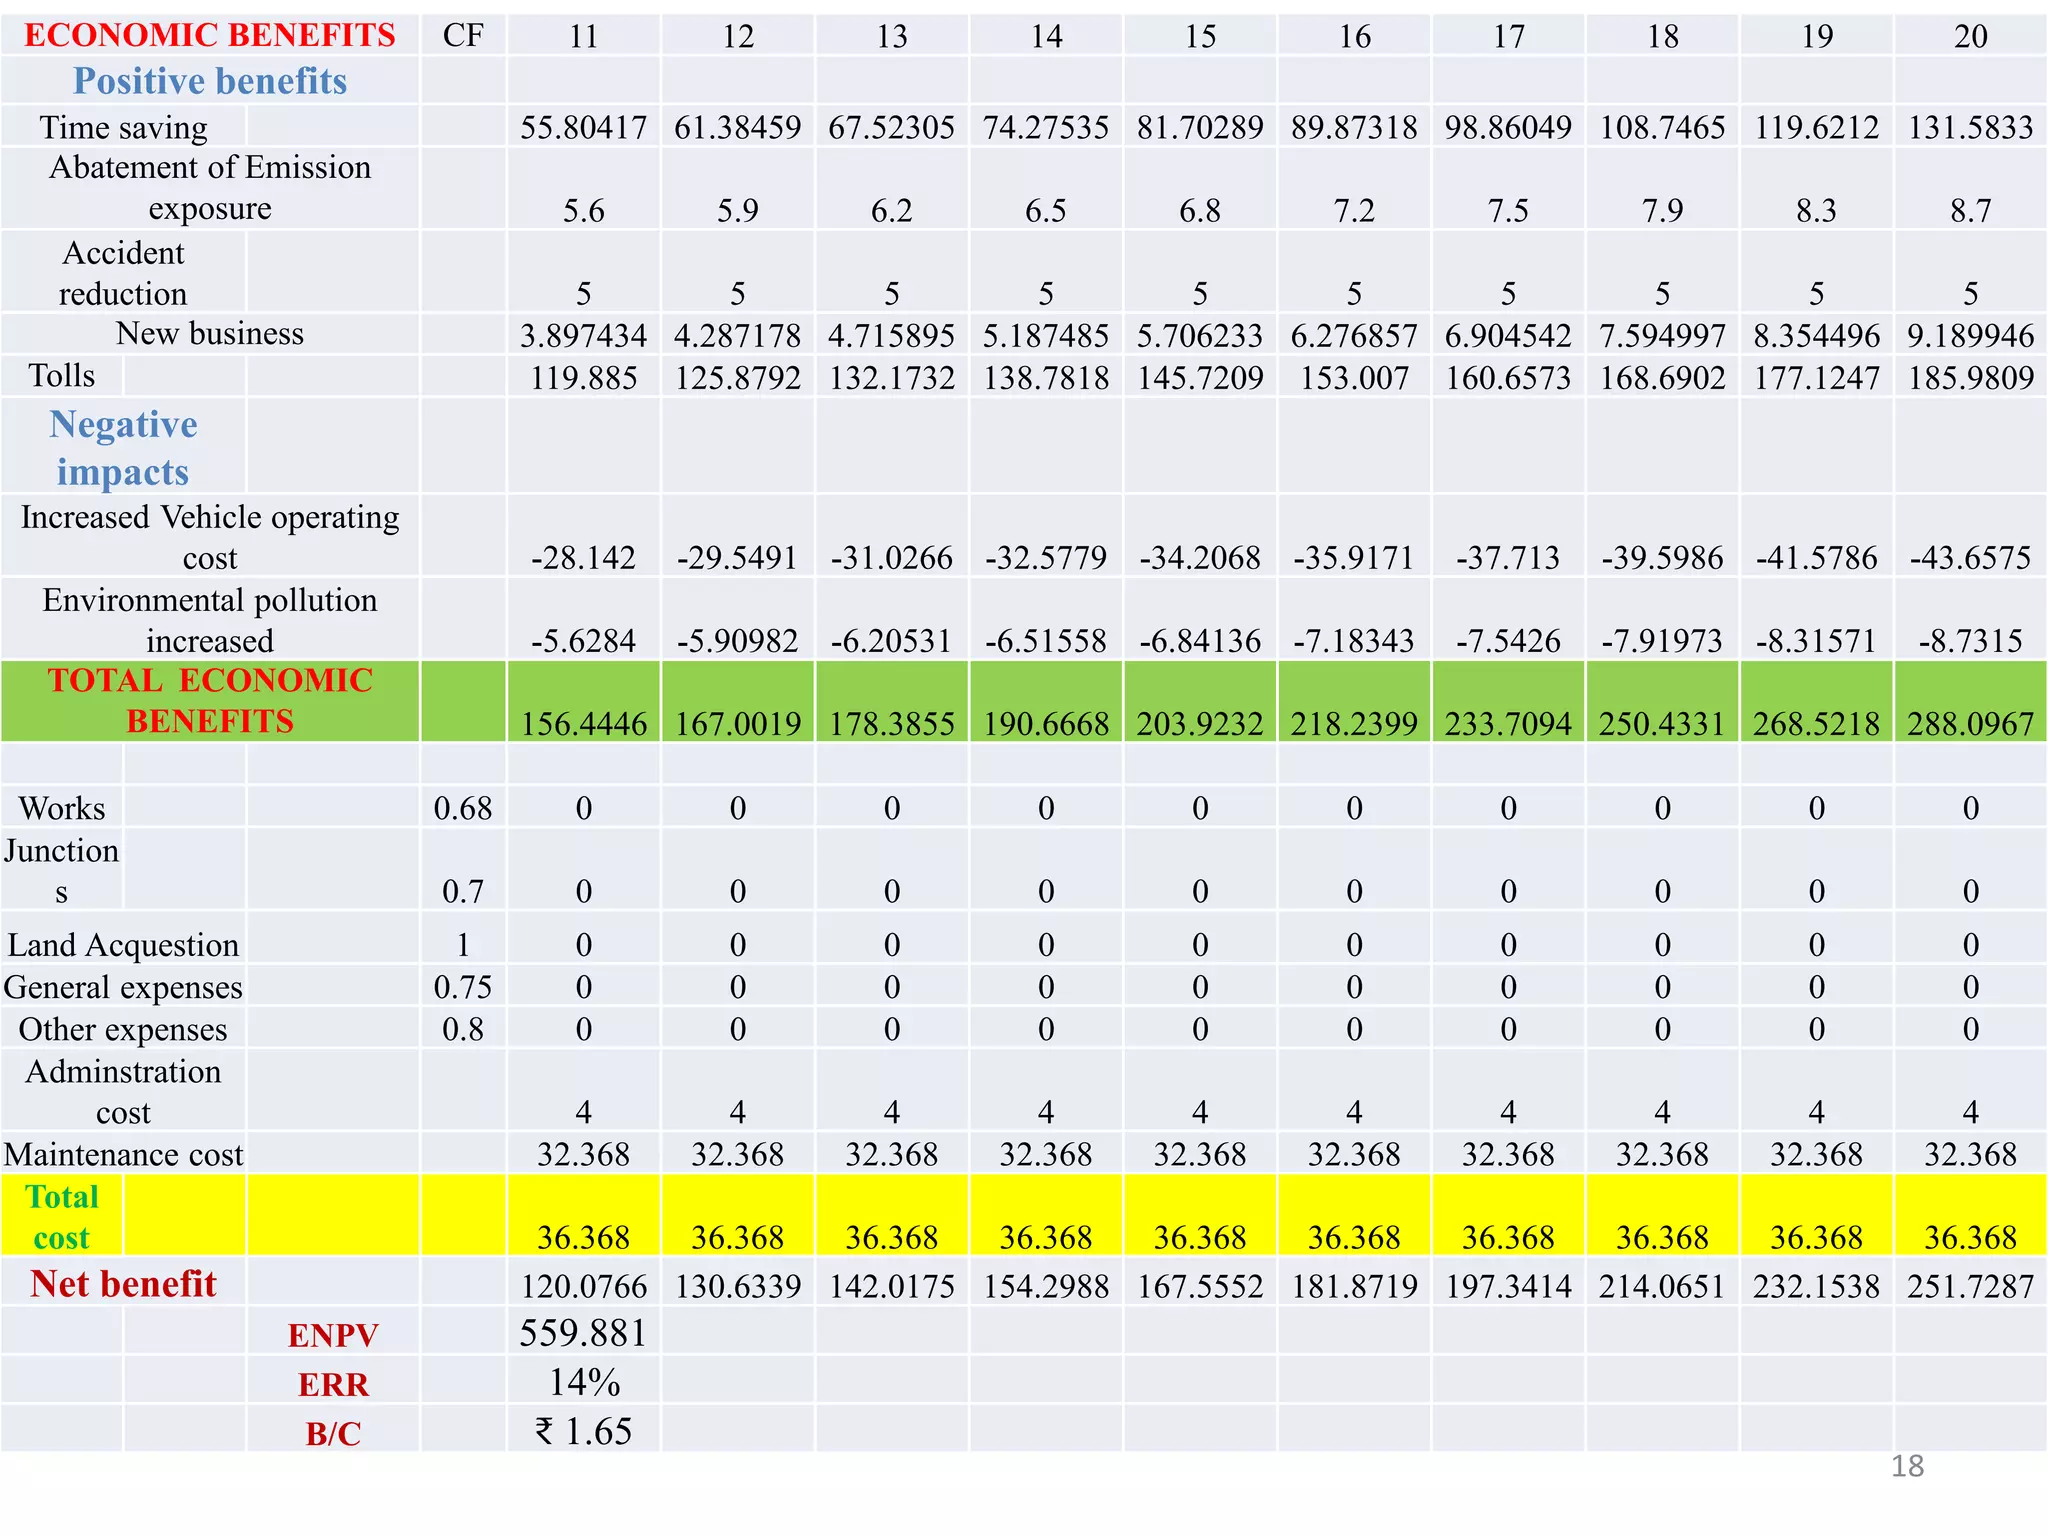
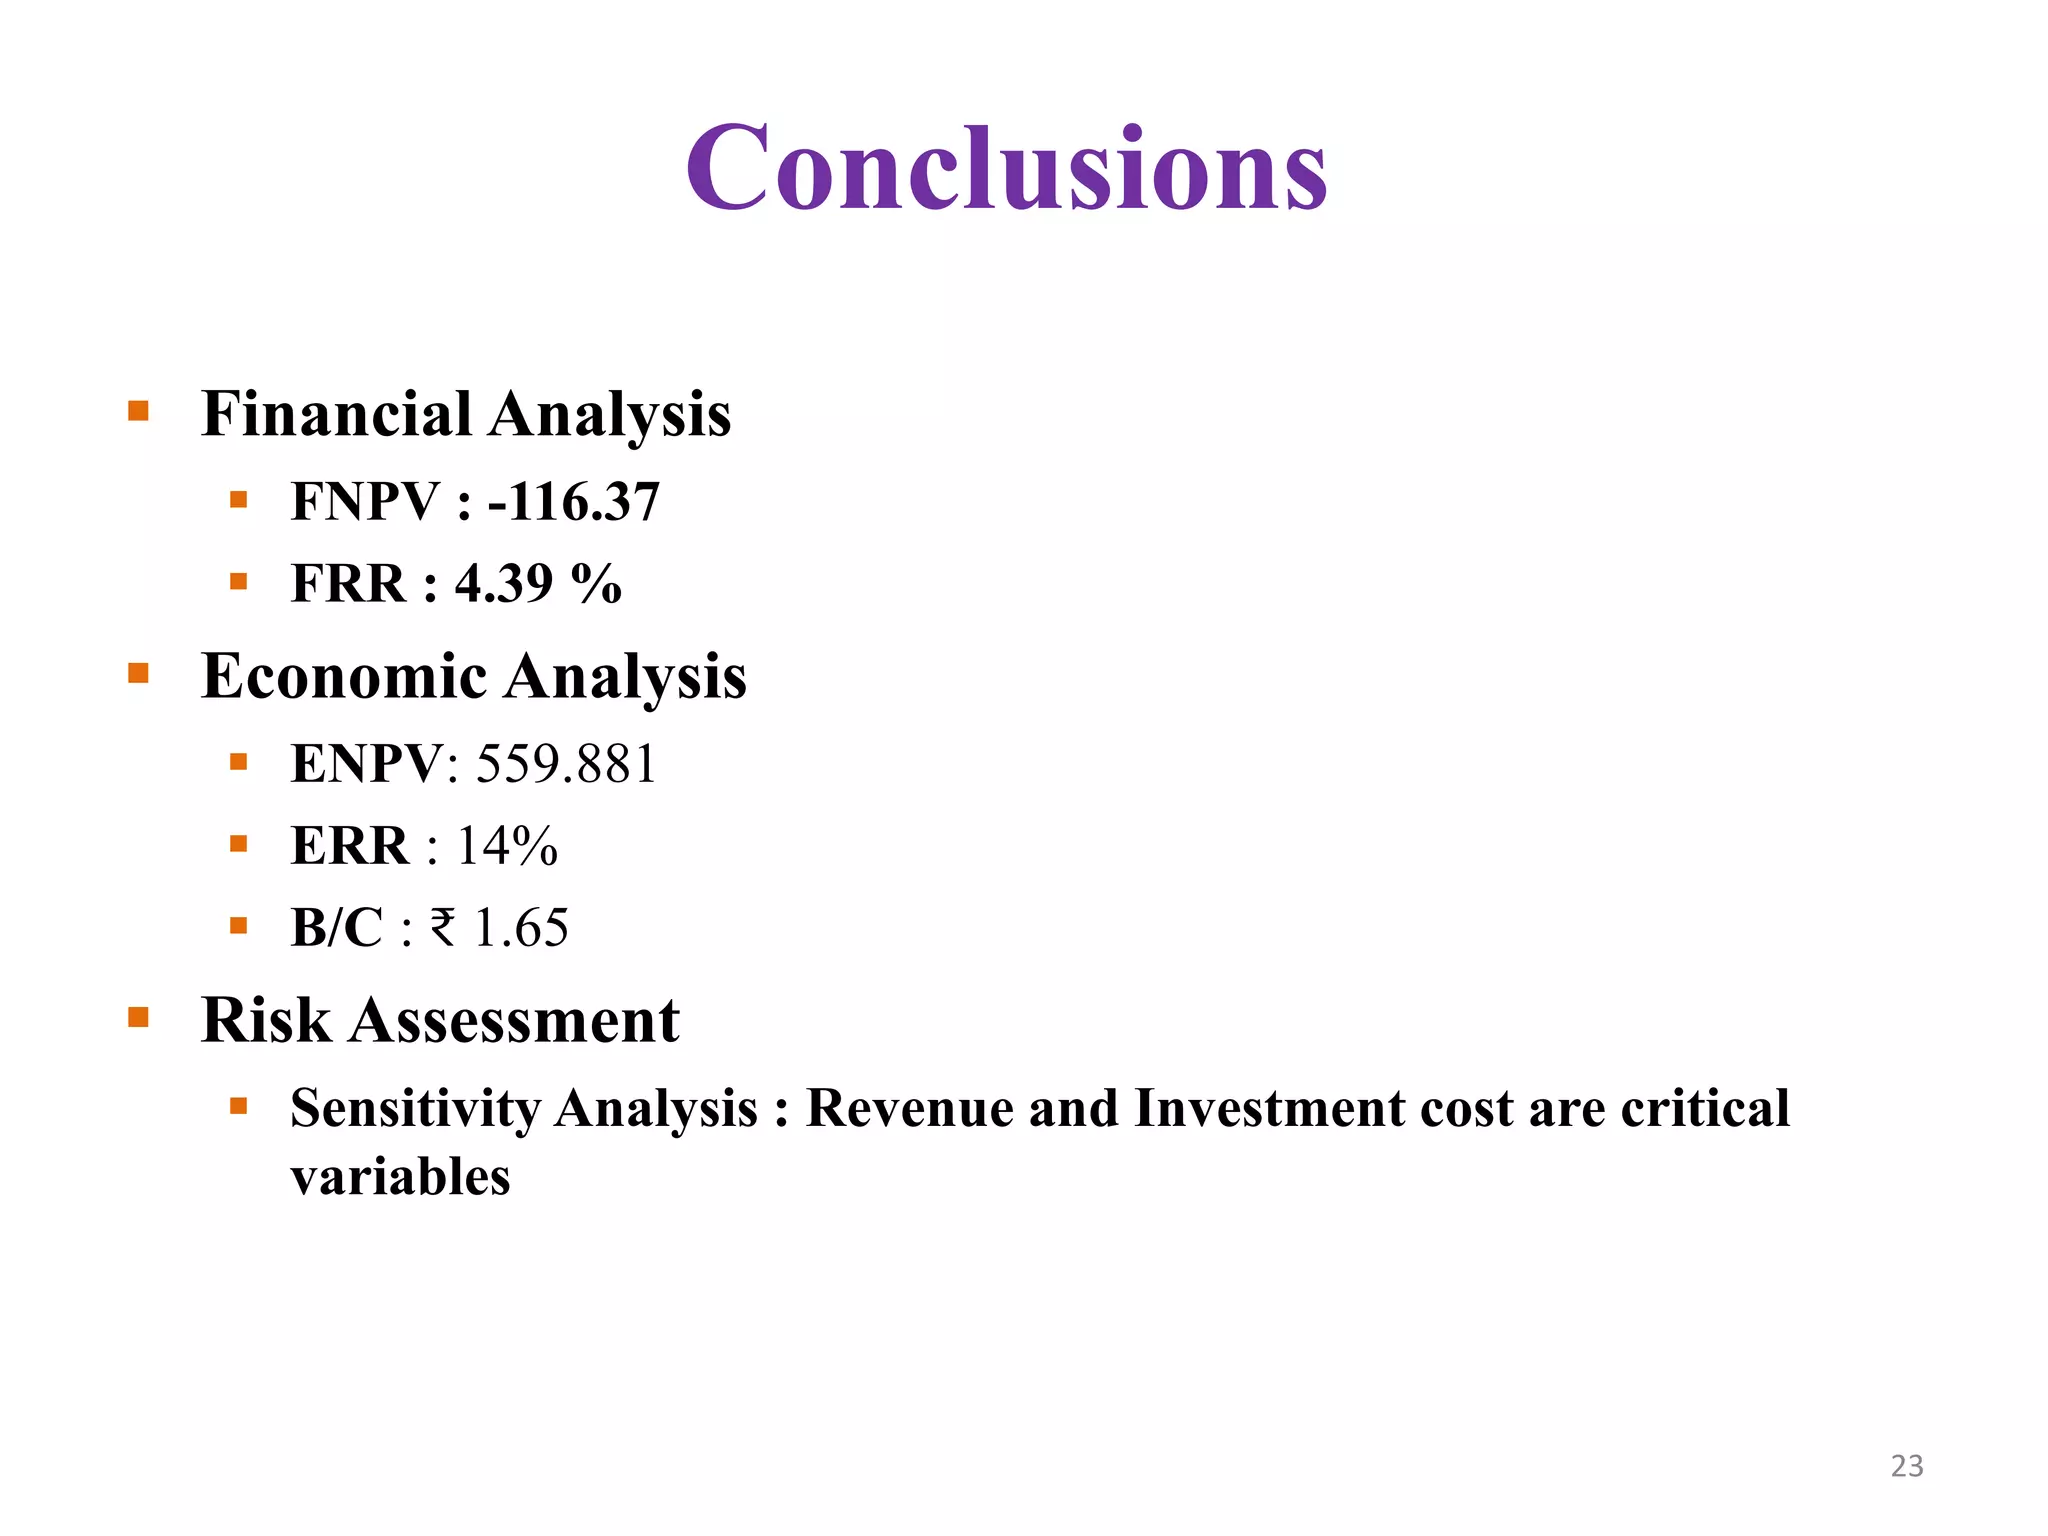


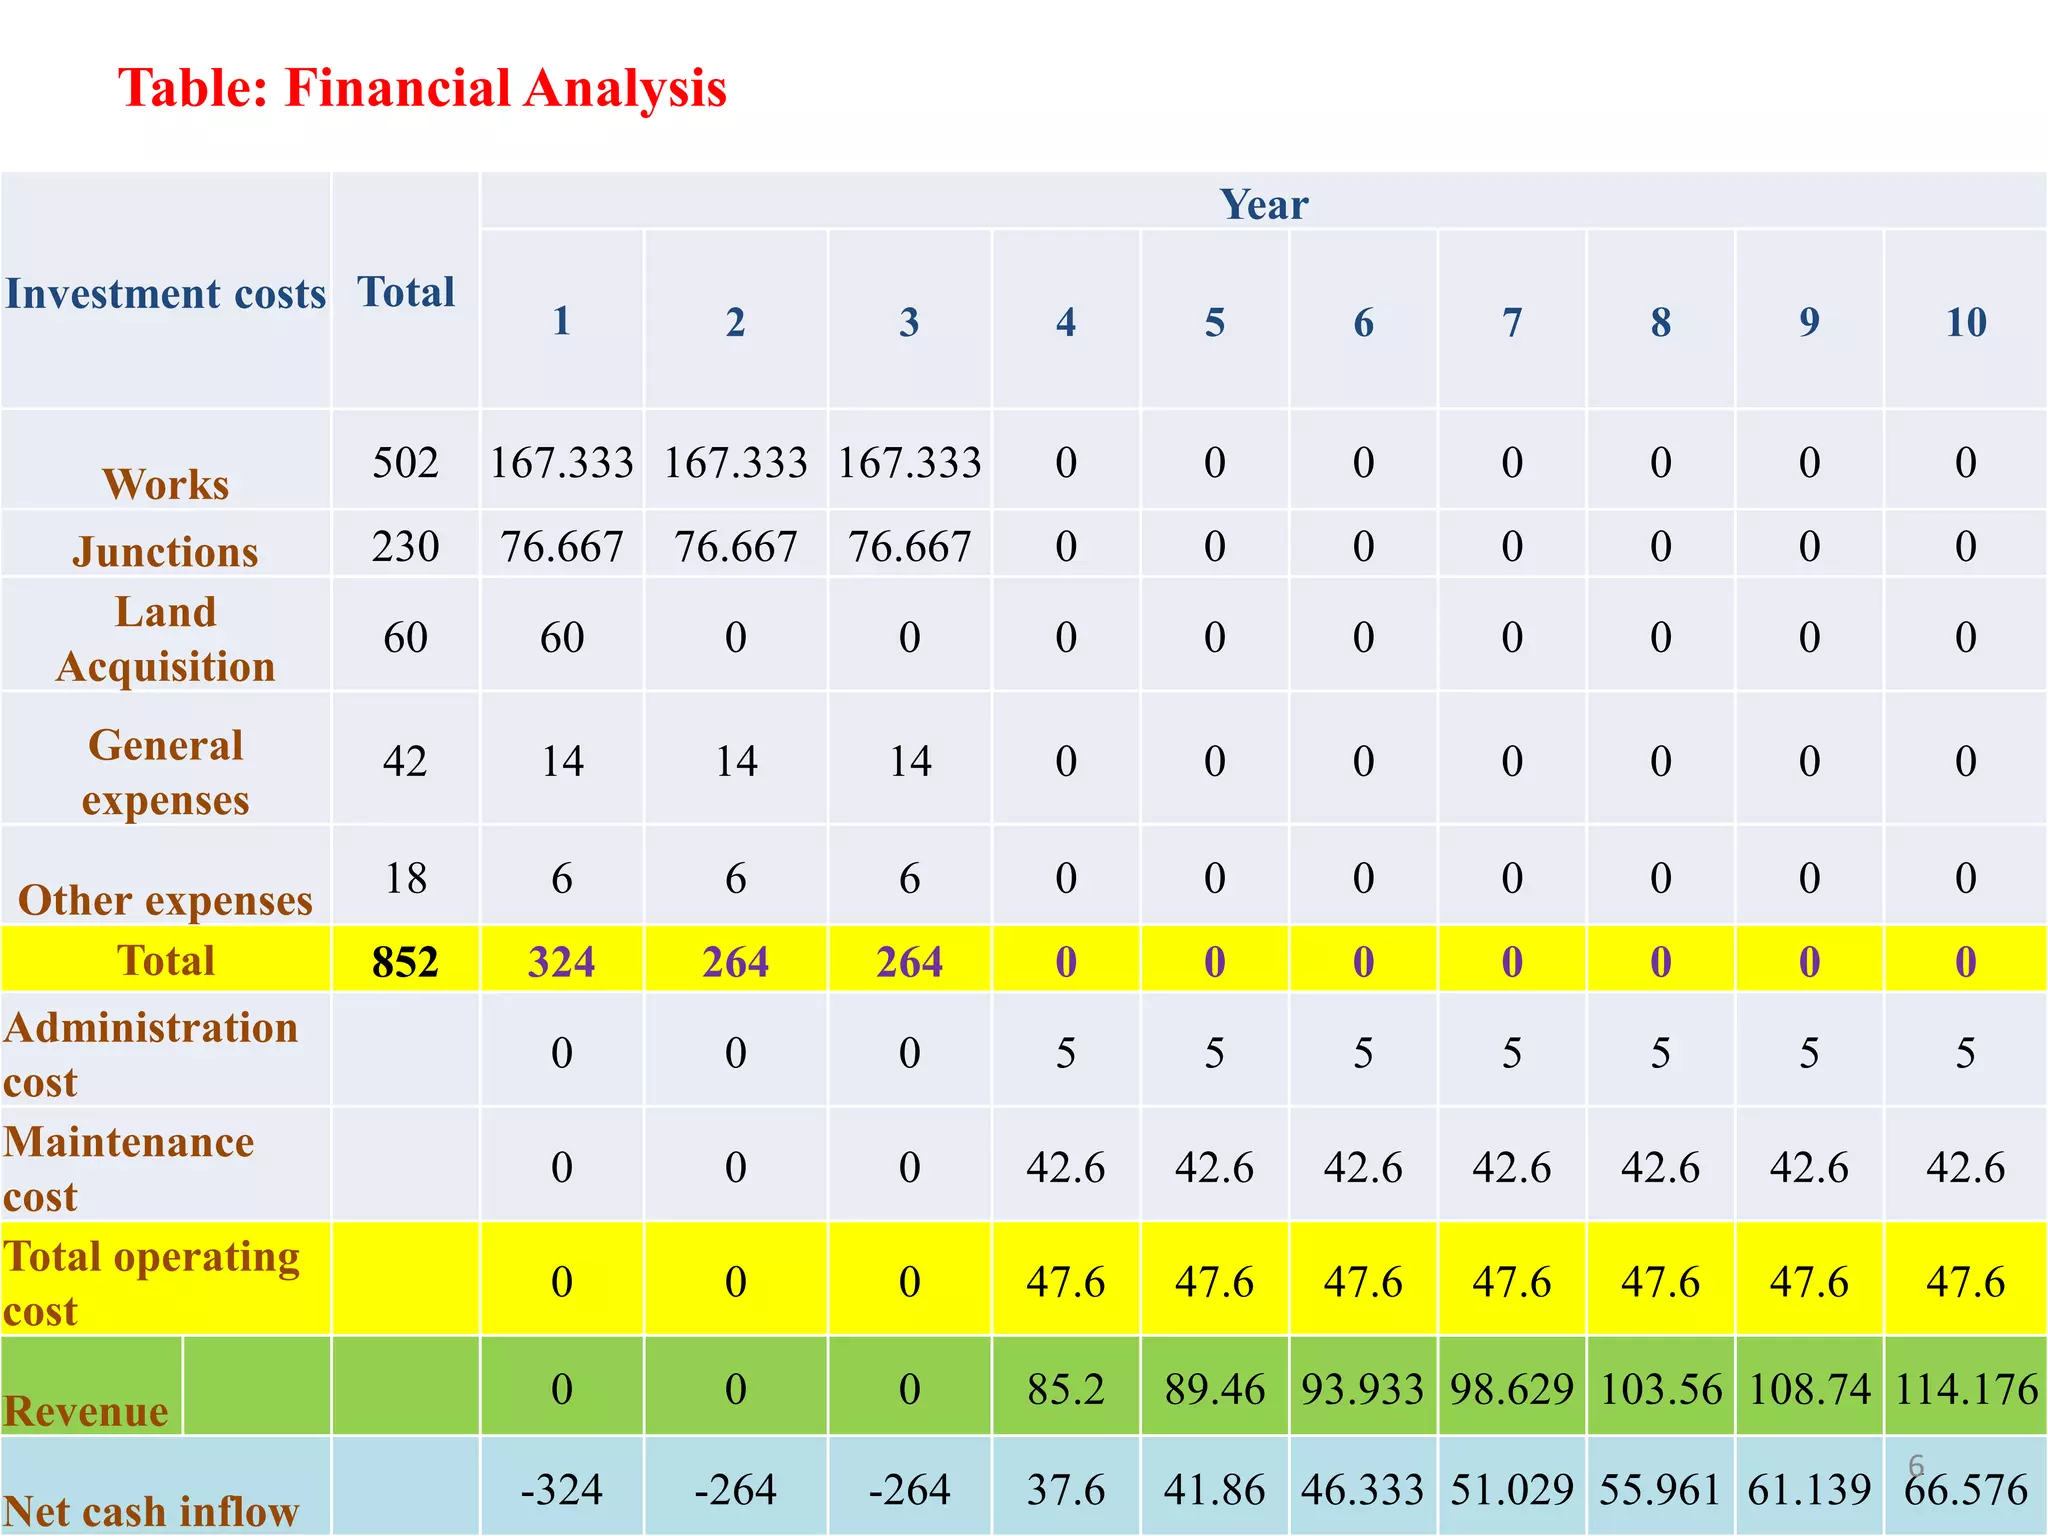
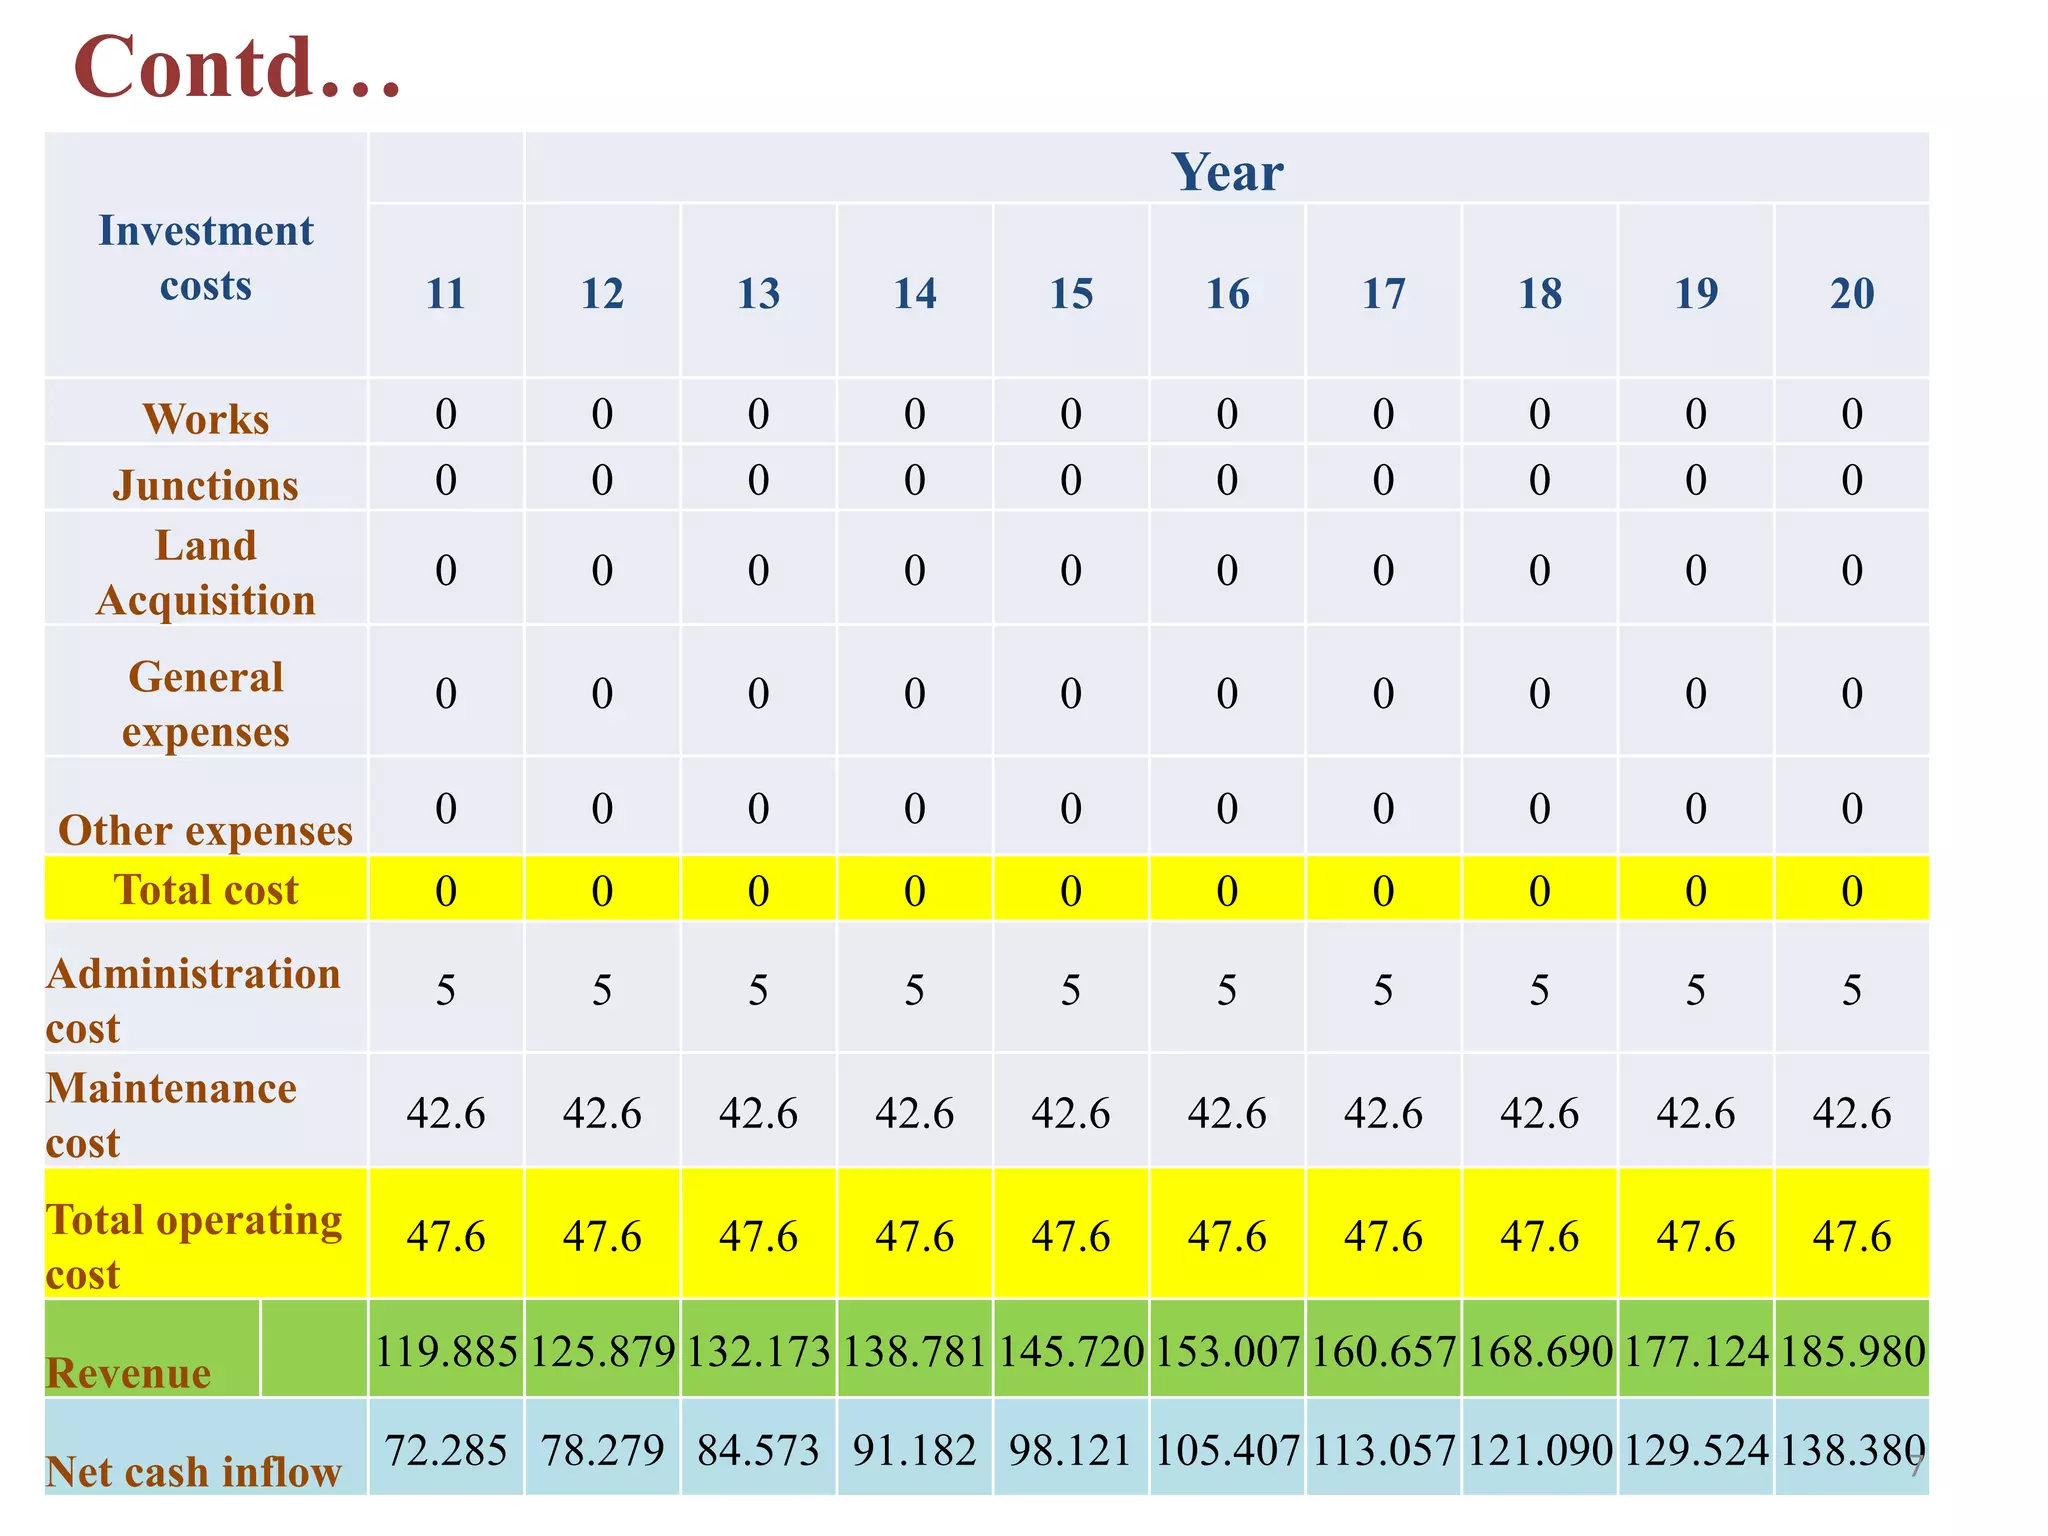
This document presents a financial analysis of a motorway project between IIT Kharagpur and Midnapore Town, spanning 72 km over 20 years. It details investment costs, operating expenses, revenues, and cash flows, projecting a positive net cash inflow by year 4 and emphasizing the importance of toll revenues for financial sustainability. Additionally, economic benefits such as time savings and accident reductions are quantified, with a focus on calculating the net present value and internal rate of return of the investment.