Download to read offline

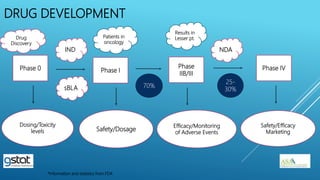
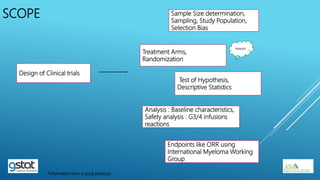
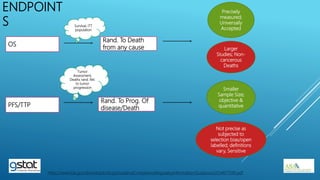
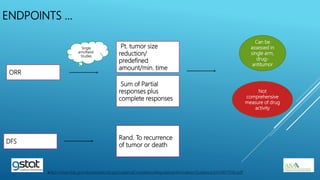
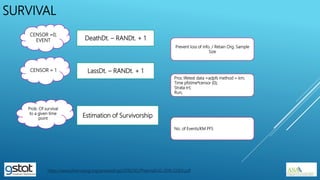
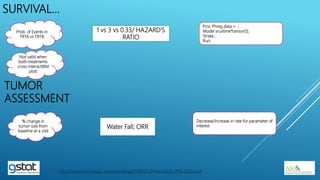


The presentation highlights the importance of biostatistics in pharmaceutical programming, covering phases of drug development, clinical trial design, sample size determination, and statistical analyses. It discusses multiple endpoints such as overall response rate (ORR) and progression-free survival (PFS), alongside methods for hypothesis testing and survival estimation. The content is based on the presenter's expertise and various literature sources, aiming to enhance understanding in biostatistics for drug discovery and development.