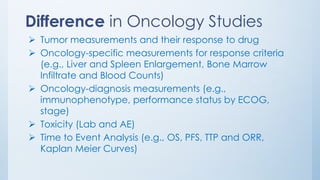
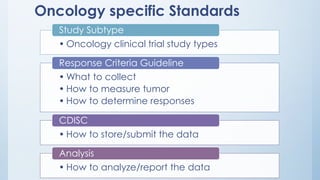
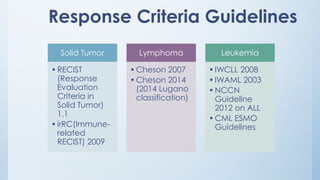
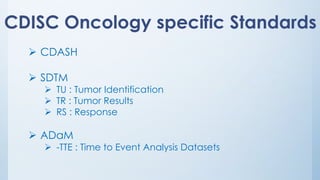
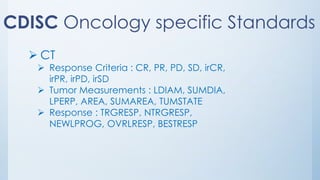
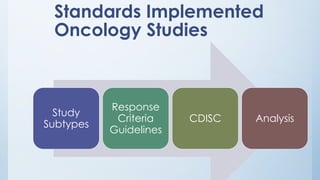
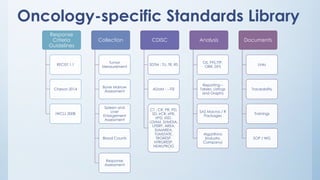
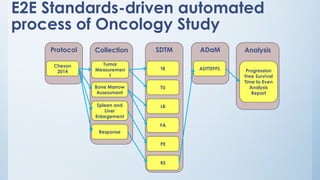
Each therapeutic area has its own unique data collection and analysis. Oncology especially, has particularly specific standards for collection and analysis of data. Oncology studies are also separated into one of three different sub types according to response criteria guidelines. The first sub type, Solid Tumor study, usually follows RECIST (Response Evaluation Criteria in Solid Tumor). The second sub type, Lymphoma study, usually follows Cheson. Lastly, Leukemia study follows study specific guidelines (IWCLL for Chronic Lymphocytic Leukemia, IWAML for Acute Myeloid Leukemia, NCCN Guidelines for Acute Lymphoblastic Leukemia and ESMO clinical practice guides for Chronic Myeloid Leukemia).
This paper will demonstrate the notable level of sophistication implemented in CDISC standards, mainly driven by the differentiation across different response criteria. The paper will specifically show what SDTM domains are used to collect the different data points in each type. For example, Solid tumor studies collect tumor results in TR and TU and response in RS. Lymphoma studies collect not only tumor results and response, but also bone marrow assessment in LB and FA, and spleen and liver enlargement in PE. Leukemia studies collect blood counts (i.e., lymphocytes, neutrophils, hemoglobin and platelet count) in LB and genetic mutation as well as what are collected in Lymphoma studies. The paper will also introduce oncology terminologies (e.g., CR, PR, SD, PD, NE) and oncology-specific ADaM data sets - Time to Event (--TTE) data set.
Finally, the paper will show how standards (e.g., response criteria guidelines and CDISC) will streamline clinical trial artefacts development in oncology studies and how end to end clinical trial artefacts development can be accomplished through this standards-driven process.
CDISC journey in Leukemia studies using IWCLL 2008Kevin Lee
The presentation is intended for those who are working on the oncology leukemia clinical trial studies. There are four types of leukemia studies : Acute Lymphoblastic Leukemia(ALL), Acute Myeloid Leukemia (AML), Chronic Lymphocytic Leukemia (CLL),Chronic Myeloid Leukemia (CML). The presentation is based on CLL.
The presentation will provide the brief introduction of International Workshop on Chronic Lymphocytic Leukemia (IWCLL) 2008 such as tumors measurement (enlarged lymph node), bone marrow assessment, liver and spleen enlargement assessment and blood counts (B-Lymphocytes, Neutrophils, Platelets, Hemoglobin) . The presentation will explains how each assessment based on IWCLL 2008 is made to determine responses (Complete Response, Partial Response, Stable Disease and Progression Disease).
Then, the presentation will show how tumor data are streamlined in CDISC – mainly in SDTM and ADaM. The paper will introduce the new oncology SDTM domains - TU (Tumor Identification), TR (Tumor Results) and RS (Response) and oncology ADaM dataset – Time to Event (--TTE). The presentation will show how IWCLL 2008 data points are collected in SDTM domain - tumor measurements in TR and TU, bone marrow in LB and FA, spleen and liver assessments in PE and FA, blood counts in LB and responses in RS. The presentation will also show how overall response rate will be derived in ADaM data set.
The presentation is intended for Clinical Trial programmers or statisticians who are working on the oncology lymphoma clinical trial studies. There are three types of studies in oncology: Solid Tumor, Lymphoma and Leukemia. The lymphoma studies usually follow Cheson while solid tumor follow RECIST (Response Evaluation Criteria in Solid Tumor) and Leukemia studies follow IWCLL(Internal Working Group on Chronic Lymphocytic Leukemia). There are two version of Cheson – 1999 and 2007. The presentation will be based on Cheson 2007.
The presentation will provide the brief introduction of Cheson 2007 such as legions (enlarged lymph node, nodal masses and extra nodal masses) and their types (target, non target and new) . The lymphoma studies need to collect the measurements of lesions (the longest diameter, its greatest transverse diameter and the sum of diameters), PET scan on those lesions, Bone Marrow assessment, Spleen and Liver assessment. Cheson 2007 explains how each assessment is made to determine responses (Complete Response, Partial Response, Stable Disease and Progression Disease).
Then, the paper will show how tumor data are streamlined in CDISC – mainly in SDTM and ADaM. The paper will introduce the new oncology SDTM domains - TU (Tumor Identification), TR (Tumor Results) and RS (Response) and oncology ADaM dataset – Time to Event (--TTE). The paper will show how Cheson 2007 data points are collected in SDTM domain - tumor measurements in TR and TU, PET scan in TR and TU, Bone Marrow in LB and FA, Spleen and Liver assessments in PE and response in RS. The paper will also show how ADaM time to event datasets can be used for oncology analysis such as OR(Overall Survival) and PFS (Progression Free Survival).
Each therapeutic area has its own unique data collection and analysis. Especially, Oncology has a unique way to collect and analyze the data. Response criteria of oncology studies dictate what to collect and analyze data. Three oncology studies follow the different guidelines standards. The Solid Tumor studies usually follow RECIST (Response Evaluation Criteria in Solid Tumor), Lymphoma studies usually follow Cheson and Leukemia studies follow study specific guidelines (IWCLL for Chronic Lymphocytic Leukemia, IWAML for Acute Myeloid Leukemia, NCCN Guidelines for Acute Lymphoblastic Leukemia and ESMO clinical practice guides for Chronic Myeloid Leukemia).
CDISC also introduced data collection, analysis and coding standards. Oncology data are collected and stored as SDTM domains - TU (Tumor Identification), TR (Tumor Results) and RS (Response). CDISC also introduces oncology terminology. For example, tumor responses are CR (Complete Response), Partial Response (PR), Stable Disease (SD), Progression Disease (PD) and Not Evaluable (NE). Oncology studies also have different efficacy end-points. CDISC introduces oncology specific ADaM data set – Time to Event (--TTE) data set for OS (Overall Survival) and PFS (Progression Free Survival).
Using response criteria and CDISC standards, oncology-specific standards will be define and integrated from protocol to analysis. These standards will also derive the automated oncology artifiact developments.
T4 Larynx cancer can be treated with ChemoradiotherapyAjeet Gandhi
Traditionally, T4 larynx cancers are recommended to undergo surgery as the primary modality of treatment. However, a select group of patients may be treated with CTRT
Author: Dr Christa Maria Joel
Module: Effects of lifestyle on health
Supervisor: Ms Jane Tobias and Dr Daniel Boakye
University of the West of Scotland
Robert P. Edwards, MD, Chair of OB/GYN/RS, Co-Director of Women's Cancer Program at University of Pittsburgh, offers information about the current state of immunotherapy for recurrent ovarian cancer patients.
Neoadjuvant Chemoradiation in Borderline resectable pancreatic adenocarcinomaDr.Bhavin Vadodariya
Comprehensive review of evidence in Neoadjuvant Chemoradiation in Borderline resectable pancreatic adenocarcinoma which includes classification of pancreatic cancer.
Two different use cases to obtain best response using recist 11 sdtm and a ...Kevin Lee
Each therapeutic area has its own unique data collection and analysis. Especially, Oncology has a unique way to collect and analyze the data and one of unique data points in oncology study is best response. The paper will be based on Solid Tumor and RECIST 1.1, and it will show use cases on how best response will be collected in SDTM domains and derived in ADaM datasets using RECIST 1.1 in solid tumor oncology study.
The paper will provide the brief introduction of RECIST 1.1 such as legions type (i.e., target, non-target and new) and their selection criteria(e.g., size and number). The paper will provide the practical application on how tumor measurements for target and non-target lesions are collected in TR domain, how those measurement are assessed according to RECIST 1.1, and eventually how responses are represented in RS domain based on the assessment from tumor measurements.
We will also put in prospective a pictorial road map on which way we choose to derive responses to give a prospective to the user and the process to get from beginning to end objective. This paper will also discuss a use case where the visit level response are been derived programmatically in ADaM and perform a sensitive analysis in comparison to investigator provides visit level response to SDTM RS domain. This case study will help user identify the differences between both the methodologies and help answer any anomalies from investigator inference prospective vs analytical calculations by the programmer.
Presentation by David J. Eschelman, MD, FSIR. Presented at the 2018 Eyes on a Cure: Patient & Caregiver Symposium, hosted by the Melanoma Research Foundation's CURE OM initiative.
Overview of radiology basics, scan types and pros and cons of each, presented by David J. Eschelman, MD, FSIR, Professor of Radiology, Sidney Kimmel Medical College of Thomas Jefferson University, Co-Director of Interventional Radiology, Thomas Jefferson University Hospital.
Esophageal cancer practical target delineation 2013 mayYong Chan Ahn
General Principles and Practical Points in Target Delineation: Esophageal Cancer
--- Presented at Spring Annual Meeting of Korean Society of Radiation Oncology (Jeju, Korea)
Immunotherapy for Metastatic Triple Negative Breast Cancerbkling
Sylvia Adams, MD, medical oncologist, and associate professor at the NYU School of Medicine, discusses the latest research including the role of immunology in the treatment of triple negative metastatic breast cancer. This webinar was hosted on October 19, 2016.
Practical considerations in soft tissue sarcoma 3Sameer Rastogi
It deals with contemporary issues with the management of soft tissue sarcomas. It deals with almost every aspect of soft tissue sarcoma including radiology, pathology, treatment, follow up etc.
Prognosis of Invasive Micropapillary Carcinoma of the Breast Analyzed by Usin...JohnJulie1
Invasive micropapillary carcinoma (IMPC) is a rare type of breast cancer with high frequency of regional lymph node metastasis. However, the prognosis of IMPC has remained controversial for decades. We aimed to compare the differences of prognosis between IMPC and Invasive ductal carcinoma(IDC) of the breast by utilizing Surveillance, Epidemiology, and End Results (SEER) database.
Prognosis of Invasive Micropapillary Carcinoma of the Breast Analyzed by Usin...NainaAnon
Invasive micropapillary carcinoma (IMPC) is a rare type of breast cancer with high frequency of regional lymph node metastasis. However, the prognosis of IMPC has remained controversial for decades. We aimed to compare the differences of prognosis between IMPC and Invasive ductal carcinoma(IDC) of the breast by utilizing Surveillance, Epidemiology, and End Results (SEER) database.
Similar to End to end standards driven oncology study (solid tumor, Immunotherapy, Leukemia, Lymphoma) (20)
Patient’s Journey using Real World Data and its Advanced AnalyticsKevin Lee
Real World Data (RWD) is data collected outside of clinical trial study, and Real-World Evidence (RWE) could be achieved through the insight from RWD. RWD sources come from EMR, health insurance claims, genomic data, and IoT from apps and wearables. RWD anonymized patient data has revolutionized how companies view patient data since it captures longitudinal pharmacy prescription, medical claims, and diagnosis.
The paper is written for those who want to understand how RWD patient data are collected and how they could be analyzed to support pharmaceutical companies. Mainly, RWD patient data could support patient analytics, commercial analytics, and payer analytics such as source of business, switch of prescription, payment method, market analysis, promotional activities, drug launch and forecasting. The paper also discusses the technology that data scientists use for RWD such as Data Warehouse, Data Visualization, Opensource Programming, Cloud Computing, GitHub, and Machine Learning.
Introduction of AWS Cloud Computing and its future for Biometric DepartmentKevin Lee
When statistical programmers or statisticians starts in open-source programming, we usually begin with installing Python and/or R on our local computer and writing codes in a local IDE such as Jupyter notebook or RStudio, but as biometric team grow, and advanced analytics become more prevalent, collaborative solutions and environments are needed. Traditional solutions have been SAS® servers, but nowadays, there is a growing need and interest for Cloud Computing. The paper is written for those who want to know about the Cloud Computing environment (e.g., AWS) and its possible implementation for the Biometric Department.
The paper will start with the main components of Cloud computing – databases, servers, applications, data analytics, reports, visualization, dashboards etc., and its benefits - Elasticity, Control, Flexibility, Integration, Reliability, Security, Inexpensive and Easy to Start. Most popular Cloud computing platforms are AWS, Google Cloud and Microsoft Azure, and this paper will introduce AWS Cloud Computing Environment.
The paper will also introduce the core technologies of AWS Cloud Computing – computing (EC2), Storage ( EBS, EFS, S3), Database ( Redshift, RDS, DynamoDB ), Security (IAM) and Networking (VPC ), and how they could be integrated to support modern-day data analytics.
Finally, the paper will introduce the department-driven Cloud computing transition project that the whole SAS programming department has moved from SAS Window Server into AWS Cloud Computing. It will also discuss the challenges, and the lessons learn and its future in the Biometric department
A fear of missing out and a fear of messing up : A Strategic Roadmap for Chat...Kevin Lee
Does your organization allow ChatGPT at work? The answer might depend on where you work. Many organizations do not allow ChatGPT at work. The truth is that for the organizations, ChatGPT is a fear of missing out and a fear of messing up. But, just like any other past new technologies such as Cloud computing and social media, the organizations eventually integrate ChatGPT or other Large Language Model (LLM). This paper is for those especially Biometrics who want to initiate ChatGPT integration at work.
This paper presents how Biometric department can lead the integration of LLM, focusing on the exemplary model ChatGPT, across an entire enterprise, even in situations where the organization restricts or prohibits ChatGPT usage at work.
The roadmap outlines key stages, starting with an introduction to LLM and ChatGPT, followed by potential risks and concerns and the benefits and diverse use cases. The roadmap will emphasize how Biometrics function leads the building of a cross-functional team to initiate ChatGPT integration and build the policy and guidelines. Then, the roadmap discusses the crucial aspect of training, emphasizing user education and engagement based on company polices. The roadmap finishes with a Proof of Concept (PoC) to validate and evaluate the ChatGPT’s applicability to organizational needs and its compliance to company policies.
This paper can serve as a valuable resource navigating the implementation journey of ChatGPT, providing insights and strategies for successful integration, even within the confines of organizational limitations on ChatGPT usage.
Prompt it, not Google it - Prompt Engineering for Data ScientistsKevin Lee
Since its release, ChatGPT has rapidly gained popularity, reaching 100 million users within 2 months. Even a new concept has emerged : “Prompt it” is now the new “Google it”. Research shows ChatGPT users complete projects 25% faster. The paper is written for Statistical Programmers and Biostatisticians who want to improve their productivity and efficiency by using ChatGPT prompts better.
The paper explores the pivotal role of prompts in enhancing the performance and versatility of ChatGPT or other Large Language Model. The paper shows how Statistical Programmers and Biostatistician utilize ChatGPT's capabilities and benefits such as the content development (e.g., emails, images), search for the information, Programming assistance in R, SAS and Python, Result Interpretation and many more.
The paper also elucidates the distinctive advantages of employing prompts over traditional search methods. It emphasizes the unique characteristics of prompt engineering in ChatGPT. Various techniques, such as zero-shot learning, few-shot learning, reflection, chain of thought, and tree of thought, are dissected to illustrate the nuanced ways in which prompts can be engineered to optimize outcomes. The comprehensive exploration also offers insights into how to prompt better by adding constraints, incorporating more contexts, setting roles, coaching with feedback, probing further, and introducing step-by-step instructions to ChatGPT. The paper discusses ChatGPT's functionality in modifying and resubmitting the prompt, copying the answer, regenerating the answer, and continuing the previous prompt.
The paper highlights how Stat programmers and Biostatisticians use and lead the transformative impact of prompts to be more productive and effective.
Leading into the Unknown? Yes, we need Change Management LeadershipKevin Lee
The paper is written for those who want to lead the new changes in biometric department. Currently, the biometric department is going through Big Changes from traditional SAS ® programming to open-source programming, cloud computing, data science or even Machine Learning, and how to manage and lead those changes becomes critical for the leaders so that changes could be achieved under budget and on schedule.
Change Management is the activities/processes that support the success of changes in the organization and is considered as a leadership competency for enabling changes within the organization. More importantly, the success rate of the changes directly correlates with change management by the leaders. Leaders with excellent change management is six times more likely to succeed than ones with poor change management.
The paper will discuss major obstacles that leaders will face such as programmer/middle management resistance, insufficient support. And it will also discuss about success factors that leaders could implement in change management such as detailed planning, dedicated resources and funds, experiences in change, participation of programmers, frequent transparent communication, and clear goals.
Finally, the paper will show the examples of how change management effectively lead the success of Open-Source Programming Migration from SAS ® for the department of more than 150 SAS programmers.
How to create SDTM DM.xpt using Python v1.1Kevin Lee
The paper is written for those who wants to use Python to create SDTM SAS transport files from Raw SAS datasets. The paper will
show the similarity and differences between SAS and Python in terms of SDTM dataset development, and actual Python codes to
create SDTM SAS transport file.
The paper will start with Python packages that could read and write SAS datasets such as xport, sas7bdat, and pyreadstat. The
paper will introduce how Python reads SAS datasets from the local drive such as demographic, exposure, randomization and
disposition raw SAS datasets. The paper will also show how Python creates variables from raw data such as SEX, USUBJID, RACE,
RFSTDTC, and RFENDTC. The paper will also show how Python merge datasets using outer and inner join. The paper will also show
how programmers use Python Dataframe for data manipulation such as renaming, dropping, and replacing variables. Finally, the
paper will show how Python could create SAS SDTM transport file in the local drive.
The paper also includes the actual python codes that read Raw SAS datasets, merge, manipulate and write SDTM DM SAS xport
file.
Enterprise-level Transition from SAS to Open-source Programming for the whole...Kevin Lee
The paper is written for those who wants to learn the enterprise-level transition from SAS to open-source programming. The paper will introduce the transition project that the whole department of 150+ SAS programmers has completely moved from SAS to Open-source programming.
The paper will start with the scopes of the project – Analytic platform switch from SAS Studio to R Pro Server, converting the existing SAS codes to R/Python codes, Window server to AWS Cloud computing environment, and the transition of SAS programmers to R/Python programmers. It will also discuss the challenges of the project such as inexperience in Open-source Programming, new analytic platform, and change management. The paper will introduce how the transition-support team, executive leadership and SAS programmers have overcome the challenges together during the project.
The paper will also discuss the difference in SAS and Open-source language and programming, and it will show some examples of the conversion of SAS codes to R/Python codes. Finally, it will close with the benefits of the Open-source programming transition and the lessons learned from the project.
One of the most popular buzz words nowadays in the technology world is “Machine Learning (ML).” Most economists and business experts foresee Machine Learning changing every aspect of our lives in the next 10 years through automating and optimizing processes. This is leading many organizations to seek experts who can implement Machine Learning into their businesses.
The paper will be written for statistical programmers who want to explore Machine Learning career, add Machine Learning skills to their experiences or enter a Machine Learning fields. The paper will discuss about personal journey to become to a Machine Learning Engineer from a statistical programmer. The paper will share my personal experience on what motivated me to start Machine Learning career, how I started it, and what I have learned and done to be a Machine Learning Engineer. In addition, the paper will also discuss the future of Machine Learning in Pharmaceutical Industry, especially in Biometric department.
Artificial Intelligence in Pharmaceutical IndustryKevin Lee
This presentation will show the introduction of AI and its possible implementation in Pharmaceutical Industry such as drug discovery, personalized medicine, molecular target prediction, site selection, patient recruitment, process automation, process optimization and more.
The Jupyter Notebook is an open-source web application that allows programmers and data scientists to create and share documents that contain live code, visualizations and narrative text. Jupyter Notebook is one of most popular tool for data visualization and machine learning, and it is the perfect tool for story telling tool for data scientist.
First, the paper will start with the introduction of Jupyter Notebook and why it is the most popular tool for data scientist to show, share and visualize the data and analysis. The paper will show how data scientist uses Python programming language in Jupyter Notebook. The paper will show how data scientists import data into Jupyter Notebook using Panda. The paper will introduce Python data visualization library, matplotlib, and show how data scientists use matplotlib to easily create scatter plot, line, histograms, Kaplan Meier curves and many more.
The paper will present how data scientist use Jupyter notebook for image recognitions with visualization and machine learning. The paper will show how data scientists can convert images into numeric array. Then, the paper will show how data scientist can use this numeric data to visualize and train machine learning model for image recognition.
Perfect partnership - machine learning and CDISC standard dataKevin Lee
The most popular buzz word nowadays in the technology world is “Machine Learning (ML).” Most economists and business experts foresee Machine Learning changing every aspect of our lives in the next 10 years through automating and optimizing processes. This is leading many organizations including drug companies to implement Machine Learning into their businesses.
The presentation will start with the introduction of basic concept of Machine Learning, the computer science technology that provides systems with the ability to learn without being explicitly programmed, and it will discuss what it means by “without being explicitly programmed”. The presentation will also introduce basic ML algorithm -SVM, Decision Tress, Regression, Artificial Neural Network (ANN), and DNN. The presentation will also discuss the impact and potential of Machine Learning in our daily lives and pharmaceutical industry.
The presentation will show how CDISC data can be a perfect match on Machine Learning implementation. In this Machine Learning/AI driven process, data is considered as the most important component. 80 to 90 % of works in Machine Learning is preparing data. Since FDA mandated CDISC standards submission as of Dec 17th, 2016, all the clinical trial data are prepared in CDISC SDTM and ADaM data format. The presentation will show how CDISC data is better choice than Real World Evidence (RWE) data for ML model. The presentation will also show how pharmaceutical industry use CDISC data to build ML model and apply ML model for Real World evidence. Finally, the presentation will show how Pharma industry can use their own in-house data and Machine Learning to build innovative, data-driven business models.
Machine Learning : why we should know and how it worksKevin Lee
The most popular buzz word nowadays in the technology world is “Machine Learning (ML).” Most economists and business experts foresee Machine Learning changing every aspect of our lives in the next 10 years through automating and optimizing processes such as: self-driving vehicles; online recommendation on Netflix and Amazon; fraud detection in banks; image and video recognition; natural language processing; question answering machines (e.g., IBM Watson); and many more. This is leading many organizations to seek experts who can implement Machine Learning into their businesses.
Statistical programmers and statisticians in the pharmaceutical industry are in very interesting positions. We have very similar backgrounds as Machine Learning experts, such as programming, statistics, and data expertise, thus embodying the essential technical skill sets needed. This similarity leads many individuals to ask us about Machine Learning. If you are the leaders of biometric groups, you get asked more often.
The paper is intended for statistical programmers and statisticians who are interested in learning and applying Machine Learning to lead innovation in the pharmaceutical industry. The paper will start with the introduction of basic concepts of Machine Learning - hypothesis and cost function and gradient descent. Then, paper will introduce Supervised ML (e.g., Support Vector Machine, Decision Trees, Logistic Regression), Unsupervised ML (e.g., clustering) and the most powerful ML algorithm, Artificial Neural Network (ANN). The paper will also introduce some of popular SAS ® ML procedures and SAS Visual Data Mining and Machine Learning. Finally, the paper will discuss the current ML implementation, its future implementation and how programmers and statisticians could lead this exciting and disruptive technology in pharmaceutical industry.
We are living in the world of “Big Data”. “Big Data” is mainly expressed with three Vs – Volume, Velocity and Variety. The presentation will discuss how Big Data impacts us and how SAS programmers can use SAS skills in Big Data environment
The presentation will introduce Big Data Storage solution – Hadoop and NoSQL. In Hadoop, the presentation will discuss two major Hadoop capabilities - Hadoop Distributed File System (HDFS) and Map/Reduce (parallel computing in Hadoop). The presentation will show how SAS can work with Hadoop using HDFS LIBNAME, FILENAME, SAS/ACCESS to Hadoop HIVE and SAS GRID Managers to Hadoop YARN. The presentation will also introduce the concepts of NoSQL database for a big data solution.
The presentation will also introduce how SAS can work with the variety of data format, especially XML and JSON. The presentation will show the use case of converting XML documents to SAS datasets using LIBNAME XMLV2 XMLMAP statement. The presentation will also introduce REST API to extract data through internets and will demonstrate how SAS PROC HTTP can move the data through REST API.
We are living in the world of “Big Data”. “Big Data” is mainly expressed with three Vs – Volume, Velocity and Variety. The presentation will discuss how Big Data impacts Pharmaceutical Industry and how drug companies can lead this new Big Data environment.
How FDA will reject non compliant electronic submissionKevin Lee
Beginning Dec 18, 2016, all clinical trial and nonclinical trial studies must use standards (e.g., CDISC) for submission data and beginning May 5, 2017, NDA, ANDA, and BLA submissions must follow eCTD format for submission documents.
In order to enforce these standards mandates, the FDA also released "Technical Rejection Criteria for Study Data" in FDA eCTD website on October 3, 2016. FDA also implemented a rejection process for submissions that do not conform to the required study data standards.
The paper will discuss how these new FDA mandates impact the electronic submission and the required preparation for CDISC and eCTD complaint submission package such as SDTM, ADaM, Define.xml, SDTM annotated eCRF, SDRG, ADRG and SAS® programs. The paper will introduce the current FDA submission process, including the current FDA rejection processes – “Technical Rejection” and “Refuse-to-File” and discuss how FDA uses “Technical Rejection” and “Refuse-to-File” to reject submission. The paper will show how FDA rejection of CDISC non-compliant data will impact sponsor’s submission process, and how sponsors should respond to FDA rejections as well as questions throughout the whole submission process. Use cases will demonstrate the key technical rejection criteria that will have the greatest impact on a successful submission process
Are you ready for Dec 17, 2016 - CDISC compliant data?Kevin Lee
Are you ready for Dec 17th, 2016?
According to FDA Data Standards Catalog v4.4, all clinical trial studies starting after December 17th, 2016 with the exception of certain INDs will be required to have CDISC compliant data. Organizations who are unclear on their compliance status will have their understanding of FDA expectations elucidated in the paper. The paper will show how programmers can interpret and understand the crucial elements of the FDA Data Standards Catalog, which includes support begin date, support end date, requirement begin date and requirement end date of specific standards for both eCTD and CDISC.
First, the paper will provide the brief introduction of regulatory recommendation of electronic submission, including methods, five modules in CTD especially m5, technical deficiencies in submission and etc. The paper will also discuss what programmers need to prepare for the submission according to FDA and CDISC guidelines for CSR, Protocol, SAP, SDTM annotated eCRF, SDTM datasets, ADaM datasets, ADaM datasets SAS® programs and Define.xml.
Additionally, the paper will discuss formatting logistics that programmers should be aware of in their preparation of documents, including length, naming conventions and file formats of electronic files. For examples, SAS data sets should be submitted as SAS transport file formats and SAS programs should be submitted as text format, rather than SAS format.
Finally, based on information from FDA CSS meeting and FDA Study Data Technical Conformance guides v 3.0, the paper will discuss the latest FDA concerns and issues on electronic submission. This will include the size of SAS data sets, lack of Trial Design dataset(TS) and Define.xml, importance of Reviewer Guide and etc.
We are living in the world of abundant data, so called “big data”. The term “big data” is closely associated with unstructured data. They are called “unstructured” or NoSQL data because they do not fit neatly in a traditional row-column relational database. A NoSQL (Not only SQL or Non-relational SQL) database is the type of database that can handle unstructured data. For example, a NoSQL database can store unstructured data such as XML (Extensible Markup Language), JSON (JavaScript Object Notation) or RDF (Resource Description Framework) files.
If an enterprise is able to extract unstructured data from NoSQL databases and transfer it to the SAS environment for analysis, this will produce tremendous value, especially from a big data solutions standpoint. This paper will show how unstructured data is stored in the NoSQL databases and ways to transfer it to the SAS environment for analysis. First, the paper will introduce the NoSQL database. For example, NoSQL databases can store unstructured data such as XML, JSON or RDF files. Secondly, the paper will show how the SAS system connects to NoSQL databases using REST (Representational State Transfer) API (Application Programming Interface). For example, SAS programmers can use the PROC HTTP option to extract XML or JSON files through REST API from the NoSQL database. Finally, the paper will show how SAS programmers can convert XML and JSON files to SAS datasets for analysis. For example, SAS programmers can create XMLMap files using XMLV2 LIBNAME engine and convert the extracted XML files to SAS datasets.
Introduction of semantic technology for SAS programmersKevin Lee
There is a new technology to express and search the data that can provide more meaning and relationship –
semantic technology. The semantic technology can easily add, change and implement the meaning and relationship
to the current data. Companies such as Facebook and Google are currently using the semantic technology. For
example, Facebook Graph Search use semantic technology to enhance more meaningful search for users.
The paper will introduce the basic concepts of semantic technology and its graph data model, Resource Description
Framework (RDF). RDF can link data elements in a self-describing way with elements and property: subject,
predicate and object. The paper will introduce the application and examples of RDF elements. The paper will also
introduce three different representation of RDF: RDF/XML representation, turtle representation and N-triple
representation.
The paper will also introduce “CDISC standards RDF representation, Reference and Review Guide” published by
CDISC and PhUSE CSS. The paper will discuss RDF representation, reference and review guide and show how
CDISC standards are represented and displayed in RDF format.
The paper will also introduce Simple Protocol RDF Query Language (SPARQL) that can retrieve and manipulate data
in RDF format. The paper will show how programmers can use SPARQL to re-represent RDF format of CDISC
standards metadata into structured tabular format.
Finally, paper will discuss the benefits and futures of semantic technology. The paper will also discuss what semantic
technology means to SAS programmers and how programmers take an advantage of this new technology.
Over the past decade, CDISC Standards have been widely accepted and implemented in clinical research. The FDA’s final “Guidance for Industry on electronic submission” mandates that submission data conform to CDISC standards such as SDTM, ADaM and SEND. This presentation will discuss how life sciences organizations can use Standards metadata to manage the regulatory compliance process. It will introduce how standards metadata management not only ensures regulatory compliance, but also supports process efficiency in clinical trial artefacts (e.g., protocol, CDASH, SDMT and ADaM) development and standards governance, and enables efficient communication between organizational units.
It will also introduce metadata management system and discuss how metadata management system will create, store, govern and manage standards. It will also show how standards metadata management system interacts with ETL system and dictates standards-driven clinical artefacts development.
Data centric SDLC for automated clinical data developmentKevin Lee
Many life science organizations have been building systems to automate clinical data development (e.g., SDTM and ADaM). And such systems are considered as IT product and goes through typical system development life cycle (SDLC); requirements, analysis, design, programming, test and implementation. However, SDLC was initially developed for systems that automate the business process, not the data development. So, the question naturally arises that if life science organizations develop systems to automate data development, should the systems still be developed in process-centric SDLC? or will the current process-centric SDLC satisfy the business need? The presentation will introduce data-centric SDLC. First, the presentation will discuss how some steps of typical process-centric SDLC should be modified and adjusted in data-centric SDLC. For example, test of system requires target data quality assurance. And due to unpredictability of source data, maintenance and system update will be required after implementation. Secondly, the presentation will introduce additional steps and approaches for data-centric system development process such as data profiling and compliance.
R3 Stem Cells and Kidney Repair A New Horizon in Nephrology.pptxR3 Stem Cell
R3 Stem Cells and Kidney Repair: A New Horizon in Nephrology" explores groundbreaking advancements in the use of R3 stem cells for kidney disease treatment. This insightful piece delves into the potential of these cells to regenerate damaged kidney tissue, offering new hope for patients and reshaping the future of nephrology.
Welcome to Secret Tantric, London’s finest VIP Massage agency. Since we first opened our doors, we have provided the ultimate erotic massage experience to innumerable clients, each one searching for the very best sensual massage in London. We come by this reputation honestly with a dynamic team of the city’s most beautiful masseuses.
How many patients does case series should have In comparison to case reports.pdfpubrica101
Pubrica’s team of researchers and writers create scientific and medical research articles, which may be important resources for authors and practitioners. Pubrica medical writers assist you in creating and revising the introduction by alerting the reader to gaps in the chosen study subject. Our professionals understand the order in which the hypothesis topic is followed by the broad subject, the issue, and the backdrop.
https://pubrica.com/academy/case-study-or-series/how-many-patients-does-case-series-should-have-in-comparison-to-case-reports/
India Clinical Trials Market: Industry Size and Growth Trends [2030] Analyzed...Kumar Satyam
According to TechSci Research report, "India Clinical Trials Market- By Region, Competition, Forecast & Opportunities, 2030F," the India Clinical Trials Market was valued at USD 2.05 billion in 2024 and is projected to grow at a compound annual growth rate (CAGR) of 8.64% through 2030. The market is driven by a variety of factors, making India an attractive destination for pharmaceutical companies and researchers. India's vast and diverse patient population, cost-effective operational environment, and a large pool of skilled medical professionals contribute significantly to the market's growth. Additionally, increasing government support in streamlining regulations and the growing prevalence of lifestyle diseases further propel the clinical trials market.
Growing Prevalence of Lifestyle Diseases
The rising incidence of lifestyle diseases such as diabetes, cardiovascular diseases, and cancer is a major trend driving the clinical trials market in India. These conditions necessitate the development and testing of new treatment methods, creating a robust demand for clinical trials. The increasing burden of these diseases highlights the need for innovative therapies and underscores the importance of India as a key player in global clinical research.
Medical Technology Tackles New Health Care Demand - Research Report - March 2...pchutichetpong
M Capital Group (“MCG”) predicts that with, against, despite, and even without the global pandemic, the medical technology (MedTech) industry shows signs of continuous healthy growth, driven by smaller, faster, and cheaper devices, growing demand for home-based applications, technological innovation, strategic acquisitions, investments, and SPAC listings. MCG predicts that this should reflects itself in annual growth of over 6%, well beyond 2028.
According to Chris Mouchabhani, Managing Partner at M Capital Group, “Despite all economic scenarios that one may consider, beyond overall economic shocks, medical technology should remain one of the most promising and robust sectors over the short to medium term and well beyond 2028.”
There is a movement towards home-based care for the elderly, next generation scanning and MRI devices, wearable technology, artificial intelligence incorporation, and online connectivity. Experts also see a focus on predictive, preventive, personalized, participatory, and precision medicine, with rising levels of integration of home care and technological innovation.
The average cost of treatment has been rising across the board, creating additional financial burdens to governments, healthcare providers and insurance companies. According to MCG, cost-per-inpatient-stay in the United States alone rose on average annually by over 13% between 2014 to 2021, leading MedTech to focus research efforts on optimized medical equipment at lower price points, whilst emphasizing portability and ease of use. Namely, 46% of the 1,008 medical technology companies in the 2021 MedTech Innovator (“MTI”) database are focusing on prevention, wellness, detection, or diagnosis, signaling a clear push for preventive care to also tackle costs.
In addition, there has also been a lasting impact on consumer and medical demand for home care, supported by the pandemic. Lockdowns, closure of care facilities, and healthcare systems subjected to capacity pressure, accelerated demand away from traditional inpatient care. Now, outpatient care solutions are driving industry production, with nearly 70% of recent diagnostics start-up companies producing products in areas such as ambulatory clinics, at-home care, and self-administered diagnostics.
2. The Agenda
➢ Introduction of Oncology
➢ Why Standards?
➢ Oncology-specific Standards:
Subtype, Response Criteria
guideline, CDISC, Analysis
➢ Standards-driven Oncology
Studies
➢ Final Thoughts / Q&A
3. Cancer Facts
➢ The word ‘cancer’ is related to the Greek word “crab”
because its finger-like projections were similar to the shape
of the crab
➢ In 2010, the economic cost of the disease worldwide was
estimated at $1.16 trillion.
➢ One in eight deaths in the world are due to cancer.
➢ WHO predicts new cancer cases of 14 million in 2012 to 22
million in 2030 and cancer deaths from 8.2 million a year to
13 million annually.
➢ Men who are married are up to 35% less likely to die from
cancer than those who are not married.
4. FDA CDER NMEs and BLAs Approval
➢ 2012 - 39 Approval, 13 Oncology (33 %)
➢ 2013 - 27 Approval, 8 Oncology (30 %)
➢ 2014 - 41 Approval, 9 Oncology (22%)
➢ 2015 - 45 Approval, 13 Oncology (29%)
➢ 2016 – 22 Approval, 6 Oncology (27%)
➢ 2017 – 46 Approval, 12 Oncology (26%)
Note: based on the reports of NMEs and BLAs
approved by CDER
7. We live in the oncology
drug development
environment.
8. What do we feel
about oncology
studies?➢
➢ Different
➢ Complex
➢ Difficult
9. Difference in Oncology Studies
➢ Tumor measurements and their response to drug
➢ Oncology-specific measurements for response criteria
(e.g., Liver and Spleen Enlargement, Bone Marrow
Infiltrate and Blood Counts)
➢ Oncology-diagnosis measurements (e.g.,
immunophenotype, performance status by ECOG,
stage)
➢ Toxicity (Lab and AE)
➢ Time to Event Analysis (e.g., OS, PFS, TTP and ORR,
Kaplan Meier Curves)
16. Oncology specific Standards
• Oncology clinical trial study types
Study Subtype
• What to collect
• How to measure tumor
• How to determine responses
Response Criteria Guideline
• How to store/submit the data
CDISC
• How to analyze/report the data
Analysis
18. Solid Tumor
➢ An abnormal mass of
tissue that are not cysts
or liquid
➢ Most common
➢ Type – breast, prostate,
lung, liver and
pancreatic cancer and
melanoma
19. Lymphoma
➢ Cancer that starts in
Lymph Node
➢ Tumor types:
➢ Enlarged Lymph Node
➢ Nodal Mases
➢ Extra Nodal Masses
20. Leukemia
➢ Cancer that usually begins in
the bone marrow and result
in high number of WBC
➢ Types:
➢ Chronic Lymphocytic
Leukemia(CLL)
➢ Chronic Myeloid
Leukemia(CML)
➢ Acute Lymphoblastic
Leukemia (ALL)
➢ Acute Myeloid Leukemia
(AML)
21. Response Criteria Guidelines
Solid Tumor
•RECIST
(Response
Evaluation
Criteria in
Solid Tumor)
1.1
•irRC(Immune-
related
RECIST) 2009
Lymphoma
•Cheson 2007
•Cheson 2014
(2014 Lugano
classification)
Leukemia
•IWCLL 2008
•IWAML 2003
•NCCN
Guideline
2012 on ALL
•CML ESMO
Guidelines
22. CDISC Oncology specific Standards
➢ CDASH
➢ SDTM
➢ TU : Tumor Identification
➢ TR : Tumor Results
➢ RS : Response
➢ ADaM
➢ -TTE : Time to Event Analysis Datasets
29. CDISC SDTM TR based on RECIST 1.1
data collection
USUBJID TRGRID TRLINKID TRTESTCD TRTEST TRCAT TRORRES TRORRESU VISIT
001-01-001 Target T01 LDIAM Longest
Diameter
Measure
ment
10 mm Cycle 1
001-01-001 Target T02 LDIAM Longest
Diameter
Measure
ment
10 mm Cycle 1
001-01-001 Target T03 LDIAM Longest
Diameter
Measure
ment
15 mm Cycle 1
001-01-001 Target SUMDIAM Sum of
Diameter
Measure
ment
35 mm Cycle 1
001-01-001 Non-Target NT01 TUMSTATE Tumor State Qualitativ
e
PRESENT Cycle 1
001-01-001 Non-Target NT02 TUMSTATE Tumor State Qualitativ
e
PRESENT Cycle 1
001-01-001 Non-Target NT03 TUMSTATE Tumor State Qualitativ
e
PRESENT Cycle 1
• Sum of Diameter changed from 70 mm to 35 mm
• No changes in non-target.
• No new lesion
30. Response Assessment at Cycle 1
for RECIST 1.1 (TR to RS)
USUBJID TRGRID TRLINKID TRTESTCD TRTEST TRORRES TRORRESU VISIT
001-01-001 Target T01 LDIAM Longest Diameter 10 mm Cycle 1
001-01-001 Target T02 LDIAM Longest Diameter 10 mm Cycle 1
001-01-001 Target T03 LDIAM Longest Diameter 15 mm Cycle 1
001-01-001 Target SUMDIAM Sum of Diameter 35 mm Cycle 1
001-01-001 Non-Target NT01 TUMSTATE Tumor State PRESENT Cycle 1
001-01-001 Non-Target NT02 TUMSTATE Tumor State PRESENT Cycle 1
001-01-001 Non-Target NT03 TUMSTATE Tumor State PRESENT Cycle 1
USUBJID RSTESTCD RSTEST RSCAT RSORRES VISIT
001-01-001 TRGRESP Target Response RECIST 1.1 PR Cycle 1
001-01-001 NTRGRESP Non-target Response RECIST 1.1 NonCR/NonPD Cycle 1
001-01-001 NEWLPROG New Lesion Progression RECIST 1.1 N Cycle 1
001-01-001 OVRLRESP Overall Response RECIST 1.1 PR Cycle 1
31. Oncology Specific
Efficacy Time to
Event Analysis
➢ Time to Event ADaM datasets
➢ OS – Overall Survival
➢ PFS – Progression Free
Survival
➢ Kaplan Meier Curves
32. Time to Event Analysis in ADaM
USUBJID TRTP PARAM AVAL STARTDT ADT CNSR EVNTDESC
001-01-001 Study
Drug 1
Time to
Death (Days)
157 2011-01-
04
2011-06-
10
1 COMPLETED
THE STUDY
001-01-002 Study
Drug 2
Time to Death
(Days)
116 2011-02-
01
2011-05-
28
1 LOST TO
FOLLOW-UP
001-01-003 Study
Drug 2
Time to Death
(Days)
88 2011-02-
05
2011-05-
04
0 DEATH
001-01-004 Study
Drug 1
Time to Death
(Days)
102 2011-03-
20
2011-06-
30
1 ONGOING
001-01-005 Study
Drug 1
Time to Death
(Days)
101 2011-03-
26
2011-07-
05
1 ONGOING
Overall Survival analysis by Kaplan Meier plot, log rank
test or Cox Regression Analysis.
35. E2E Standards-driven automated
process of Oncology Study
Protocol
Cheson
2014
Collection
Tumor
Measuremen
t
SDTM
TR
Analysis
Progression
Free Survival
Time to Even
Analysis
Report
ADaM
ADTTEPFS
Bone Marrow
Assessment
Spleen and
Liver
Enlargement
FA
TU
LB
Response
PE
RS
36. Why Standards
driven process in
oncology studies?
➢ Regulatory
compliance
➢ Easy to understand
➢ Scalable
➢ 20/80
➢ Time Saving
➢ Effective/ efficient
37. If ( x + 2 ) = 1000,
what is x2 – 4 =?
( x + 2 ) ( x - 2 ) = 1000* 996
= 996,000
Standardized way to solve the
complex problem
38. Final Thoughts
➢ Benefits of Standards in
Oncology Studies
➢ Oncology-specific
standards
➢ E2E Standards-driven
process