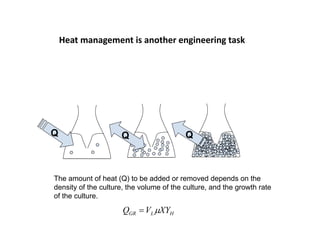
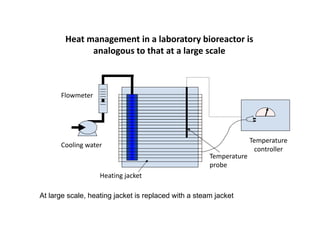
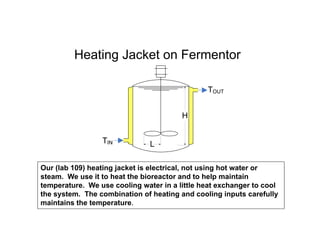
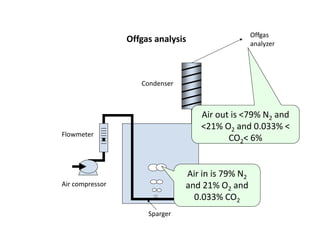
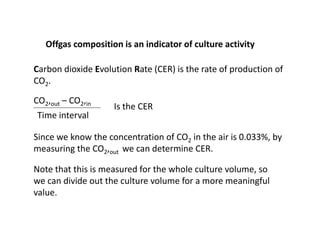
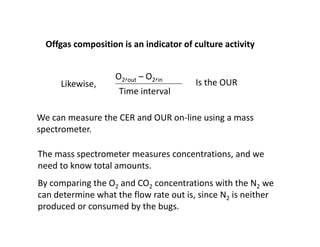
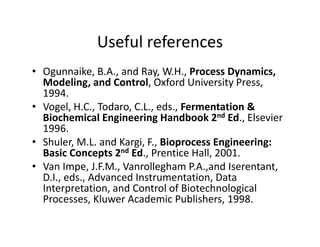
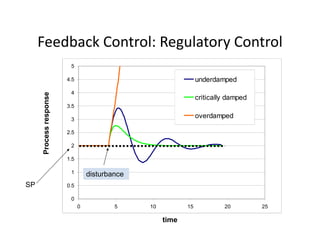
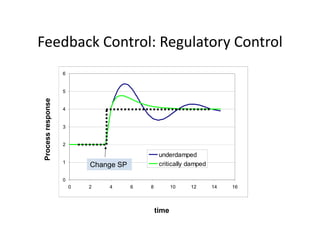
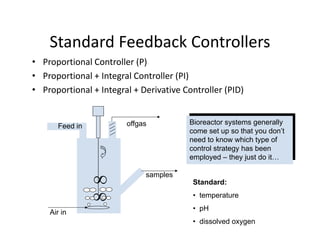
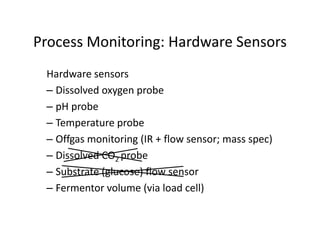
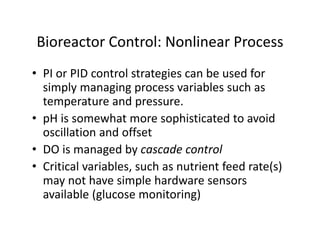
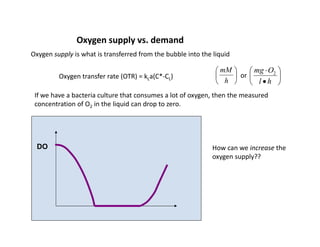
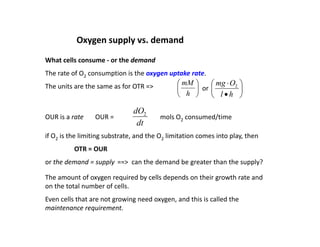
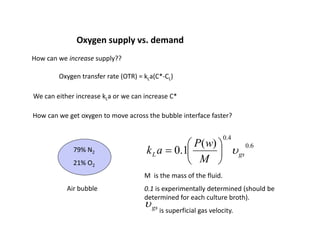
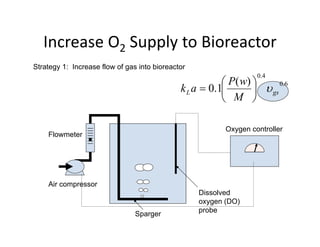
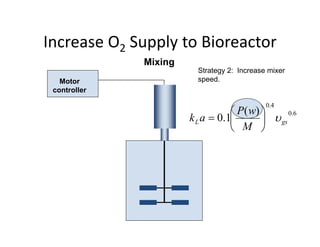
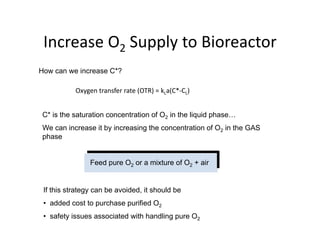
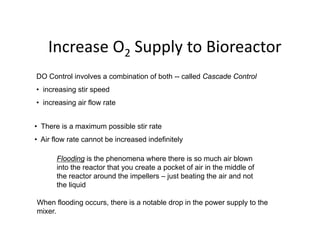
This document provides an overview of bioreactor monitoring and control. It discusses key process variables such as dissolved oxygen, pH, temperature, and substrate concentration that are monitored during fermentation. It also describes basic principles of process control including feedback control configurations and the use of proportional, integral and derivative controllers. Specific challenges around monitoring and controlling dissolved oxygen and pH are also summarized.

![Challenges with DO control
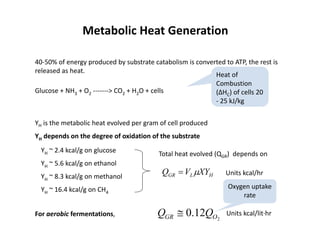
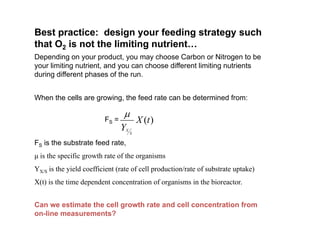
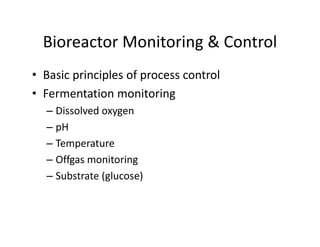
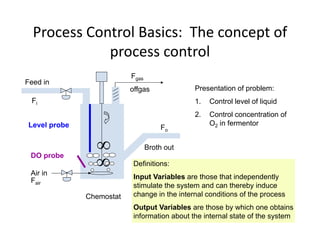
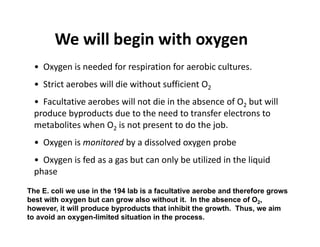
Challenges with DO control
• Oxygen will dissolve in water up to
yg p
[DO]sat'd ~ 7 ppm (= 7 mg/L) at 30ºC.
• This concentration is sufficient for
bugs to grow, what is limiting is the
g g g
rate of transfer from the air bubble to
the liquid.
T 0C x (mol O2/mol H2O) [O2] mg O2/l H2O
10 0 0000064 11 377
10 0.0000064 11.377
20 0.0000052 9.277
30 0.0000044 7.832
40 0.0000039 6.954
50 0.0000036 6.327](https://image.slidesharecdn.com/1809bioreactorcontrol-230712045753-93f82542/85/Bioreactor_Control-pdf-13-320.jpg)
![What is pH
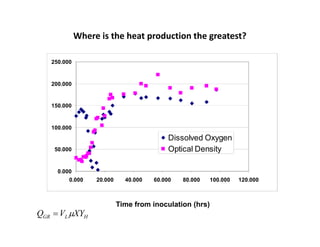
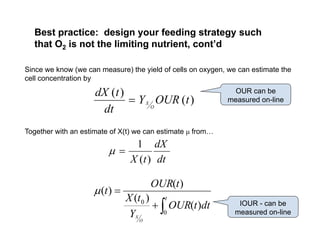
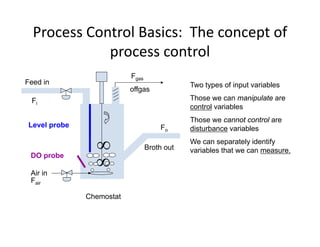
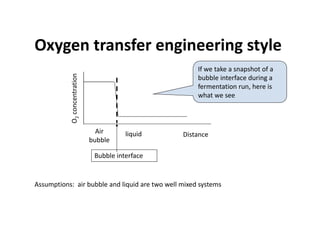
What is pH
Pure water dissociates to yield 10-7 moles/L of H+ at 250C:
H2O <----> H+ + OH-
Since water dissociates to produce one OH- ion for each H+ ion, it is
obvious that
obvious that
10-7 OH- ions are produced simultaneously.
The product of [H+] and [OH-] always remains constant. When the value for
one of the species changes the other also changes accordingly.
[H+] x [OH-] = 10-14
[H ] x [OH ] 10
The concentration of H+ ions can be increased when compounds are added
which release H+ ions such as H2SO4:
H2SO4 <----> 2H+ + SO4
2-](https://image.slidesharecdn.com/1809bioreactorcontrol-230712045753-93f82542/85/Bioreactor_Control-pdf-24-320.jpg)
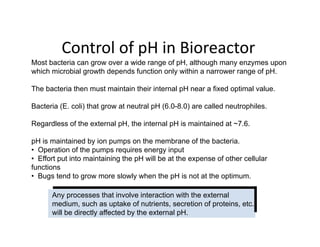
![Control of pH in Bioreactor
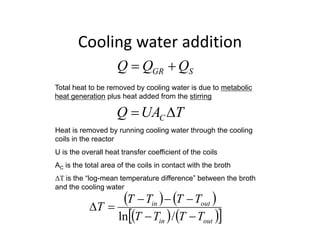
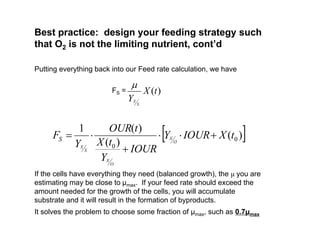
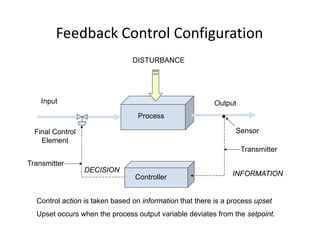
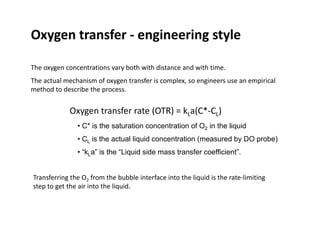
Control of pH in Bioreactor
Calculate the concentration of hydrogen ions
from the pH
[H+] (molar concentration) = 10-pH
eg for pH = 7.0 and 7.2
[H+] = 10-7 molar or 0 0000001
[H+] 10 molar or 0.0000001
[H+] = 10-7.2 molar or 0.0000000631
ti th t i i th H b 0 2 d th [H ] b 37%
notice that increasing the pH by 0.2 decreases the [H+] by 37%](https://image.slidesharecdn.com/1809bioreactorcontrol-230712045753-93f82542/85/Bioreactor_Control-pdf-25-320.jpg)