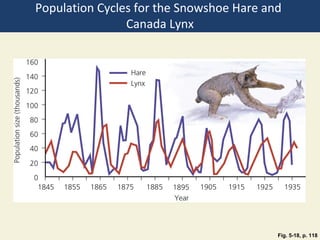
1. Species interact through competition, predation, parasitism, mutualism, and commensalism over limited resources.
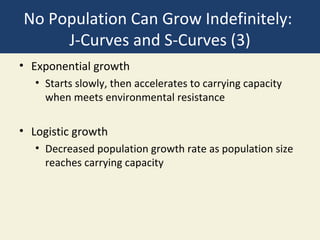
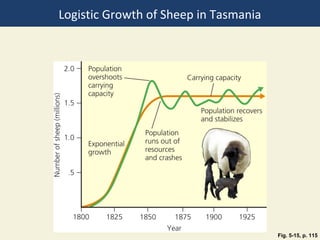
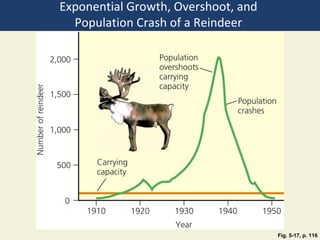
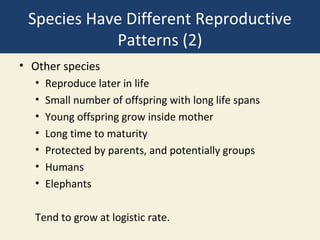
2. Populations grow exponentially at first but then level off as they approach the carrying capacity of their environment due to limiting factors.
3. Communities and ecosystems change over time through primary and secondary succession as species composition alters in response to environmental disturbances or changes.