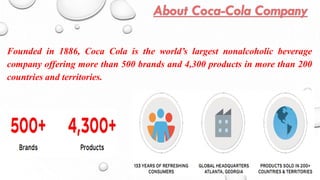
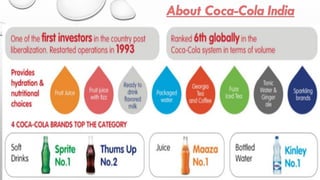
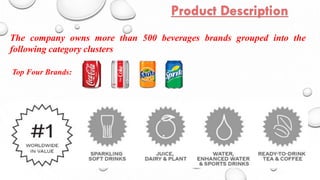
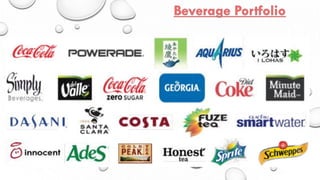
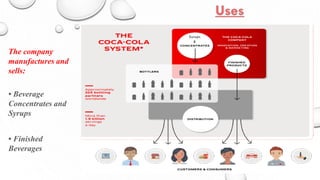
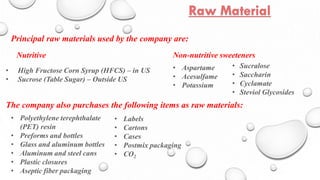
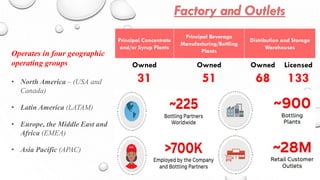
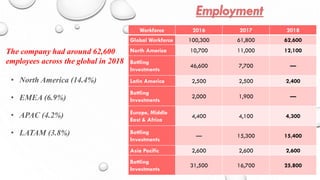
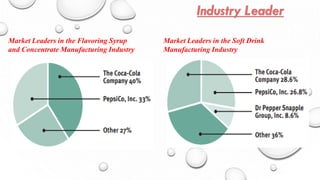
Founded in 1886, Coca Cola is the world’s largest nonalcoholic beverage
company offering more than 500 brands and 4,300 products in more than 200
countries and territories.
The company owns more than 500 beverages brands grouped into the
following category clusters
Top Four Brands:
Syrups
&
The company
manufactures and
sells:
• Beverage
Concentrates and
Syrups
• Finished
Beverages
Principal raw materials used by the company are:
• Polyethylene terephthalate
(PET) resin
• Preforms and bottles
• Glass and aluminum bottles
• Aluminum and steel cans
• Plastic closures
• Aseptic fiber packaging
Non-nutritive sweeteners
• High Fructose Corn Syrup (HFCS) – in US
• Sucrose (Table Sugar) – Outside US
• Labels
• Cartons
• Cases
• Postmix packaging
• CO2
The company also purchases the following items as raw materials:
• Aspartame
• Acesulfame
• Potassium
• Sucralose
• Saccharin
• Cyclamate
• Steviol Glycosides
Nutritive
• North America – (USA and
Canada)
• Latin America (LATAM)
• Europe, the Middle East and
Africa (EMEA)
• Asia Pacific (APAC)
Operates in four geographic
operating groups
Principal Concentrate
and/or Syrup Plants
Principal Beverage
Manufacturing/Bottling
Plants
Distribution and Storage
Warehouses
Owned
31
Owned
51
Owned
68
Licensed
133
• Franchise Bottlers
• HCCBPL bottling
plants
• Co-packers of HCCBPL
The network across the
country consist of:
Workforce 2016 2017 2018
Global Workforce 100,300 61,800 62,600
North America 10,700 11,000 12,100
Bottling
Investments
46,600 7,700 —
Latin America 2,500 2,500 2,400
Bottling
Investments
2,000 1,900 —
Europe, Middle
East & Africa
4,400 4,100 4,300
Bottling
Investments
— 15,300 15,400
Asia Pacific 2,600 2,600 2,600
Bottling
Investments
31,500 16,700 25,800
• North America (14.4%)
• EMEA (6.9%)
• APAC (4.2%)
• LATAM (3.8%)
The company had around 62,600
employees across the global in 2018
Countries Value (in $ MN) % to Total Exports
Austria 3100 14.4%
Germany 2000 9.2%
Netherlands 1900 9.0%
Switzerland 1800 8.4%
Thailand 1400 6.7%
United States 1200 5.7%
Belgium 919.2 4.2%
France 838.9 3.9%
United Kingdom 596.8 2.7%
Italy 566.9 2.6%
Top Five Importers
Countries Value $ MN
Switzerland 0.21
Bhutan 0.03
Oman 0.02
UAE 0.02
USA 0.02
Top Five Exporters
Countries Value $ MN
Nepal 0.65
Guinea 0.09
Myanmar 0.07
Qatar 0.07
Sudan 0.07
Global Exporters of Soft Drinks
Exploiting economies of scale and its bargaining power (on account of bulk purchases),
CocaCola India has facilitated exports of commodities and materials like tea, coffee, PET
resin, performs, closures, crowns and labels across the globe
• Corporate repute for innovation and quality
• Communication of product strength
perceived by users
• Symbol of Joy and Fun
• Product Line
• Organic Soda and Beverage line
Coca Cola maintains their differentiation from other soft drinks by spending more than 20%
of their advertisement budget to only differentiate their product. It has positioned successfully
with following standards
• Culturally Tailored Products
• Water Purity Standard
• Snack Food Line
• Customize Vending Machine
The company spent a whopping USD 5.8 billion on global advertising, or 18.3% of revenue in
FY 2018, up slightly from USD 4 billion in 2017
The first Coke TV advertisement was launched on Thanksgiving Day in 1950 during a show
‘The ventriloquist Edgar Bergen and his puppet Charlie McCarthy’.
Coca Cola – First Brand Positioning was Patent Medicine – ‘’Cure for headaches and
fatigues’’which lead to Tax imposition in 1898 and Coca Cola’s change of category.
Coca Cola – 2014 Brand Positioning – ‘’Live on the Coke side of life’’
These are the various taglines used by the company among others including Open happiness;
Twist The Cap To Refreshment; Life Begins Here; Brrrr.
the largest spender on global advertising and marketing of any other soft drink producer.
2018 Global Unit Case Volume By
Category Cluster*
2018 Global Unit Case Volume by
Region
Each sub-brand of coca cola has different pricing strategy. Their pricing strategy is based on the
competitors pricing, Pepsi is the direct competitor to coke. There are three different pricing strategies which
a company can primarily follow:
Coke’s pricing strategy is not based on the quantity sold, but on the value created
1) Price Skimming: Charging premium prices initially to earn maximum revenue.
2) Market Price: Setting price as going market rate (by competitors)
3) Market Penetration: Charging lowest price to achieve highest possible sales.
Coca-Cola uses the following alternate pricing strategies over the year for Coke:
Cost-based Pricing
Market-
Penetration Pricing
Competition-
based pricing
Packs 200ml 300ml 600ml 1.25L 2.25L
Price (in INR) 20 30 40 40 90
PlantBottle : Coca Cola has come up with a unique and innovative technique called PlantBottle
packaging Technology, aimed at reducing the dependence on fossil fuel-based materials as
compared to PET bottles. Positive impact on the environment as the PlantBottle is made up with
30% of plant material.
Artificial Intelligence: The company has begun fitting its vending machines with AI algorithms. On
newer machines, typically the customer will interact through a touch-screen display, enabling them
to select the product they want and even customise it with ‘’shots of different flavours.(Freestyle
Dispensers).
ETA is part of Coke’s Global R&D department.
• Lumense Nano Sensing Technology
• 3M Technologies Light Tube Technology
• Merlin Mobility Augmented Reality Technology
Oldest Competitors Young Competitors (established since 2000’s)
• Coca-Cola (40%)
• Pepsi (20%)
• Others (40%)
Market Share
The global nonalcoholic beverage market size was valued at USD 967.3 billion in 2016. The market is anticipated
to grow at an estimated CAGR of 5.8% from 2017 to 2025 owing to factors such as rising disposable income,
population growth, and changing lifestyle. Increasing concerns regarding obesity and health awareness are
expected to trigger the growth of functional beverage and bottled water product segment, while at the same time
limit the demand for carbonated drinks. The nonalcoholic beverage industry is regulated by various international
and national regulatory authorities across the globe. Companies in this industry heavily use resources such as
water and electricity, which are considered to be scarce.
The challenges in the industry are immense, owing to the massive competition. A single transformation is
constrained to affect the entire supply chain. Contemporary markets, changing consumer spending, increasing
prices due to taxes, universal appetite, and modern technology are predicted to bring about extensive changes in
this sector in the next coming years. Despite the ongoing challenges in beverage industry, it is anticipated to show
beneficial gains in the near future. Beverage companies must now keep up with this cultural shift by innovating
new products, not only in the form of non-alcoholic options, but that also align with health, wellness and
sustainability trends. Consumer tastes are also becoming increasingly sophisticated, particularly in the growing
craft beer and specialty coffee sectors.
• Upswing of Healthy and Organic Drinks
• Complicated Government Regulations
• Logistics
• Product Diversity
• Waste Reduction
Market Leaders in the Flavoring Syrup
and Concentrate Manufacturing Industry
Market Leaders in the Soft Drink
Manufacturing Industry
6.2%
5.3%
4.9%
4.4%
3.9%
3%
3%
3%
3%
3%
5%
5%
5%
5%
5%
0% 1% 2% 3% 4% 5% 6% 7%
2014
2015
2016
2017
2018
World India United States
Implementation of GST
The Indian Government implemented the Goods & Services Tax (GST) on July 1, 2017. These new
policies have resulted in near term uncertainty for retailers and consumers that impacted the beverage
industry. Soft drink firms plan to increase prices by 5-10% to offset higher tax outgo under GST regime
Top beverage makers including Coca-Cola, PepsiCo and Bisleri have begun printing a buyback value on
all PET (plastic) bottles sold in Maharashtra to comply with new regulations and help check plastic
littering. Maharashtra enforced a ban on PET bottles smaller than 200 ml and other single use
disposable plastic
Impact of Plastic Ban
Impact of Demonetization
Major policy changes, such as demonetisation, hit beverage sales in the country. The volumes of the global
beverage major fell 4% in the Q1 2017, and its bottling operations declined in Q2 2017, post demonetization
US- China Tariffs
The Trump administration’s tariffs on steel and aluminium have increased input costs, making the
production of soda cans expensive.

Beverage industry (Soft Drinks)

  • 4.
    Founded in 1886,Coca Cola is the world’s largest nonalcoholic beverage company offering more than 500 brands and 4,300 products in more than 200 countries and territories.
  • 6.
    The company ownsmore than 500 beverages brands grouped into the following category clusters Top Four Brands:
  • 8.
    Syrups & The company manufactures and sells: •Beverage Concentrates and Syrups • Finished Beverages
  • 9.
    Principal raw materialsused by the company are: • Polyethylene terephthalate (PET) resin • Preforms and bottles • Glass and aluminum bottles • Aluminum and steel cans • Plastic closures • Aseptic fiber packaging Non-nutritive sweeteners • High Fructose Corn Syrup (HFCS) – in US • Sucrose (Table Sugar) – Outside US • Labels • Cartons • Cases • Postmix packaging • CO2 The company also purchases the following items as raw materials: • Aspartame • Acesulfame • Potassium • Sucralose • Saccharin • Cyclamate • Steviol Glycosides Nutritive
  • 10.
    • North America– (USA and Canada) • Latin America (LATAM) • Europe, the Middle East and Africa (EMEA) • Asia Pacific (APAC) Operates in four geographic operating groups Principal Concentrate and/or Syrup Plants Principal Beverage Manufacturing/Bottling Plants Distribution and Storage Warehouses Owned 31 Owned 51 Owned 68 Licensed 133
  • 12.
    • Franchise Bottlers •HCCBPL bottling plants • Co-packers of HCCBPL The network across the country consist of:
  • 13.
    Workforce 2016 20172018 Global Workforce 100,300 61,800 62,600 North America 10,700 11,000 12,100 Bottling Investments 46,600 7,700 — Latin America 2,500 2,500 2,400 Bottling Investments 2,000 1,900 — Europe, Middle East & Africa 4,400 4,100 4,300 Bottling Investments — 15,300 15,400 Asia Pacific 2,600 2,600 2,600 Bottling Investments 31,500 16,700 25,800 • North America (14.4%) • EMEA (6.9%) • APAC (4.2%) • LATAM (3.8%) The company had around 62,600 employees across the global in 2018
  • 14.
    Countries Value (in$ MN) % to Total Exports Austria 3100 14.4% Germany 2000 9.2% Netherlands 1900 9.0% Switzerland 1800 8.4% Thailand 1400 6.7% United States 1200 5.7% Belgium 919.2 4.2% France 838.9 3.9% United Kingdom 596.8 2.7% Italy 566.9 2.6% Top Five Importers Countries Value $ MN Switzerland 0.21 Bhutan 0.03 Oman 0.02 UAE 0.02 USA 0.02 Top Five Exporters Countries Value $ MN Nepal 0.65 Guinea 0.09 Myanmar 0.07 Qatar 0.07 Sudan 0.07 Global Exporters of Soft Drinks Exploiting economies of scale and its bargaining power (on account of bulk purchases), CocaCola India has facilitated exports of commodities and materials like tea, coffee, PET resin, performs, closures, crowns and labels across the globe
  • 15.
    • Corporate reputefor innovation and quality • Communication of product strength perceived by users • Symbol of Joy and Fun • Product Line • Organic Soda and Beverage line Coca Cola maintains their differentiation from other soft drinks by spending more than 20% of their advertisement budget to only differentiate their product. It has positioned successfully with following standards • Culturally Tailored Products • Water Purity Standard • Snack Food Line • Customize Vending Machine
  • 16.
    The company spenta whopping USD 5.8 billion on global advertising, or 18.3% of revenue in FY 2018, up slightly from USD 4 billion in 2017 The first Coke TV advertisement was launched on Thanksgiving Day in 1950 during a show ‘The ventriloquist Edgar Bergen and his puppet Charlie McCarthy’. Coca Cola – First Brand Positioning was Patent Medicine – ‘’Cure for headaches and fatigues’’which lead to Tax imposition in 1898 and Coca Cola’s change of category. Coca Cola – 2014 Brand Positioning – ‘’Live on the Coke side of life’’ These are the various taglines used by the company among others including Open happiness; Twist The Cap To Refreshment; Life Begins Here; Brrrr. the largest spender on global advertising and marketing of any other soft drink producer.
  • 19.
    2018 Global UnitCase Volume By Category Cluster* 2018 Global Unit Case Volume by Region
  • 20.
    Each sub-brand ofcoca cola has different pricing strategy. Their pricing strategy is based on the competitors pricing, Pepsi is the direct competitor to coke. There are three different pricing strategies which a company can primarily follow: Coke’s pricing strategy is not based on the quantity sold, but on the value created 1) Price Skimming: Charging premium prices initially to earn maximum revenue. 2) Market Price: Setting price as going market rate (by competitors) 3) Market Penetration: Charging lowest price to achieve highest possible sales. Coca-Cola uses the following alternate pricing strategies over the year for Coke: Cost-based Pricing Market- Penetration Pricing Competition- based pricing Packs 200ml 300ml 600ml 1.25L 2.25L Price (in INR) 20 30 40 40 90
  • 21.
    PlantBottle : CocaCola has come up with a unique and innovative technique called PlantBottle packaging Technology, aimed at reducing the dependence on fossil fuel-based materials as compared to PET bottles. Positive impact on the environment as the PlantBottle is made up with 30% of plant material. Artificial Intelligence: The company has begun fitting its vending machines with AI algorithms. On newer machines, typically the customer will interact through a touch-screen display, enabling them to select the product they want and even customise it with ‘’shots of different flavours.(Freestyle Dispensers). ETA is part of Coke’s Global R&D department. • Lumense Nano Sensing Technology • 3M Technologies Light Tube Technology • Merlin Mobility Augmented Reality Technology
  • 23.
    Oldest Competitors YoungCompetitors (established since 2000’s)
  • 24.
    • Coca-Cola (40%) •Pepsi (20%) • Others (40%) Market Share
  • 27.
    The global nonalcoholicbeverage market size was valued at USD 967.3 billion in 2016. The market is anticipated to grow at an estimated CAGR of 5.8% from 2017 to 2025 owing to factors such as rising disposable income, population growth, and changing lifestyle. Increasing concerns regarding obesity and health awareness are expected to trigger the growth of functional beverage and bottled water product segment, while at the same time limit the demand for carbonated drinks. The nonalcoholic beverage industry is regulated by various international and national regulatory authorities across the globe. Companies in this industry heavily use resources such as water and electricity, which are considered to be scarce. The challenges in the industry are immense, owing to the massive competition. A single transformation is constrained to affect the entire supply chain. Contemporary markets, changing consumer spending, increasing prices due to taxes, universal appetite, and modern technology are predicted to bring about extensive changes in this sector in the next coming years. Despite the ongoing challenges in beverage industry, it is anticipated to show beneficial gains in the near future. Beverage companies must now keep up with this cultural shift by innovating new products, not only in the form of non-alcoholic options, but that also align with health, wellness and sustainability trends. Consumer tastes are also becoming increasingly sophisticated, particularly in the growing craft beer and specialty coffee sectors.
  • 28.
    • Upswing ofHealthy and Organic Drinks • Complicated Government Regulations • Logistics • Product Diversity • Waste Reduction
  • 29.
    Market Leaders inthe Flavoring Syrup and Concentrate Manufacturing Industry Market Leaders in the Soft Drink Manufacturing Industry
  • 31.
    6.2% 5.3% 4.9% 4.4% 3.9% 3% 3% 3% 3% 3% 5% 5% 5% 5% 5% 0% 1% 2%3% 4% 5% 6% 7% 2014 2015 2016 2017 2018 World India United States
  • 32.
    Implementation of GST TheIndian Government implemented the Goods & Services Tax (GST) on July 1, 2017. These new policies have resulted in near term uncertainty for retailers and consumers that impacted the beverage industry. Soft drink firms plan to increase prices by 5-10% to offset higher tax outgo under GST regime Top beverage makers including Coca-Cola, PepsiCo and Bisleri have begun printing a buyback value on all PET (plastic) bottles sold in Maharashtra to comply with new regulations and help check plastic littering. Maharashtra enforced a ban on PET bottles smaller than 200 ml and other single use disposable plastic Impact of Plastic Ban Impact of Demonetization Major policy changes, such as demonetisation, hit beverage sales in the country. The volumes of the global beverage major fell 4% in the Q1 2017, and its bottling operations declined in Q2 2017, post demonetization US- China Tariffs The Trump administration’s tariffs on steel and aluminium have increased input costs, making the production of soda cans expensive.