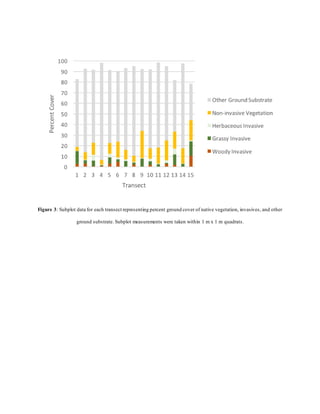
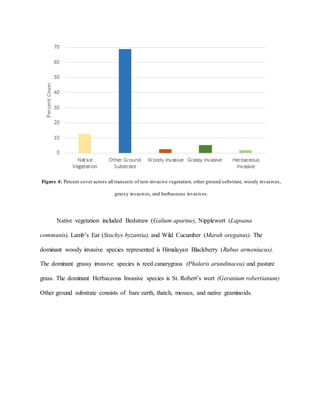
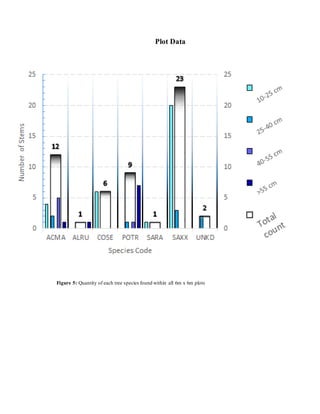
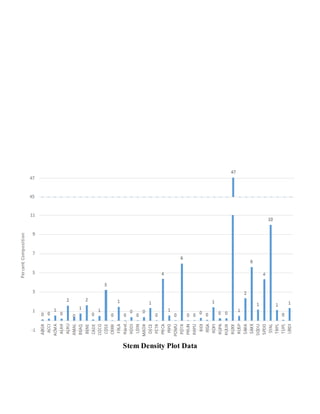
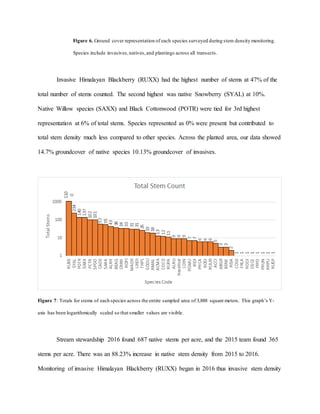
SlideShare a Scribd company logo
Riparian Revegetation Monitoring at
Berggren Watershed Conservation Area
Stream Stewardship 2016
Daniel Baldwin
Rachel Berner
Frian Mardhani
Eric Mullen
Jacqueline Vasquez
Natasha Wibawa
University of Oregon
Environmental Leadership Program
Spring 2016
Abstract: The 2016 Stream Stewardship team conducted monitoring of Berggren Watershed
Conservation Area (BWCA), a restoration site in the lower McKenzie watershed,
implemented through the McKenzie Watershed Council. BWCA was planted in an
effort to restore the riparian area adjacent to the McKenzie. Our team collected data
on 15 transects within the planted area and found mostly thatch, bare earth, and,
moss, with roughly the same amounts of planted and invasive species. Our data
indicate that the proportion of invasives has decreased since 2015, showing that
restoration efforts are being met with success at this site.
Introduction
A great number of stream and floodplain habitats have seen decreased water quality and
ecosystem function in the wake of development and land use changes. In the Pacific Northwest,
degraded aquatic habitats and water quality are attributed to unsustainable agriculture and
grazing practices, dam construction, timber harvest, and removal of large wood from waterways
(Anderson et al. 2010; Gonzalez et al. 2015; Hafs et al. 2014). Salmonid populations face a
number of threats; one of the most significant is loss of spawning and early life habitat. Chinook
salmon (Oncorhynchus tshawytscha) are native to the waterways of the Pacific Northwest, and
serve as an excellent indicator of the ecological health of a river or tributary. There are
considerable efforts in the Pacific Northwest to monitor, preserve, and restore these populations.
The Berggren Watershed Conservation Project aims to restore the riparian ecosystem by
increasing plant diversity, the width of riparian buffer zone, and increasing total revegetated area
by a minimum of 50%. To achieve these goals, riparian plantings have been implemented to
increase native plant recruitment and ground cover. Species were chosen to recreate diverse plant
communities that historically existed in the Mckenzie Watershed - these species are marked by
their attractiveness to native pollinators and ability to tolerate dramatic seasonal changes in
precipitation and temperature. Native vegetation stem density is projected to be 1,600 stems per
acre, and the diversity of stems at a minimum of five tree species and eight shrubs species.
As stated by the McKenzie Watershed Council in 2002, their mission includes restoring,
protecting, and connecting key upland and floodplain habitats. The plantings serve as both an
extension of that mission, as well as an excellent tool to educate the public regarding the
importance of maintaining natural ecosystems and biodiversity. The project aims to convert a
portion of floodway farm fields to native riparian forest, creating a vegetation buffer that
enhances habitat for fish and wildlife and attracts native pollinators to the area.
Study Area
Berggren Watershed Conservation Area is located near Springfield between river mile 19
and 20 of the Mckenzie River on the north bank (Figure 1).The reach containing BWCA has
been identified for conservation three times since the year 2000.
Figure 1: Aerial map of entire BWCA site (source: McKenzie Watershed Council)
The Mckenzie River Trust purchased BWCA in 2002 with the support of the Bonneville
Power Administration. The site features a diverse network of side channels, relatively isolated
floodplain pools, and stands of dense floodplain forest. These channels provide spawning,
rearing, and refuge habitat for native fish species including Chinook salmon and Oregon chub. A
2012 survey also found red-legged frogs and northwest salamanders.
The establishment of invasive species and associated lack of diverse native plant
communities in an increasingly restricted riparian corridor is a significant problem at BWCA.
Intermittent grazing, tractor mowing, and timber harvest have all negatively impacted the
hydrology of the site. On a basin-wide scale, dam related flood control has reduced flood
frequency and intensity at BWCA, in turn reducing its connectivity with the McKenzie River.
Because salmon will attempt to colonize almost any area which is accessible via a
waterway (Anderson et al. 2010), all potential restoration sites must be evaluated based upon
their associated benefit and risk of failure to salmon populations, given the quality or quantity of
resources used (Budy & Schaller 2007). The McKenzie River Subbasin Assessment in 2000 first
identified the reach containing the BWCA as a fish habitat conservation priority, and it was again
highlighted by the McKenzie River Watershed Conservation Strategy in 2002, this time with a
focus on the enhancement of floodplain forests and aquatic habitat (BWCA Riparian
Enhancement Phase II).
Methods
TFT RevegetationMonitoring Protocol
Our team used a modified version of the Freshwater Trust (TFT) Revegetation
Monitoring Protocol for Water Quality Trading Projects to measure vegetation at BWCA. We
recreated past transects drawn by Stream Stewardship 2015 using compass bearings and GPS.
Transects were drawn roughly perpendicularly to the McKenzie river, starting at the toe of the
riparian zone and marked with flagging tape. They were placed with the target sampling goal of
at least 5% of the planted area, to allow extrapolation to the entire planting area.
Figure 1: Google Earth imagery of four of the fifteen transects monitored by Stream Stewardship 2016.
Start and end points are GPS waypoints also taken by the 2016 Stream Stewardship team.
Plots with 6m2 dimensions were centered on each transect, with 6m separating each plot.
Within these plots our team recorded data on the stem density of natural and planted native
vegetation as well as invasive species. Stem counts by species code made in these sample plots
were necessary to test success of project goals for stem density (minimum of 1,600 stems per
acre) and stem diversity (minimum of five tree and eight shrub species). Across all transects and
including all 6m2 plots, our team sampled 3,888 square meters of BWCA.
For more detailed sampling of ground cover, our team placed two 1m x 1m quadrats
within the 6m square plots, both 1m from opposite ends of the plot boundary, as well as adjacent
to and on opposite sides of the transect line. Placement on the left or right side of transect length
was randomized to reduce selection bias to the surrounding 6 m x 6 m plot. Our team recorded
percent ground cover of native vegetation, invasive vegetation (categorized as herbaceous,
woody, or grassy), as well as other ground subrate (bare ground, thatch, mosses, etc.). Addition
observations were made on standing water, growth of invasive species, and health or planting
performance. We sketched a map for each of the transect layouts, including important features
and the hydrological zones present. TFT protocol divides riparian areas into five zones: toe,
bank, overbank, transition, and upland.
Photopoint Monitoring
Figure 2: Photopoint example between 2014 pre-treatment (left) and 2016 post-treatment (right)
We followed the United States Forest Service (USFS) photopoint protocol to monitor the
growth of plantings and reduction in invasive plant cover at the Berggren Watershed
Conservation Area (BWCA). We took photographs at previously established photo points within
BWCA to observe trends in vegetation vitality and composition. Native shrubs and trees were
reintroduced as a means of restoring the riparian habitat by the McKenzie Watershed Council.
The photographs taken by the Council were used to determine the location, scale and direction of
each new photopoint. These photos provide a side-by-side comparison with the 2015 pre-
treatment vegetation sampling and advise future monitoring of riparian revegetation at the site.
Photopoint data from 2015 was not collected, so there will be a one year gap in photopoint trend
monitoring for this site. Nevertheless, thorough photopoint monitoring is useful as it helps to
visualize the changes in the area over time, and types of vegetation that are present.
Results:
Subplot Data
Figure 3: Subplot data for each transect representing percent ground cover of native vegetation, invasives, and other
ground substrate. Subplot measurements were taken within 1 m x 1 m quadrats.
Figure 4: Percent cover across all transects of non-invasive vegetation, other ground substrate, woody invasives,
grassy invasives, and herbaceous invasives.
Native vegetation included Bedstraw (Galium aparine), Nipplewort (Lapsana
communis), Lamb’s Ear (Stachys byzantia), and Wild Cucumber (Marah oreganus). The
dominant woody invasive species represented is Himalayan Blackberry (Rubus armeniacus).
The dominant grassy invasive species is reed canarygrass (Phalaris arundinacea) and pasture
grass. The dominant Herbaceous Invasive species is St. Robert’s wort (Geranium robertianum)
Other ground substrate consists of bare earth, thatch, mosses, and native graminoids.
Plot Data
Figure 5: Quantity of each tree species found within all 6m x 6m plots
Stem Density Plot Data
Figure 6. Ground cover representation of each species surveyed during stem density monitoring.
Species include invasives,natives,and plantings across all transects.
Invasive Himalayan Blackberry (RUXX) had the highest number of stems at 47% of the
total number of stems counted. The second highest was native Snowberry (SYAL) at 10%.
Native Willow species (SAXX) and Black Cottonwood (POTR) were tied for 3rd highest
representation at 6% of total stems. Species represented as 0% were present but contributed to
total stem density much less compared to other species. Across the planted area, our data showed
14.7% groundcover of native species 10.13% groundcover of invasives.
Figure 7: Totals for stems of each species across the entire sampled area of 3,888 square meters. This graph’s Y-
axis has been logarithmically scaled so that smaller values are visible.
Stream stewardship 2016 found 687 native stems per acre, and the 2015 team found 365
stems per acre. There was an 88.23% increase in native stem density from 2015 to 2016.
Monitoring of invasive Himalayan Blackberry (RUXX) began in 2016 thus invasive stem density
was not included in stem density comparison between 2015 and 2016.
Discussion
Transects surveyed at BWCA were used to assess the broader planting area. Funding and
time resources disallow for complete census data in the planting area, even for readily
recognizable pieces of data such as trees large enough to receive a DBH (Diameter at Breast
Height) measurement. Figure 3 (subplot data) clearly shows that ground cover at the time of our
sampling is rather variable across all transects, yet certain qualities hold true in all transects, such
that other ground substrate makes up the majority of ground cover, and native vegetative ground
cover is usually the second highest category. Transect 1 & 15 in Figure 3 show areas in which
invasive are currently outcompeting native species, and future intervention may be necessary to
prevent invasive domination of ground cover. In contrast, our analysis indicate that in transects
9, 11, and 14, native vegetation is successfully outcompeting invasives at time of our sampling.
If additional removal and suppression of invasive vegetation is required in the future, it is
important for managers to know which areas are most likely to experience pressure from
invasive species.
As outlined in The Freshwater Trust revegetation monitoring protocol (protocol and
modifications described in Methods III. a.), statistical comparison of percent ground cover across
all transects is necessary to determine project success in keeping invasive species below 25% of
the ground cover. The 2016 Steam Stewardship team found that invasive vegetation only
occupied 12.94% of ground substrate. However, native vegetative ground cover, measured at
13.84%, is not much higher than invasive groundcover. Our team observed that Reed Canary
Grass (Phalaris arundinacea) were becoming more established among the native plantings and
other invasive species. This is reflected in the relative composition of invasive groundcover,
grass like invasives accounted for over half of the total invasive groundcover. We believe that
the other ground substrate category represents the majority of ground cover (at 76.28%) in part
because of dead invasive blackberry vines left behind from mowing and other site preparation in
the planting area. Continued monitoring of the other ground substrate category as is it retaken by
either native or invasive groundcover will be required to ensure invasive vegetative ground cover
remains below 25%.
Stem diversity is another indicator of project success or failure. Project goals
require a native stem density of a minimum of 1600 stems per acre, and a native stem diversity
of minimum five trees and eight shrub species. Data was recorded, within all 6 m square plots
along each transects, regarding the quantity and species code of each stem greater than 15 cm in
height. In this same area, our team recorded the quantity and species code of larger stems with a
DBH greater than 25 cm. Both of these data sets were necessary to draw statistical conclusions
regarding the progression of stem density/diversity.
DBH Measurements
Within the entire area in BWCA sampled by our team, only six different species were
recorded in total having a DBH above 25 cm, this is visualized in Figure 5. However, only 4
species are categorized as trees (ACMA, ALRU, POTR, and SARA), which is below the stem
diversity goals of the project of five tree species. There are young plantings of tree species (i.e.
THPL) which need to reach free to grow status in order to ensure success of this project. The
total number of recorded species also reflects the general composition and uneven species
distribution observed by our team. Some species of a significant DBH only appeared once in
sampled areas, while twenty three Willow trees and nine Black Cottonwoods appeared in the
same sampled area, there was a wide range is totals for each species (Figure 5). Qualitative
observations regarding health of tree planting, recorded during transect narratives, will provide
additional insight into which species of plantings are healthiest and which areas appear to be
better suited for one species rather than another. Total area sampled in BWCA by our team was
3,888 meters squared, which is approximately 0.96 acres.
Recommendations
Methods used in this monitoring project were obtained from the McKenzie River Trust
and included two parts; TFT revegetation monitoring protocol and a photopoint protocol. Based
on our experience with TFT revegetation monitoring protocol, it’s ideal to have 2 people
working on a transect with one recorder and one other to assist in collecting data. While having
more than 2 people will consume more time as it would have a higher likeliness of disagreement
and unnecessary discussion. Moreover, during collecting stem density we found numbers of
plants that were hard to identify due some plants that weren’t mature enough and not represented
on the planting list. Therefore, a plant identification guide and botanical identification keys that
covered all stages of plants in hand would be helpful in future monitoring. The amount of
invasive species present in the site became obstacles for surveyors thus increased the percent
error. Invasive removal program in the area with high level of invasive species would help the
process of monitoring in each transects by creating better access to all points in the plots which
reduce the time it required to be observed. In addition, there were few circumstances that forced
the team to made some changes to the protocol that produce in differences in protocol used in
each transect. we encountered differences in protocol that was used.
Acknowledgments
● Peg Boulay, University of Oregon
We would like to thank our ELP instructor, Peg Boulay, for sharing her expertise
in field work and the invaluable practical experience she has given us. She provided our team
with technical support in the field, and with numerous opportunities to gain hands-on experience
collecting professional field data. She also led workshops which further strengthened our
professional skills.
● Jared Weybright, McKenzie Watershed Council
Jared was very helpful during our work at Berggren Watershed Conservation
Area,visiting us in the field to ensure we were properly following monitoring protocols. Jared’s
expertise of native plants was of great support while in the field, and he taught us many
ways to distinguish many of the young plantings at BWCA.
Literature Cited:
Anderson, J. H., Faulds, P. L., Atlas, W. I., Pess, G. R., Quinn, T. P. 2010. Selection on breeding
date and body size in colonizing coho salmon, Oncorhynchus kisutch. Molecular ecology
19(12): 2562-2573
Budy, P. & Schaller, H. 2007. Evaluating Tributary Restoration Potential for Pacific Salmon
Recovery. Ecological Applications 17(4): 1068-1086
Gonzalez, E., A. Sher, E. Tabacchi, A. Masip, M. Poulin. 2015. Restoration of riparian
vegetation: A global review of implementation and evaluation approaches in the
international, peer-reviewed literature. Journal of Environmental Management DOI:
10.1016/j.jenvman.2015.04.033
Hafs, A. W., Harrison, L. R., Utz, R. M., Dunne, T. 2010. Quantifying the role of woody debris
in providing bioenergetically favorable habitat for juvenile salmon. Ecological Modelling
285(10): 30-38
Appendix
A) Riparian Species index:
● ABGR: Abies grandis (Grand Fir)
● ACCI: Acer circinatum (Vine Maple)
● ACMA: Acer macrophyllum (Bigleaf Maple)
● ALRH: Alnus Rhombifolia (White Alder)
● ALRU: Alnus rubra (Red Alder)
● AMAL: Amelanchier alnifolia (Serviceberry)
● CADE: Calocedrus decurrens (Incense cedar)
● COSE: Cornus sericea (Red Osier Dogwood)
● FRLA: Fraxinus latifolia (Oregon Ash)
● HODI: Holodiscus discolor (Oceanspray)
● LOIN: Lonicera involucrata (Twinberry)
● MAAQ: Mahonia aquifolium (Tall Oregon Grape)
● OECE: Oemleria cerasiformis (Indian Plum)
● PHLE: Philadelphus lewisii (Mock Orange)
● PHCA: Physocarpus capitatus (Ninebark)
● PIPO: Pinus ponderosa (W.v.) (W. Valley Ponderosa Pine)
● POTR: Populus trichocarpa (Black Cottonwood)
● RISA: Ribes sanguineum (Red flowering currant)
● RONU: Rosa nutkana (Nootka Rose)
● ROPI: Rosa pisocarpa (Swamp Rose)
● RUPA: Rubus parviflorus (Thimbleberry)
● SAXX: Salix species (Willow)
● SALA: Salix lasiandra (Pacific Willow)
● SASC: Salix scouleriana (Scouler Willow)
● SASI: Salix sitchensis (Sitka Willow)
● SARA: Sambucus racemosa (Red Elderberry)
● SPDO: Spiraea douglasii (Spiraea)
● SYAL: Symphoriocarpus albus (Snowberry)
● THPL: Thuja plicata (Western Red Cedar)
B) Photopoints (2014 left, 2016 right)
PP1
PP3 E
PP3 W
PP4
PP5
PP6 SE
PP7 W
PP7 E
PP7 S

More Related Content

What's hot

McLellan - The Watershed Approach
McLellan - The Watershed ApproachMcLellan - The Watershed Approach
McLellan - The Watershed Approach
Soil and Water Conservation Society
 
Robyn Sayer - Naturescaping - Restoration Ecology presentation
Robyn Sayer  - Naturescaping - Restoration Ecology presentationRobyn Sayer  - Naturescaping - Restoration Ecology presentation
Robyn Sayer - Naturescaping - Restoration Ecology presentation
Lakeland College
 
Soum rangeland management planning guideline
Soum rangeland management planning guidelineSoum rangeland management planning guideline
Soum rangeland management planning guideline
GreengoldMongolia
 
JVickery&AYarger,VMwWildlifeInMind,COSA20159.15FINAL
JVickery&AYarger,VMwWildlifeInMind,COSA20159.15FINALJVickery&AYarger,VMwWildlifeInMind,COSA20159.15FINAL
JVickery&AYarger,VMwWildlifeInMind,COSA20159.15FINAL
John Vickery
 
Grimaldo_et_al_2004
Grimaldo_et_al_2004Grimaldo_et_al_2004
Grimaldo_et_al_2004
Lenny Grimaldo
 
Watershed management
Watershed managementWatershed management
Watershed management
Tharun Reddy
 
LAND CAPABILITY CLASSIFICATION
LAND CAPABILITY CLASSIFICATIONLAND CAPABILITY CLASSIFICATION
LAND CAPABILITY CLASSIFICATION
debaaaaaaaa
 
Species Diversity and Above-ground Carbon Stock Assessments in Selected Mangr...
Species Diversity and Above-ground Carbon Stock Assessments in Selected Mangr...Species Diversity and Above-ground Carbon Stock Assessments in Selected Mangr...
Species Diversity and Above-ground Carbon Stock Assessments in Selected Mangr...
Innspub Net
 
Watershed characteristics
Watershed characteristicsWatershed characteristics
Watershed characteristics
Rajesh Davulluri
 
Articles about Integrated Roadside Vegetation Management
Articles about Integrated Roadside Vegetation ManagementArticles about Integrated Roadside Vegetation Management
Articles about Integrated Roadside Vegetation Management
Scott C. Zager
 
Trophic downgrading of planet earth
Trophic downgrading of planet earthTrophic downgrading of planet earth
Trophic downgrading of planet earth
Loretta Roberson
 
Gulf hypoxia initiative schwartz
Gulf hypoxia initiative   schwartzGulf hypoxia initiative   schwartz
Gulf hypoxia initiative schwartz
Soil and Water Conservation Society
 
Resource stewardship
Resource stewardshipResource stewardship
Landscape design schwartz
Landscape design   schwartzLandscape design   schwartz
Landscape design schwartz
Soil and Water Conservation Society
 
Robinshin
RobinshinRobinshin
Robinshin
Robin Shin
 
Rainfed agriculture & watershed management
Rainfed agriculture & watershed managementRainfed agriculture & watershed management
Rainfed agriculture & watershed management
Kinshuk Sharma
 
Watershed management
Watershed managementWatershed management
Watershed management
Rashmi Ranjan Moharana
 
Processes and Landforms of the Willamette River and Floodplain
Processes and Landforms of the Willamette River and FloodplainProcesses and Landforms of the Willamette River and Floodplain
Processes and Landforms of the Willamette River and Floodplain
Willamette River Initiative
 
Land use pattern classification
Land use pattern classificationLand use pattern classification
Land use pattern classification
iari
 
Land Suitability Classification
Land Suitability ClassificationLand Suitability Classification
Land Suitability Classification
Risikesh Thakur
 

What's hot (20)

McLellan - The Watershed Approach
McLellan - The Watershed ApproachMcLellan - The Watershed Approach
McLellan - The Watershed Approach
 
Robyn Sayer - Naturescaping - Restoration Ecology presentation
Robyn Sayer  - Naturescaping - Restoration Ecology presentationRobyn Sayer  - Naturescaping - Restoration Ecology presentation
Robyn Sayer - Naturescaping - Restoration Ecology presentation
 
Soum rangeland management planning guideline
Soum rangeland management planning guidelineSoum rangeland management planning guideline
Soum rangeland management planning guideline
 
JVickery&AYarger,VMwWildlifeInMind,COSA20159.15FINAL
JVickery&AYarger,VMwWildlifeInMind,COSA20159.15FINALJVickery&AYarger,VMwWildlifeInMind,COSA20159.15FINAL
JVickery&AYarger,VMwWildlifeInMind,COSA20159.15FINAL
 
Grimaldo_et_al_2004
Grimaldo_et_al_2004Grimaldo_et_al_2004
Grimaldo_et_al_2004
 
Watershed management
Watershed managementWatershed management
Watershed management
 
LAND CAPABILITY CLASSIFICATION
LAND CAPABILITY CLASSIFICATIONLAND CAPABILITY CLASSIFICATION
LAND CAPABILITY CLASSIFICATION
 
Species Diversity and Above-ground Carbon Stock Assessments in Selected Mangr...
Species Diversity and Above-ground Carbon Stock Assessments in Selected Mangr...Species Diversity and Above-ground Carbon Stock Assessments in Selected Mangr...
Species Diversity and Above-ground Carbon Stock Assessments in Selected Mangr...
 
Watershed characteristics
Watershed characteristicsWatershed characteristics
Watershed characteristics
 
Articles about Integrated Roadside Vegetation Management
Articles about Integrated Roadside Vegetation ManagementArticles about Integrated Roadside Vegetation Management
Articles about Integrated Roadside Vegetation Management
 
Trophic downgrading of planet earth
Trophic downgrading of planet earthTrophic downgrading of planet earth
Trophic downgrading of planet earth
 
Gulf hypoxia initiative schwartz
Gulf hypoxia initiative   schwartzGulf hypoxia initiative   schwartz
Gulf hypoxia initiative schwartz
 
Resource stewardship
Resource stewardshipResource stewardship
Resource stewardship
 
Landscape design schwartz
Landscape design   schwartzLandscape design   schwartz
Landscape design schwartz
 
Robinshin
RobinshinRobinshin
Robinshin
 
Rainfed agriculture & watershed management
Rainfed agriculture & watershed managementRainfed agriculture & watershed management
Rainfed agriculture & watershed management
 
Watershed management
Watershed managementWatershed management
Watershed management
 
Processes and Landforms of the Willamette River and Floodplain
Processes and Landforms of the Willamette River and FloodplainProcesses and Landforms of the Willamette River and Floodplain
Processes and Landforms of the Willamette River and Floodplain
 
Land use pattern classification
Land use pattern classificationLand use pattern classification
Land use pattern classification
 
Land Suitability Classification
Land Suitability ClassificationLand Suitability Classification
Land Suitability Classification
 

Viewers also liked

Introduzione ad Arduino Antonio Serra Napoli
Introduzione ad Arduino Antonio Serra NapoliIntroduzione ad Arduino Antonio Serra Napoli
Introduzione ad Arduino Antonio Serra Napoli
Antonio Serra
 
Paleo bread 2016
Paleo bread 2016Paleo bread 2016
Paleo bread 2016
Torsten Fleischer
 
FInal MetLife Powerpoint Presentation[1]
FInal MetLife Powerpoint Presentation[1]FInal MetLife Powerpoint Presentation[1]
FInal MetLife Powerpoint Presentation[1]
Daniel Gruen
 
OCS Profile 2016
OCS Profile 2016OCS Profile 2016
OCS Profile 2016
Nawal Omani
 
verma cv - Copy
verma cv - Copyverma cv - Copy
verma cv - Copy
anurag verma
 
OLAJIDE RESUME1
OLAJIDE RESUME1OLAJIDE RESUME1
OLAJIDE RESUME1
Akinkuade Olajide
 
ank resum (1)
ank resum (1)ank resum (1)
ank resum (1)
Ankush Rathod
 
Executive Series
Executive Series Executive Series
Executive Series
Todd Tabel
 
MICHAEL S
MICHAEL SMICHAEL S
MICHAEL S
Michael Atkins
 
Thesis Final Copy
Thesis Final CopyThesis Final Copy
Thesis Final Copy
Arup Kumar Pal
 
Albertus Conner
Albertus ConnerAlbertus Conner
Albertus Conner
Albertus Conner
 
Sagar Sawalakhe_SoftwareTesting_9 Yrs.Expr_Test Lead
Sagar Sawalakhe_SoftwareTesting_9 Yrs.Expr_Test LeadSagar Sawalakhe_SoftwareTesting_9 Yrs.Expr_Test Lead
Sagar Sawalakhe_SoftwareTesting_9 Yrs.Expr_Test Lead
Sagar Sawalakhe
 
Как построить успешный бизнес на производстве газобетона
Как построить успешный бизнес на производстве газобетонаКак построить успешный бизнес на производстве газобетона
Как построить успешный бизнес на производстве газобетона
АлтайСтройМаш
 

Viewers also liked (13)

Introduzione ad Arduino Antonio Serra Napoli
Introduzione ad Arduino Antonio Serra NapoliIntroduzione ad Arduino Antonio Serra Napoli
Introduzione ad Arduino Antonio Serra Napoli
 
Paleo bread 2016
Paleo bread 2016Paleo bread 2016
Paleo bread 2016
 
FInal MetLife Powerpoint Presentation[1]
FInal MetLife Powerpoint Presentation[1]FInal MetLife Powerpoint Presentation[1]
FInal MetLife Powerpoint Presentation[1]
 
OCS Profile 2016
OCS Profile 2016OCS Profile 2016
OCS Profile 2016
 
verma cv - Copy
verma cv - Copyverma cv - Copy
verma cv - Copy
 
OLAJIDE RESUME1
OLAJIDE RESUME1OLAJIDE RESUME1
OLAJIDE RESUME1
 
ank resum (1)
ank resum (1)ank resum (1)
ank resum (1)
 
Executive Series
Executive Series Executive Series
Executive Series
 
MICHAEL S
MICHAEL SMICHAEL S
MICHAEL S
 
Thesis Final Copy
Thesis Final CopyThesis Final Copy
Thesis Final Copy
 
Albertus Conner
Albertus ConnerAlbertus Conner
Albertus Conner
 
Sagar Sawalakhe_SoftwareTesting_9 Yrs.Expr_Test Lead
Sagar Sawalakhe_SoftwareTesting_9 Yrs.Expr_Test LeadSagar Sawalakhe_SoftwareTesting_9 Yrs.Expr_Test Lead
Sagar Sawalakhe_SoftwareTesting_9 Yrs.Expr_Test Lead
 
Как построить успешный бизнес на производстве газобетона
Как построить успешный бизнес на производстве газобетонаКак построить успешный бизнес на производстве газобетона
Как построить успешный бизнес на производстве газобетона
 

Similar to BerggrenWatershedConservationAreaReport

Albietz article in Tropical Resources Bulletin_2007
Albietz article in Tropical Resources Bulletin_2007Albietz article in Tropical Resources Bulletin_2007
Albietz article in Tropical Resources Bulletin_2007
Jessica Albietz
 
Grant_Cait_FINAL
Grant_Cait_FINALGrant_Cait_FINAL
Grant_Cait_FINAL
Caitlin Grant
 
Murphy_Symposium Poster 70thNE FW
Murphy_Symposium Poster 70thNE FWMurphy_Symposium Poster 70thNE FW
Murphy_Symposium Poster 70thNE FW
Shane Murphy
 
DeerCreekReport
DeerCreekReportDeerCreekReport
DeerCreekReport
Eric Mullen
 
Gjesm150171451593800
Gjesm150171451593800Gjesm150171451593800
Gjesm150171451593800
GJESM Publication
 
3_Linking quarries
3_Linking quarries3_Linking quarries
3_Linking quarries
Roulling
 
Watershed Condition Frameworks by Angela Coleman
Watershed Condition Frameworks by Angela ColemanWatershed Condition Frameworks by Angela Coleman
Watershed Condition Frameworks by Angela Coleman
Southeast Alaska Watershed Coalition
 
Menger Creek Poster
Menger Creek PosterMenger Creek Poster
Menger Creek Poster
Sawyer Williams
 
02. Mendez - Research Proposal
02. Mendez - Research Proposal02. Mendez - Research Proposal
02. Mendez - Research Proposal
Iván Mohedano Méndez
 
DJW Poster Symposium 2016 Complete
DJW Poster Symposium 2016 CompleteDJW Poster Symposium 2016 Complete
DJW Poster Symposium 2016 Complete
Danny Wilson
 
June 2016 Poster
June 2016 PosterJune 2016 Poster
June 2016 Poster
Candon Layton Gardner
 
CZ2011
CZ2011CZ2011
Final jjsms 2 nd edition
Final jjsms 2 nd edition Final jjsms 2 nd edition
Final jjsms 2 nd edition
TSUOER
 
7_PDFsam_FBA_NEWS_70_WINTER_2016
7_PDFsam_FBA_NEWS_70_WINTER_20167_PDFsam_FBA_NEWS_70_WINTER_2016
7_PDFsam_FBA_NEWS_70_WINTER_2016
Alex Seeney
 
Status of seagrass ecosystem in Kauswagan, Lanao Del Norte and Laguindingan, ...
Status of seagrass ecosystem in Kauswagan, Lanao Del Norte and Laguindingan, ...Status of seagrass ecosystem in Kauswagan, Lanao Del Norte and Laguindingan, ...
Status of seagrass ecosystem in Kauswagan, Lanao Del Norte and Laguindingan, ...
Innspub Net
 
Aquatic Insect Similarity Connecting Natural Wetland Habitat and Ricefield fo...
Aquatic Insect Similarity Connecting Natural Wetland Habitat and Ricefield fo...Aquatic Insect Similarity Connecting Natural Wetland Habitat and Ricefield fo...
Aquatic Insect Similarity Connecting Natural Wetland Habitat and Ricefield fo...
Innspub Net
 
FINAL_SURPS_POSTER_
FINAL_SURPS_POSTER_FINAL_SURPS_POSTER_
FINAL_SURPS_POSTER_
Corinna Brendel
 
Paper - Landscape Change Over 60 Years Surrounding Cedarburg Bog
Paper - Landscape Change Over 60 Years Surrounding Cedarburg BogPaper - Landscape Change Over 60 Years Surrounding Cedarburg Bog
Paper - Landscape Change Over 60 Years Surrounding Cedarburg Bog
Jason Schroeder
 
Masters Project
Masters ProjectMasters Project
Masters Project
Mary Warwick
 
WaterQualityReportCard1215152
WaterQualityReportCard1215152WaterQualityReportCard1215152
WaterQualityReportCard1215152
Laura Kelm
 

Similar to BerggrenWatershedConservationAreaReport (20)

Albietz article in Tropical Resources Bulletin_2007
Albietz article in Tropical Resources Bulletin_2007Albietz article in Tropical Resources Bulletin_2007
Albietz article in Tropical Resources Bulletin_2007
 
Grant_Cait_FINAL
Grant_Cait_FINALGrant_Cait_FINAL
Grant_Cait_FINAL
 
Murphy_Symposium Poster 70thNE FW
Murphy_Symposium Poster 70thNE FWMurphy_Symposium Poster 70thNE FW
Murphy_Symposium Poster 70thNE FW
 
DeerCreekReport
DeerCreekReportDeerCreekReport
DeerCreekReport
 
Gjesm150171451593800
Gjesm150171451593800Gjesm150171451593800
Gjesm150171451593800
 
3_Linking quarries
3_Linking quarries3_Linking quarries
3_Linking quarries
 
Watershed Condition Frameworks by Angela Coleman
Watershed Condition Frameworks by Angela ColemanWatershed Condition Frameworks by Angela Coleman
Watershed Condition Frameworks by Angela Coleman
 
Menger Creek Poster
Menger Creek PosterMenger Creek Poster
Menger Creek Poster
 
02. Mendez - Research Proposal
02. Mendez - Research Proposal02. Mendez - Research Proposal
02. Mendez - Research Proposal
 
DJW Poster Symposium 2016 Complete
DJW Poster Symposium 2016 CompleteDJW Poster Symposium 2016 Complete
DJW Poster Symposium 2016 Complete
 
June 2016 Poster
June 2016 PosterJune 2016 Poster
June 2016 Poster
 
CZ2011
CZ2011CZ2011
CZ2011
 
Final jjsms 2 nd edition
Final jjsms 2 nd edition Final jjsms 2 nd edition
Final jjsms 2 nd edition
 
7_PDFsam_FBA_NEWS_70_WINTER_2016
7_PDFsam_FBA_NEWS_70_WINTER_20167_PDFsam_FBA_NEWS_70_WINTER_2016
7_PDFsam_FBA_NEWS_70_WINTER_2016
 
Status of seagrass ecosystem in Kauswagan, Lanao Del Norte and Laguindingan, ...
Status of seagrass ecosystem in Kauswagan, Lanao Del Norte and Laguindingan, ...Status of seagrass ecosystem in Kauswagan, Lanao Del Norte and Laguindingan, ...
Status of seagrass ecosystem in Kauswagan, Lanao Del Norte and Laguindingan, ...
 
Aquatic Insect Similarity Connecting Natural Wetland Habitat and Ricefield fo...
Aquatic Insect Similarity Connecting Natural Wetland Habitat and Ricefield fo...Aquatic Insect Similarity Connecting Natural Wetland Habitat and Ricefield fo...
Aquatic Insect Similarity Connecting Natural Wetland Habitat and Ricefield fo...
 
FINAL_SURPS_POSTER_
FINAL_SURPS_POSTER_FINAL_SURPS_POSTER_
FINAL_SURPS_POSTER_
 
Paper - Landscape Change Over 60 Years Surrounding Cedarburg Bog
Paper - Landscape Change Over 60 Years Surrounding Cedarburg BogPaper - Landscape Change Over 60 Years Surrounding Cedarburg Bog
Paper - Landscape Change Over 60 Years Surrounding Cedarburg Bog
 
Masters Project
Masters ProjectMasters Project
Masters Project
 
WaterQualityReportCard1215152
WaterQualityReportCard1215152WaterQualityReportCard1215152
WaterQualityReportCard1215152
 

BerggrenWatershedConservationAreaReport

  • 1. Riparian Revegetation Monitoring at Berggren Watershed Conservation Area Stream Stewardship 2016 Daniel Baldwin Rachel Berner Frian Mardhani Eric Mullen Jacqueline Vasquez Natasha Wibawa University of Oregon Environmental Leadership Program Spring 2016 Abstract: The 2016 Stream Stewardship team conducted monitoring of Berggren Watershed Conservation Area (BWCA), a restoration site in the lower McKenzie watershed, implemented through the McKenzie Watershed Council. BWCA was planted in an effort to restore the riparian area adjacent to the McKenzie. Our team collected data on 15 transects within the planted area and found mostly thatch, bare earth, and, moss, with roughly the same amounts of planted and invasive species. Our data indicate that the proportion of invasives has decreased since 2015, showing that restoration efforts are being met with success at this site.
  • 2. Introduction A great number of stream and floodplain habitats have seen decreased water quality and ecosystem function in the wake of development and land use changes. In the Pacific Northwest, degraded aquatic habitats and water quality are attributed to unsustainable agriculture and grazing practices, dam construction, timber harvest, and removal of large wood from waterways (Anderson et al. 2010; Gonzalez et al. 2015; Hafs et al. 2014). Salmonid populations face a number of threats; one of the most significant is loss of spawning and early life habitat. Chinook salmon (Oncorhynchus tshawytscha) are native to the waterways of the Pacific Northwest, and serve as an excellent indicator of the ecological health of a river or tributary. There are considerable efforts in the Pacific Northwest to monitor, preserve, and restore these populations. The Berggren Watershed Conservation Project aims to restore the riparian ecosystem by increasing plant diversity, the width of riparian buffer zone, and increasing total revegetated area by a minimum of 50%. To achieve these goals, riparian plantings have been implemented to increase native plant recruitment and ground cover. Species were chosen to recreate diverse plant communities that historically existed in the Mckenzie Watershed - these species are marked by their attractiveness to native pollinators and ability to tolerate dramatic seasonal changes in precipitation and temperature. Native vegetation stem density is projected to be 1,600 stems per acre, and the diversity of stems at a minimum of five tree species and eight shrubs species. As stated by the McKenzie Watershed Council in 2002, their mission includes restoring, protecting, and connecting key upland and floodplain habitats. The plantings serve as both an extension of that mission, as well as an excellent tool to educate the public regarding the importance of maintaining natural ecosystems and biodiversity. The project aims to convert a
  • 3. portion of floodway farm fields to native riparian forest, creating a vegetation buffer that enhances habitat for fish and wildlife and attracts native pollinators to the area. Study Area Berggren Watershed Conservation Area is located near Springfield between river mile 19 and 20 of the Mckenzie River on the north bank (Figure 1).The reach containing BWCA has been identified for conservation three times since the year 2000. Figure 1: Aerial map of entire BWCA site (source: McKenzie Watershed Council) The Mckenzie River Trust purchased BWCA in 2002 with the support of the Bonneville Power Administration. The site features a diverse network of side channels, relatively isolated floodplain pools, and stands of dense floodplain forest. These channels provide spawning,
  • 4. rearing, and refuge habitat for native fish species including Chinook salmon and Oregon chub. A 2012 survey also found red-legged frogs and northwest salamanders. The establishment of invasive species and associated lack of diverse native plant communities in an increasingly restricted riparian corridor is a significant problem at BWCA. Intermittent grazing, tractor mowing, and timber harvest have all negatively impacted the hydrology of the site. On a basin-wide scale, dam related flood control has reduced flood frequency and intensity at BWCA, in turn reducing its connectivity with the McKenzie River. Because salmon will attempt to colonize almost any area which is accessible via a waterway (Anderson et al. 2010), all potential restoration sites must be evaluated based upon their associated benefit and risk of failure to salmon populations, given the quality or quantity of resources used (Budy & Schaller 2007). The McKenzie River Subbasin Assessment in 2000 first identified the reach containing the BWCA as a fish habitat conservation priority, and it was again highlighted by the McKenzie River Watershed Conservation Strategy in 2002, this time with a focus on the enhancement of floodplain forests and aquatic habitat (BWCA Riparian Enhancement Phase II). Methods TFT RevegetationMonitoring Protocol Our team used a modified version of the Freshwater Trust (TFT) Revegetation Monitoring Protocol for Water Quality Trading Projects to measure vegetation at BWCA. We
  • 5. recreated past transects drawn by Stream Stewardship 2015 using compass bearings and GPS. Transects were drawn roughly perpendicularly to the McKenzie river, starting at the toe of the riparian zone and marked with flagging tape. They were placed with the target sampling goal of at least 5% of the planted area, to allow extrapolation to the entire planting area. Figure 1: Google Earth imagery of four of the fifteen transects monitored by Stream Stewardship 2016. Start and end points are GPS waypoints also taken by the 2016 Stream Stewardship team. Plots with 6m2 dimensions were centered on each transect, with 6m separating each plot. Within these plots our team recorded data on the stem density of natural and planted native vegetation as well as invasive species. Stem counts by species code made in these sample plots were necessary to test success of project goals for stem density (minimum of 1,600 stems per acre) and stem diversity (minimum of five tree and eight shrub species). Across all transects and including all 6m2 plots, our team sampled 3,888 square meters of BWCA. For more detailed sampling of ground cover, our team placed two 1m x 1m quadrats within the 6m square plots, both 1m from opposite ends of the plot boundary, as well as adjacent to and on opposite sides of the transect line. Placement on the left or right side of transect length was randomized to reduce selection bias to the surrounding 6 m x 6 m plot. Our team recorded percent ground cover of native vegetation, invasive vegetation (categorized as herbaceous, woody, or grassy), as well as other ground subrate (bare ground, thatch, mosses, etc.). Addition observations were made on standing water, growth of invasive species, and health or planting performance. We sketched a map for each of the transect layouts, including important features and the hydrological zones present. TFT protocol divides riparian areas into five zones: toe, bank, overbank, transition, and upland.
  • 7. Figure 2: Photopoint example between 2014 pre-treatment (left) and 2016 post-treatment (right) We followed the United States Forest Service (USFS) photopoint protocol to monitor the growth of plantings and reduction in invasive plant cover at the Berggren Watershed Conservation Area (BWCA). We took photographs at previously established photo points within BWCA to observe trends in vegetation vitality and composition. Native shrubs and trees were reintroduced as a means of restoring the riparian habitat by the McKenzie Watershed Council. The photographs taken by the Council were used to determine the location, scale and direction of each new photopoint. These photos provide a side-by-side comparison with the 2015 pre- treatment vegetation sampling and advise future monitoring of riparian revegetation at the site. Photopoint data from 2015 was not collected, so there will be a one year gap in photopoint trend monitoring for this site. Nevertheless, thorough photopoint monitoring is useful as it helps to visualize the changes in the area over time, and types of vegetation that are present. Results: Subplot Data
  • 8. Figure 3: Subplot data for each transect representing percent ground cover of native vegetation, invasives, and other ground substrate. Subplot measurements were taken within 1 m x 1 m quadrats.
  • 9. Figure 4: Percent cover across all transects of non-invasive vegetation, other ground substrate, woody invasives, grassy invasives, and herbaceous invasives. Native vegetation included Bedstraw (Galium aparine), Nipplewort (Lapsana communis), Lamb’s Ear (Stachys byzantia), and Wild Cucumber (Marah oreganus). The dominant woody invasive species represented is Himalayan Blackberry (Rubus armeniacus). The dominant grassy invasive species is reed canarygrass (Phalaris arundinacea) and pasture grass. The dominant Herbaceous Invasive species is St. Robert’s wort (Geranium robertianum) Other ground substrate consists of bare earth, thatch, mosses, and native graminoids.
  • 10. Plot Data Figure 5: Quantity of each tree species found within all 6m x 6m plots
  • 12. Figure 6. Ground cover representation of each species surveyed during stem density monitoring. Species include invasives,natives,and plantings across all transects. Invasive Himalayan Blackberry (RUXX) had the highest number of stems at 47% of the total number of stems counted. The second highest was native Snowberry (SYAL) at 10%. Native Willow species (SAXX) and Black Cottonwood (POTR) were tied for 3rd highest representation at 6% of total stems. Species represented as 0% were present but contributed to total stem density much less compared to other species. Across the planted area, our data showed 14.7% groundcover of native species 10.13% groundcover of invasives. Figure 7: Totals for stems of each species across the entire sampled area of 3,888 square meters. This graph’s Y- axis has been logarithmically scaled so that smaller values are visible. Stream stewardship 2016 found 687 native stems per acre, and the 2015 team found 365 stems per acre. There was an 88.23% increase in native stem density from 2015 to 2016. Monitoring of invasive Himalayan Blackberry (RUXX) began in 2016 thus invasive stem density
  • 13. was not included in stem density comparison between 2015 and 2016. Discussion Transects surveyed at BWCA were used to assess the broader planting area. Funding and time resources disallow for complete census data in the planting area, even for readily recognizable pieces of data such as trees large enough to receive a DBH (Diameter at Breast Height) measurement. Figure 3 (subplot data) clearly shows that ground cover at the time of our sampling is rather variable across all transects, yet certain qualities hold true in all transects, such that other ground substrate makes up the majority of ground cover, and native vegetative ground cover is usually the second highest category. Transect 1 & 15 in Figure 3 show areas in which invasive are currently outcompeting native species, and future intervention may be necessary to prevent invasive domination of ground cover. In contrast, our analysis indicate that in transects 9, 11, and 14, native vegetation is successfully outcompeting invasives at time of our sampling. If additional removal and suppression of invasive vegetation is required in the future, it is important for managers to know which areas are most likely to experience pressure from invasive species. As outlined in The Freshwater Trust revegetation monitoring protocol (protocol and modifications described in Methods III. a.), statistical comparison of percent ground cover across all transects is necessary to determine project success in keeping invasive species below 25% of the ground cover. The 2016 Steam Stewardship team found that invasive vegetation only occupied 12.94% of ground substrate. However, native vegetative ground cover, measured at 13.84%, is not much higher than invasive groundcover. Our team observed that Reed Canary Grass (Phalaris arundinacea) were becoming more established among the native plantings and
  • 14. other invasive species. This is reflected in the relative composition of invasive groundcover, grass like invasives accounted for over half of the total invasive groundcover. We believe that the other ground substrate category represents the majority of ground cover (at 76.28%) in part because of dead invasive blackberry vines left behind from mowing and other site preparation in the planting area. Continued monitoring of the other ground substrate category as is it retaken by either native or invasive groundcover will be required to ensure invasive vegetative ground cover remains below 25%. Stem diversity is another indicator of project success or failure. Project goals require a native stem density of a minimum of 1600 stems per acre, and a native stem diversity of minimum five trees and eight shrub species. Data was recorded, within all 6 m square plots along each transects, regarding the quantity and species code of each stem greater than 15 cm in height. In this same area, our team recorded the quantity and species code of larger stems with a DBH greater than 25 cm. Both of these data sets were necessary to draw statistical conclusions regarding the progression of stem density/diversity. DBH Measurements Within the entire area in BWCA sampled by our team, only six different species were recorded in total having a DBH above 25 cm, this is visualized in Figure 5. However, only 4 species are categorized as trees (ACMA, ALRU, POTR, and SARA), which is below the stem diversity goals of the project of five tree species. There are young plantings of tree species (i.e. THPL) which need to reach free to grow status in order to ensure success of this project. The total number of recorded species also reflects the general composition and uneven species distribution observed by our team. Some species of a significant DBH only appeared once in
  • 15. sampled areas, while twenty three Willow trees and nine Black Cottonwoods appeared in the same sampled area, there was a wide range is totals for each species (Figure 5). Qualitative observations regarding health of tree planting, recorded during transect narratives, will provide additional insight into which species of plantings are healthiest and which areas appear to be better suited for one species rather than another. Total area sampled in BWCA by our team was 3,888 meters squared, which is approximately 0.96 acres. Recommendations Methods used in this monitoring project were obtained from the McKenzie River Trust and included two parts; TFT revegetation monitoring protocol and a photopoint protocol. Based on our experience with TFT revegetation monitoring protocol, it’s ideal to have 2 people working on a transect with one recorder and one other to assist in collecting data. While having more than 2 people will consume more time as it would have a higher likeliness of disagreement and unnecessary discussion. Moreover, during collecting stem density we found numbers of plants that were hard to identify due some plants that weren’t mature enough and not represented on the planting list. Therefore, a plant identification guide and botanical identification keys that covered all stages of plants in hand would be helpful in future monitoring. The amount of invasive species present in the site became obstacles for surveyors thus increased the percent error. Invasive removal program in the area with high level of invasive species would help the process of monitoring in each transects by creating better access to all points in the plots which reduce the time it required to be observed. In addition, there were few circumstances that forced the team to made some changes to the protocol that produce in differences in protocol used in each transect. we encountered differences in protocol that was used.
  • 16. Acknowledgments ● Peg Boulay, University of Oregon We would like to thank our ELP instructor, Peg Boulay, for sharing her expertise in field work and the invaluable practical experience she has given us. She provided our team with technical support in the field, and with numerous opportunities to gain hands-on experience collecting professional field data. She also led workshops which further strengthened our professional skills. ● Jared Weybright, McKenzie Watershed Council Jared was very helpful during our work at Berggren Watershed Conservation Area,visiting us in the field to ensure we were properly following monitoring protocols. Jared’s expertise of native plants was of great support while in the field, and he taught us many ways to distinguish many of the young plantings at BWCA. Literature Cited: Anderson, J. H., Faulds, P. L., Atlas, W. I., Pess, G. R., Quinn, T. P. 2010. Selection on breeding date and body size in colonizing coho salmon, Oncorhynchus kisutch. Molecular ecology 19(12): 2562-2573 Budy, P. & Schaller, H. 2007. Evaluating Tributary Restoration Potential for Pacific Salmon Recovery. Ecological Applications 17(4): 1068-1086
  • 17. Gonzalez, E., A. Sher, E. Tabacchi, A. Masip, M. Poulin. 2015. Restoration of riparian vegetation: A global review of implementation and evaluation approaches in the international, peer-reviewed literature. Journal of Environmental Management DOI: 10.1016/j.jenvman.2015.04.033 Hafs, A. W., Harrison, L. R., Utz, R. M., Dunne, T. 2010. Quantifying the role of woody debris in providing bioenergetically favorable habitat for juvenile salmon. Ecological Modelling 285(10): 30-38
  • 18. Appendix A) Riparian Species index: ● ABGR: Abies grandis (Grand Fir) ● ACCI: Acer circinatum (Vine Maple) ● ACMA: Acer macrophyllum (Bigleaf Maple) ● ALRH: Alnus Rhombifolia (White Alder) ● ALRU: Alnus rubra (Red Alder) ● AMAL: Amelanchier alnifolia (Serviceberry) ● CADE: Calocedrus decurrens (Incense cedar) ● COSE: Cornus sericea (Red Osier Dogwood) ● FRLA: Fraxinus latifolia (Oregon Ash) ● HODI: Holodiscus discolor (Oceanspray) ● LOIN: Lonicera involucrata (Twinberry) ● MAAQ: Mahonia aquifolium (Tall Oregon Grape) ● OECE: Oemleria cerasiformis (Indian Plum) ● PHLE: Philadelphus lewisii (Mock Orange) ● PHCA: Physocarpus capitatus (Ninebark) ● PIPO: Pinus ponderosa (W.v.) (W. Valley Ponderosa Pine) ● POTR: Populus trichocarpa (Black Cottonwood) ● RISA: Ribes sanguineum (Red flowering currant) ● RONU: Rosa nutkana (Nootka Rose) ● ROPI: Rosa pisocarpa (Swamp Rose) ● RUPA: Rubus parviflorus (Thimbleberry) ● SAXX: Salix species (Willow) ● SALA: Salix lasiandra (Pacific Willow) ● SASC: Salix scouleriana (Scouler Willow) ● SASI: Salix sitchensis (Sitka Willow) ● SARA: Sambucus racemosa (Red Elderberry)
  • 19. ● SPDO: Spiraea douglasii (Spiraea) ● SYAL: Symphoriocarpus albus (Snowberry) ● THPL: Thuja plicata (Western Red Cedar) B) Photopoints (2014 left, 2016 right) PP1 PP3 E
  • 22. PP7 S