This thesis assesses the food security status of households receiving support from the Productive Safety Net Program (PSNP) in Libokemkem woreda, South Gondar zone of Ethiopia. Data was collected through surveys of 144 households across two kebeles. Key findings include: 1) 86.25% of households were found to be food insecure; 2) Chronic malnutrition, as measured by stunting, affected 62 children under 5 years of age; and 3) Significant determinants of food insecurity were found to be larger family size, smaller amounts of cultivable and irrigated land, and greater distance to market. Recommendations focus on improving agricultural productivity, diversifying livelihoods, and linking
In this document
Powered by AI
Introduction to the thesis on food security in Ethiopia focusing on PSNP households; outlines objectives, methodology, and main findings.
Discusses food insecurity, malnutrition rates, and contributing factors such as poverty, and low agricultural productivity.
Identifies research gaps regarding food security and nutrition in PSNP households; outlines general and specific objectives.
Poses questions on food security and malnutrition; hypothesizes correlations between various factors affecting food security.
Presents a framework illustrating the relationship between food security, resources, demographics, and nutrition status.
Details methodology, including selection of study area, sample size determination, data sources, and analysis techniques.
Presents findings on food security status, stunting rates, coping strategies, and determinants influencing food security.
Suggests development interventions focusing on livelihoods, women's empowerment, targeted nutrition support, and linking cash transfers.
Conclusion and gratitude for attention during the thesis defense.
Masters Thesis Defense
Assessmentof food security status of PSNP beneficiary
households in Ethiopia: The case of Libokemkem woreda,
south Gondar zone.
Supervisor of thesis: Dr.Temesgen Tilahun
Behailu Shewangizaw
September, 2015
2.
OUTLINE
Introduction
Background andstatement of the problem
Objectives of the study
Conceptual Framework
Methodology
Selection of the study area
Data type and source
Method of data collection
Sample size and sampling procedure
Model specification and method of data analysis
Major Findings
Household food security status
Stunting (chronic malnutrition)
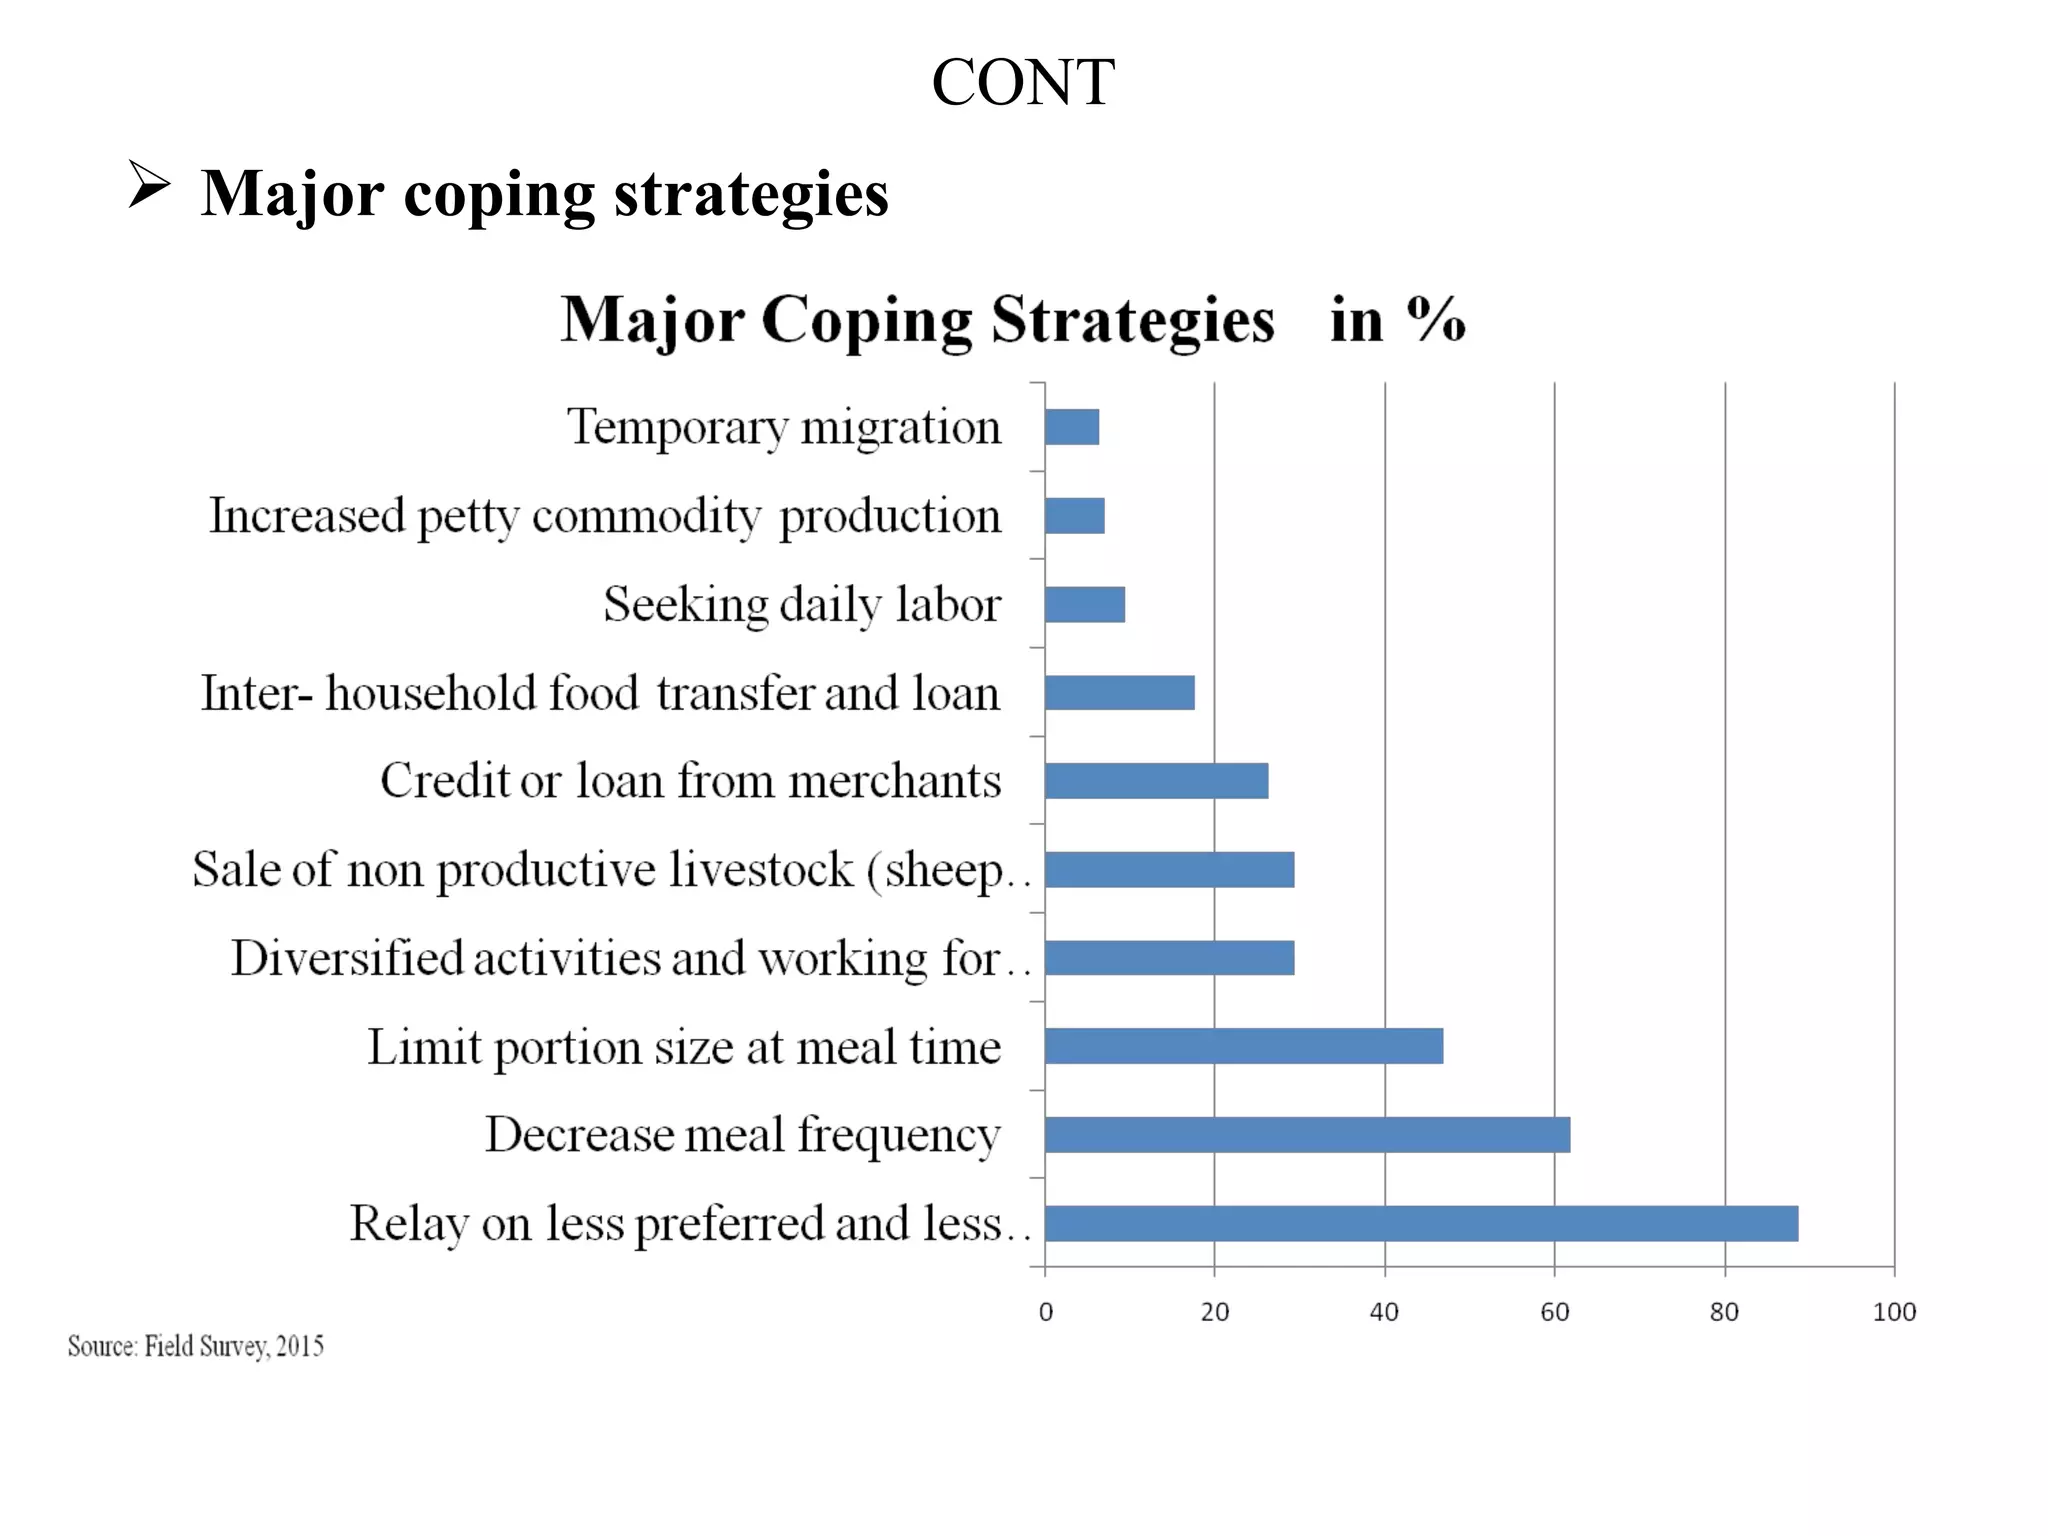
Major coping strategies
Determinants of household food security
Conclusion
Recommendation
3.
INTRODUCTION
Food securityrecently applied to community, local,
household & individual level (Foster 1992).
Necessity to include nutrition into food security
evolved over time (Quisumbing 1995) .
Food insecurity, malnutrition and vulnerability remain
high in Ethiopia (WB 2014):
29 % absolute poor,
44 % suffer from chronic malnutrition, and
43 % vulnerable to absolute poverty.
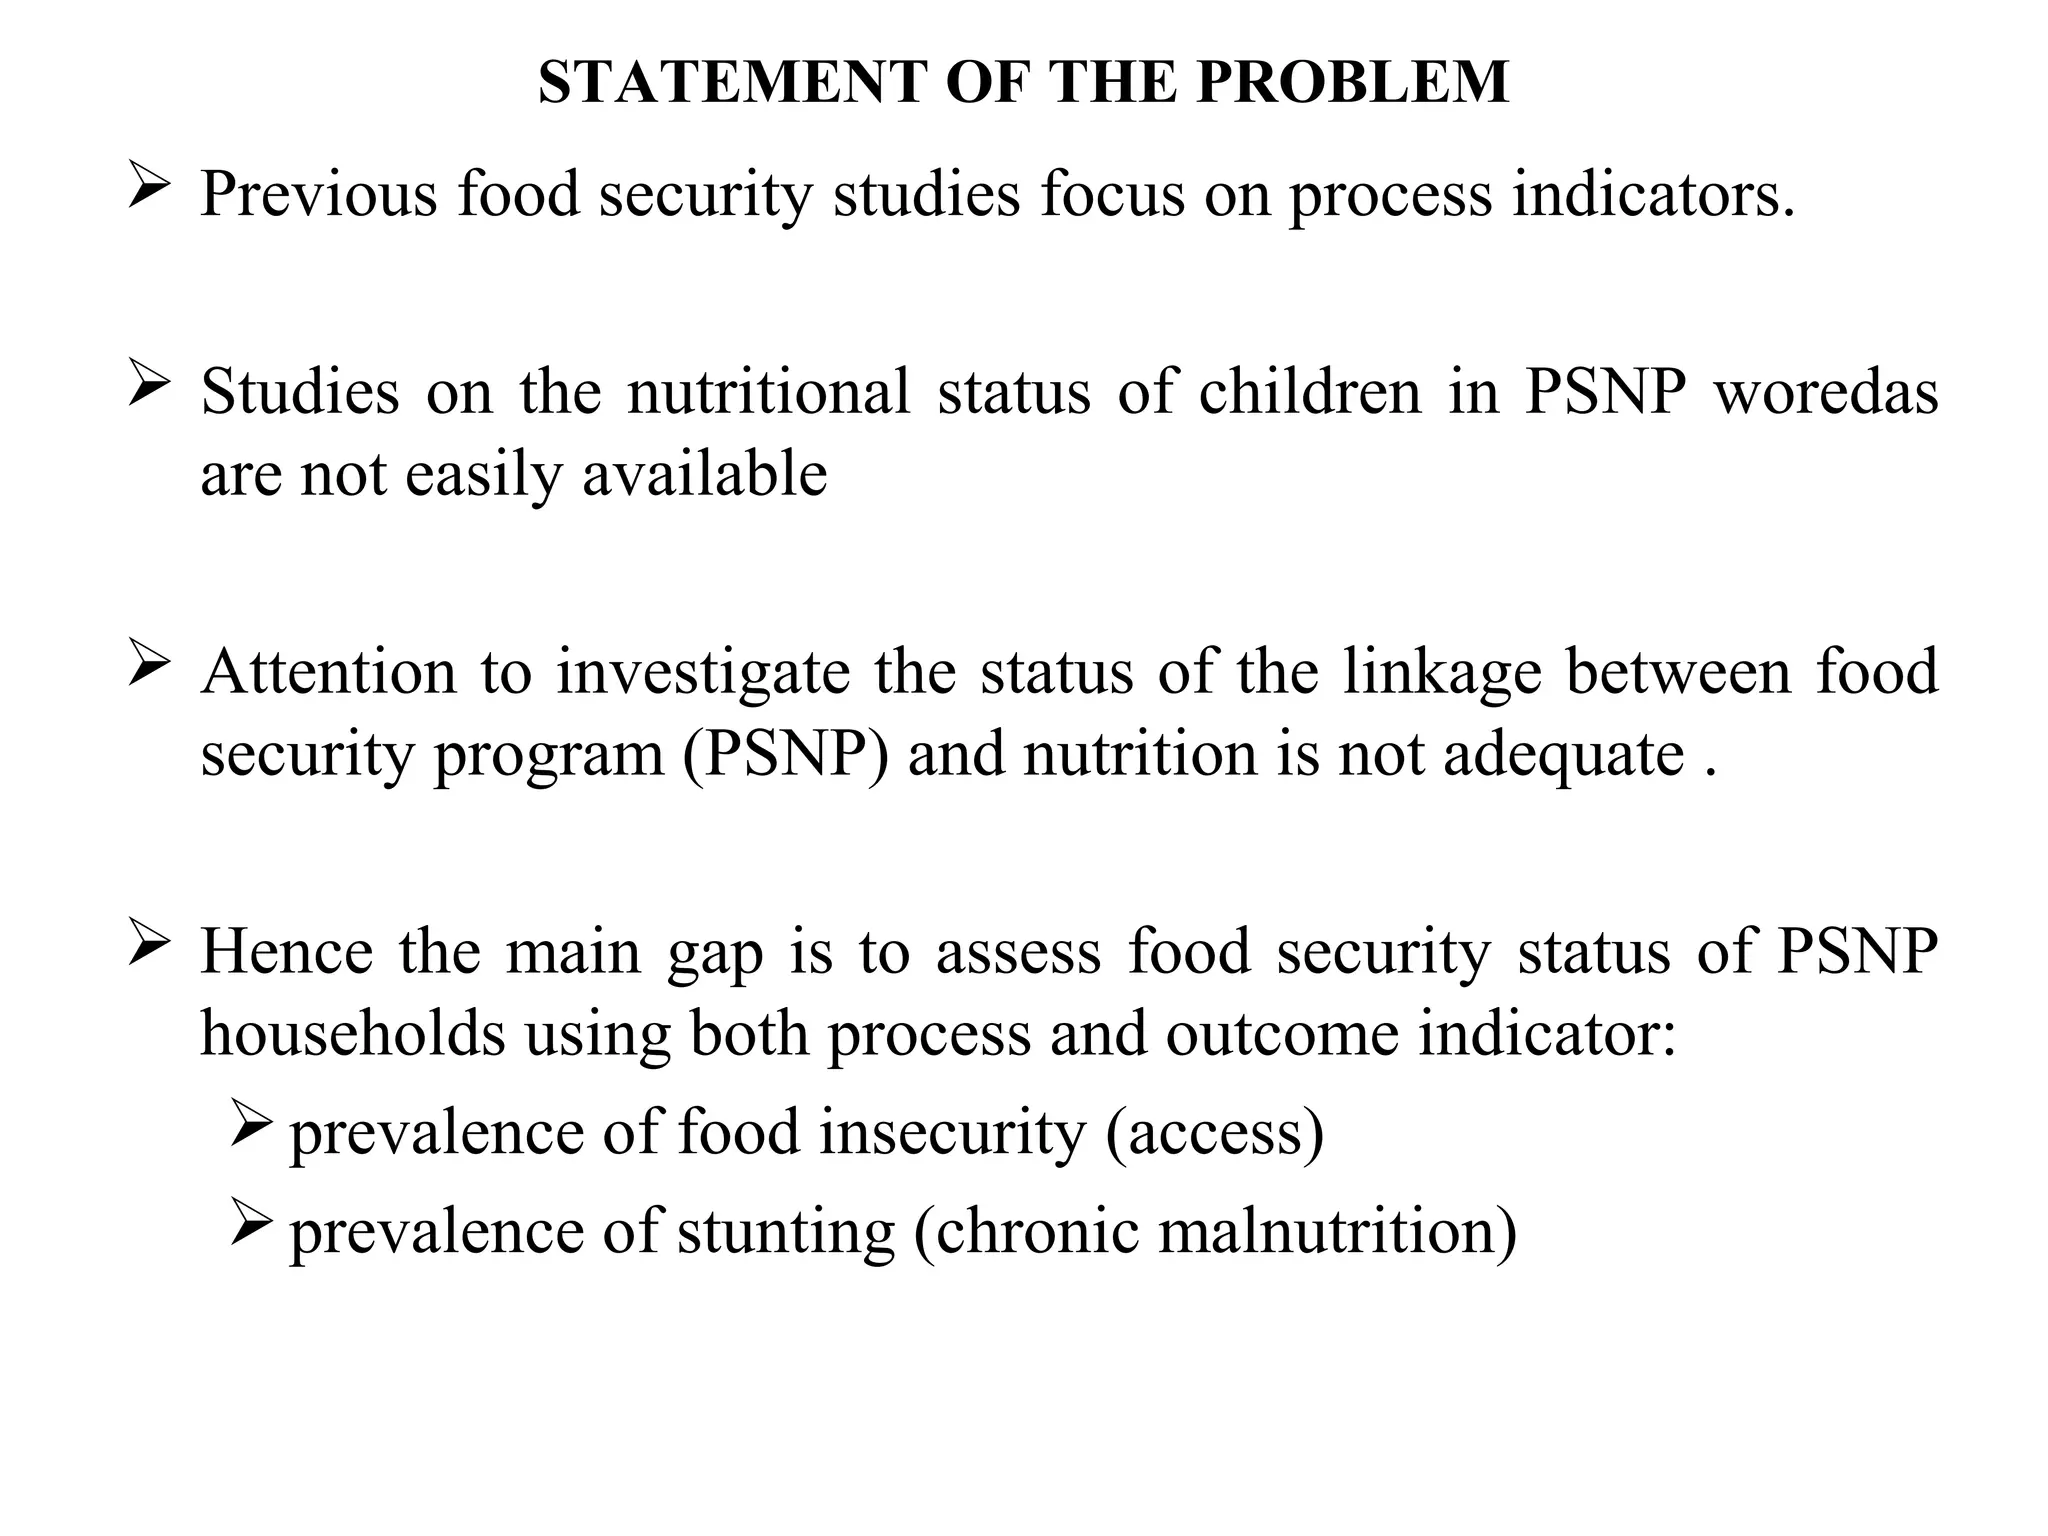
STATEMENT OF THEPROBLEM
Previous food security studies focus on process indicators.
Studies on the nutritional status of children in PSNP woredas
are not easily available
Attention to investigate the status of the linkage between food
security program (PSNP) and nutrition is not adequate .
Hence the main gap is to assess food security status of PSNP
households using both process and outcome indicator:
prevalence of food insecurity (access)
prevalence of stunting (chronic malnutrition)
6.
OBJECTIVE OF THESTUDY
General Objective
to assess the food security status of the PSNP beneficiary
households in Libokemkem district.
Specific Objective
measurement of prevalence of household food insecurity
(access);
measurement of prevalence of stunting (chronic malnutrition);
determinants of food insecurity;
identify household coping strategies.
7.
RESEARCH QUESTIONS
Whatdoes the PSNP beneficiary household food security (access
to food) status look like in the study area?
What does the chronic malnutrition (stunting) rate of children
under five look like in the area?
What are the factors affecting food security situation in the area?
What are the main coping strategies in food shortage situation?
8.
HYPOTHESES
Household foodsecurity status has a positive correlation with :-
use of chemical fertilizer,
market distance,
annual income,
plough oxen,
TLU,
size of cultivated land, and
size of irrigated land;
while it is negatively associated with family size .
9.
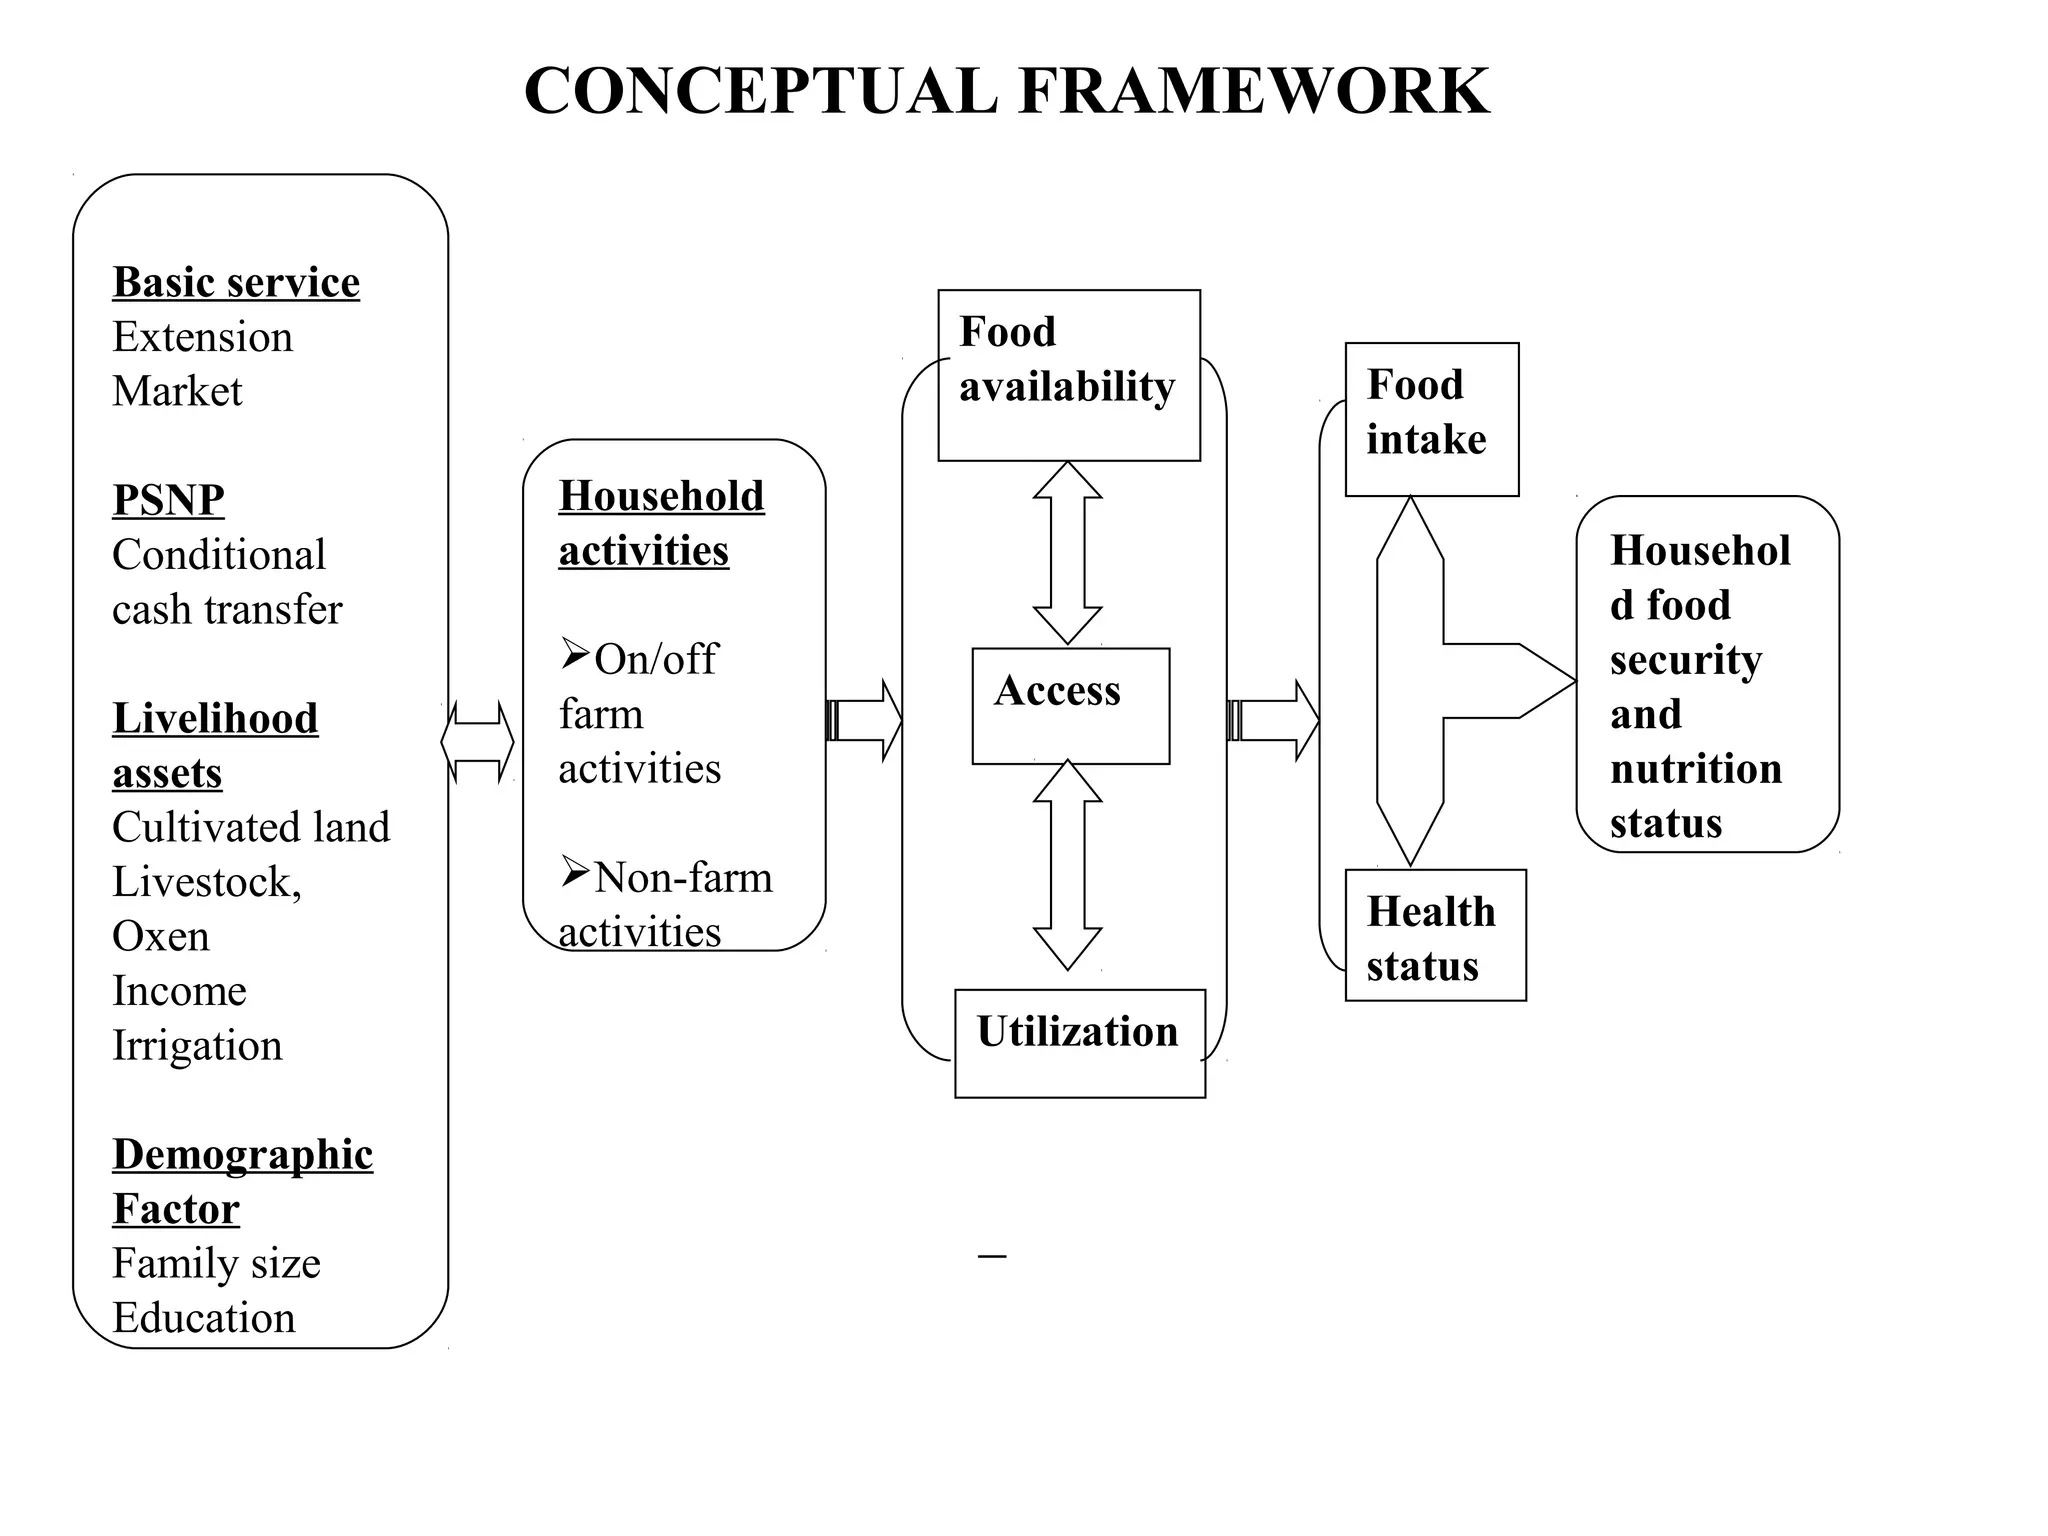
CONCEPTUAL FRAMEWORK
Basic service
Extension
Market
PSNP
Conditional
cashtransfer
Livelihood
assets
Cultivated land
Livestock,
Oxen
Income
Irrigation
Demographic
Factor
Family size
Education
Household
activities
On/off
farm
activities
Non-farm
activities
Access
Food
availability
Utilization
Househol
d food
security
and
nutrition
status
Food
intake
Health
status
10.
METHODOLOGY
Selection ofstudy area
selection of Libokemkem district was purposive:
CFI districts [targeted by PSNP program];
frequent visit RRM (Rapid Response Mechanism)
Data source; Ethiopian mapping agency
11.
CONT.
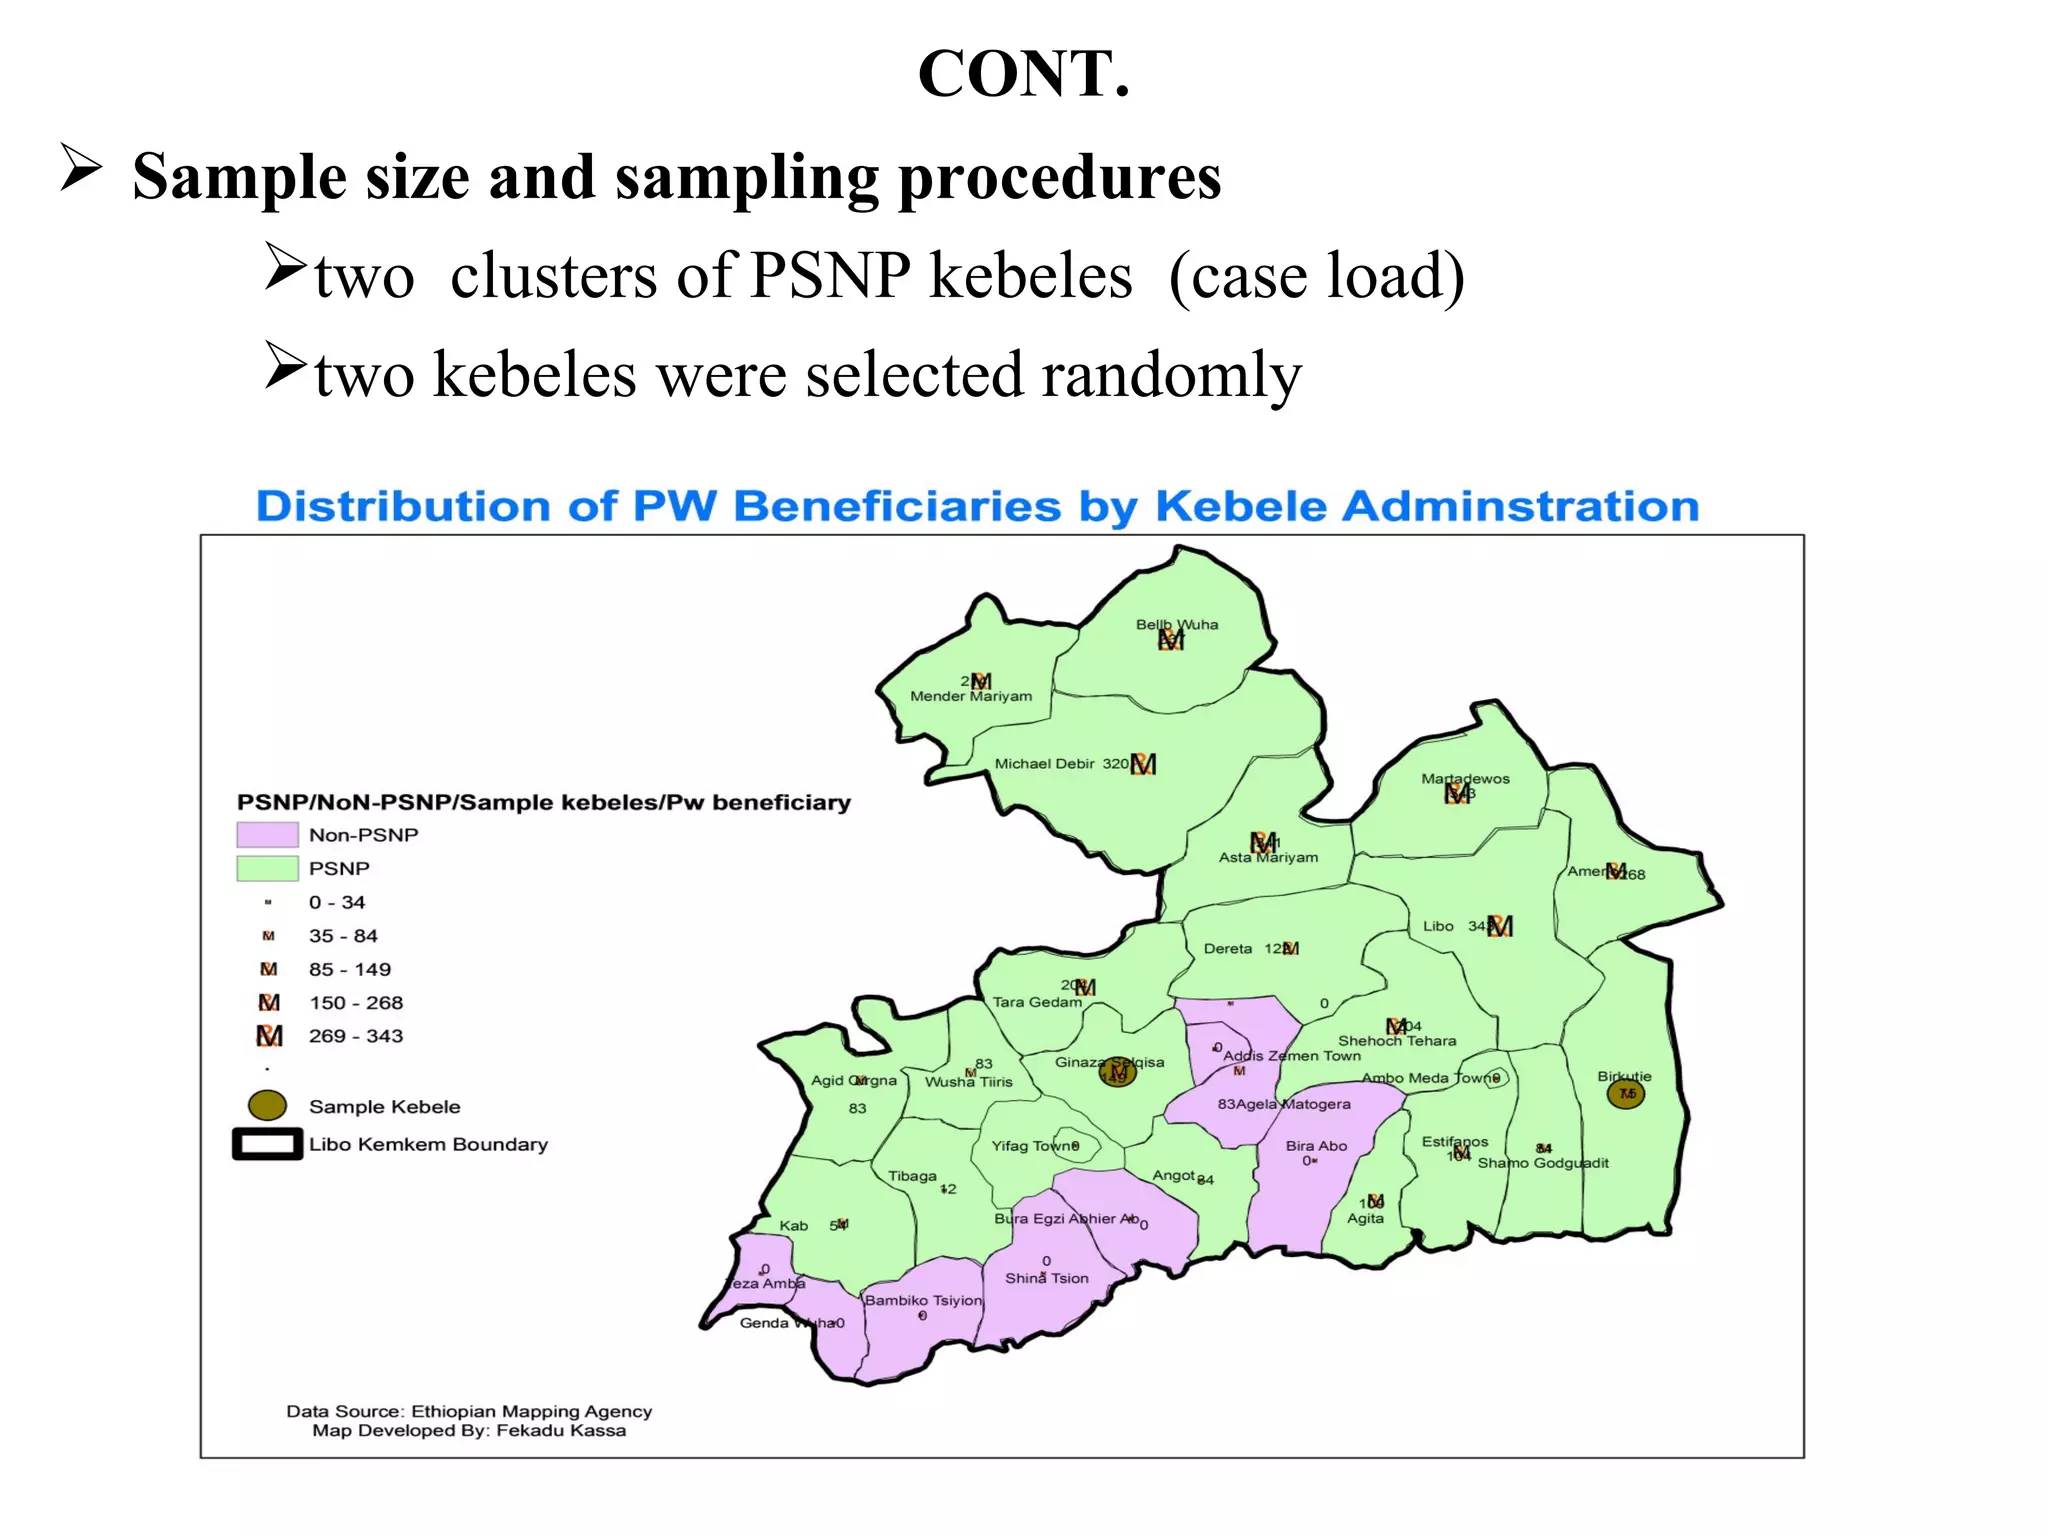
Sample sizeand sampling procedures
two clusters of PSNP kebeles (case load)
two kebeles were selected randomly
12.
CONT.
sample size (Yamane1967):-n = N/1+N*(e)²
Where: n- sample size, N -population size, e –sampling error (5%)
however, sample size scaled up to 171 (all pw in Birkute)
increase number of child
manageable
finally systemic random sampling to select respondents
Sample Kebeles Total PW - HH Sample size (PPS)
Ginazana Selqisa 149 96
Birkute 75 48
Total 224 144
13.
CONT.
Data type
Quantitative; &
Qualitative .
Data source.
Primary;
Secondary.
Data collection methods:
Household survey questionnaire;
Focus group discussion;
Key informant interview;
Observation; &
Analysis of relevant documents.
14.
CONT.
Model specificationand analysis
Household Food Insecurity Access Scale (HFIAS):
to measure household food insecurity status
Child Anthropometry:
to measure stunting (chronic malnutrition) status
Multiple Logistic Regression Model: flexible and easily used
function; meaningful interpretation, and simpler in estimation
(Nelson 1984).
to identify the determinants of food security status.
15.
CONT.
Mixed dataanalysis method
Quantitative data analysis
descriptive statistical techniques;
inferential statistics (simple regression using T-test as
well as maximum likelihood estimate of logit model).
Qualitative data analysis
narrated to substantiate quantitative findings;
qualitative data was reduced according to similar patterns of
characteristics:
major sources of food;
households’ coping strategies;
reasons to sell most of agricultural products...
16.
MAJOR FINDINGS
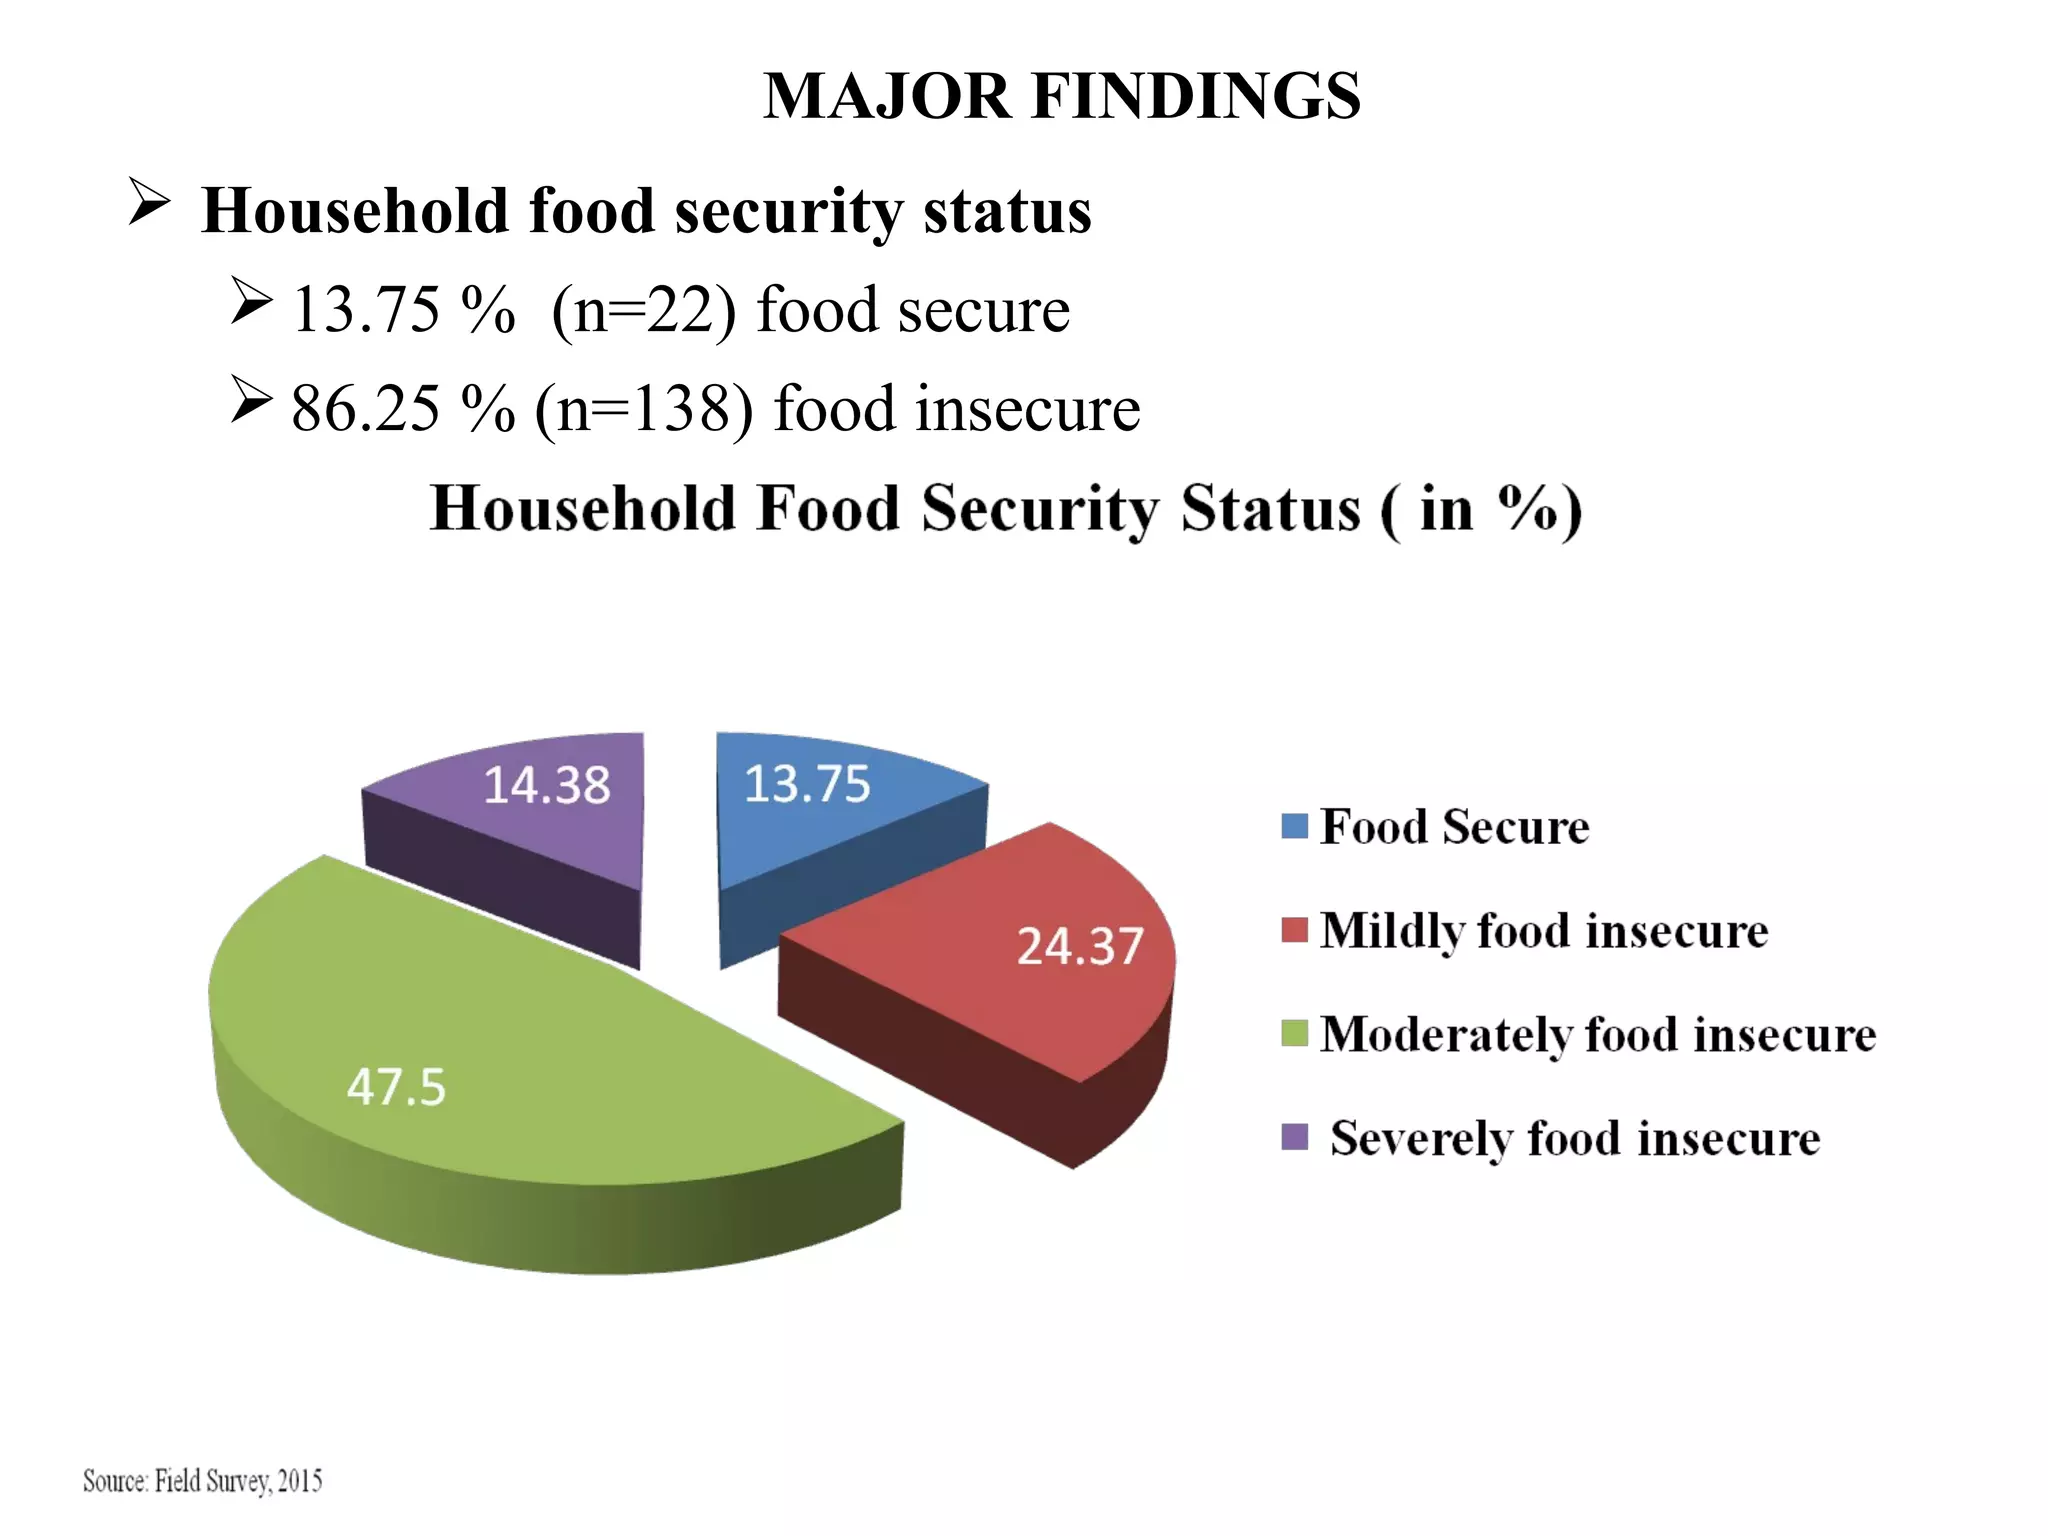
Householdfood security status
13.75 % (n=22) food secure
86.25 % (n=138) food insecure
17.
CONT.
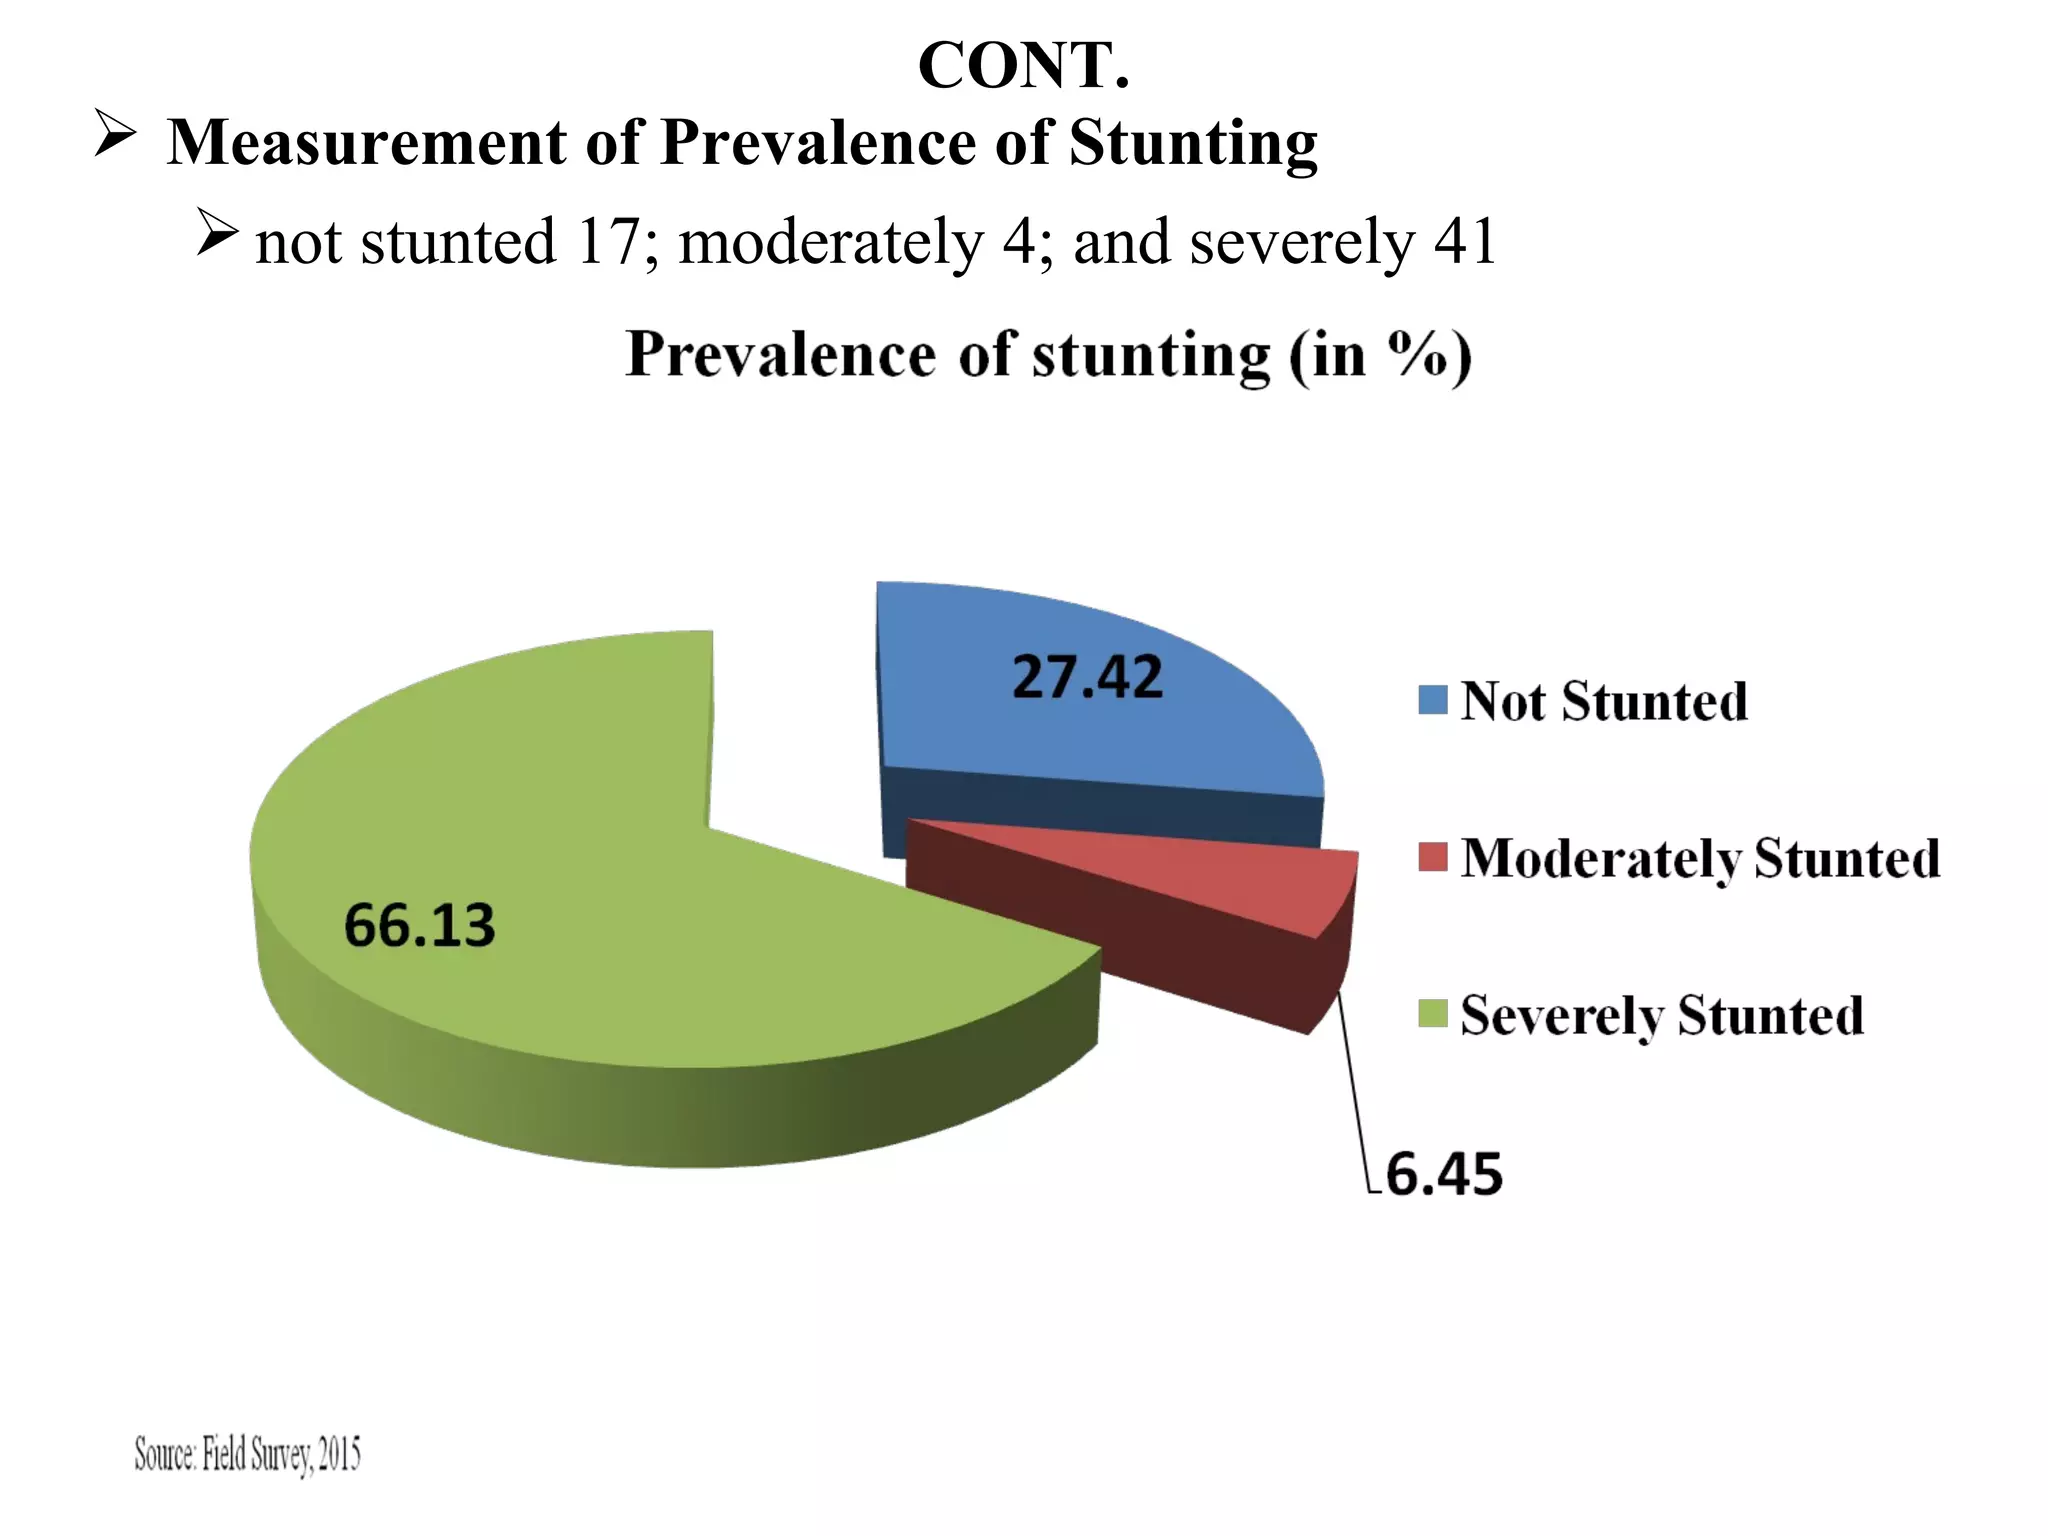
Measurement ofPrevalence of Stunting
not stunted 17; moderately 4; and severely 41
CONT.
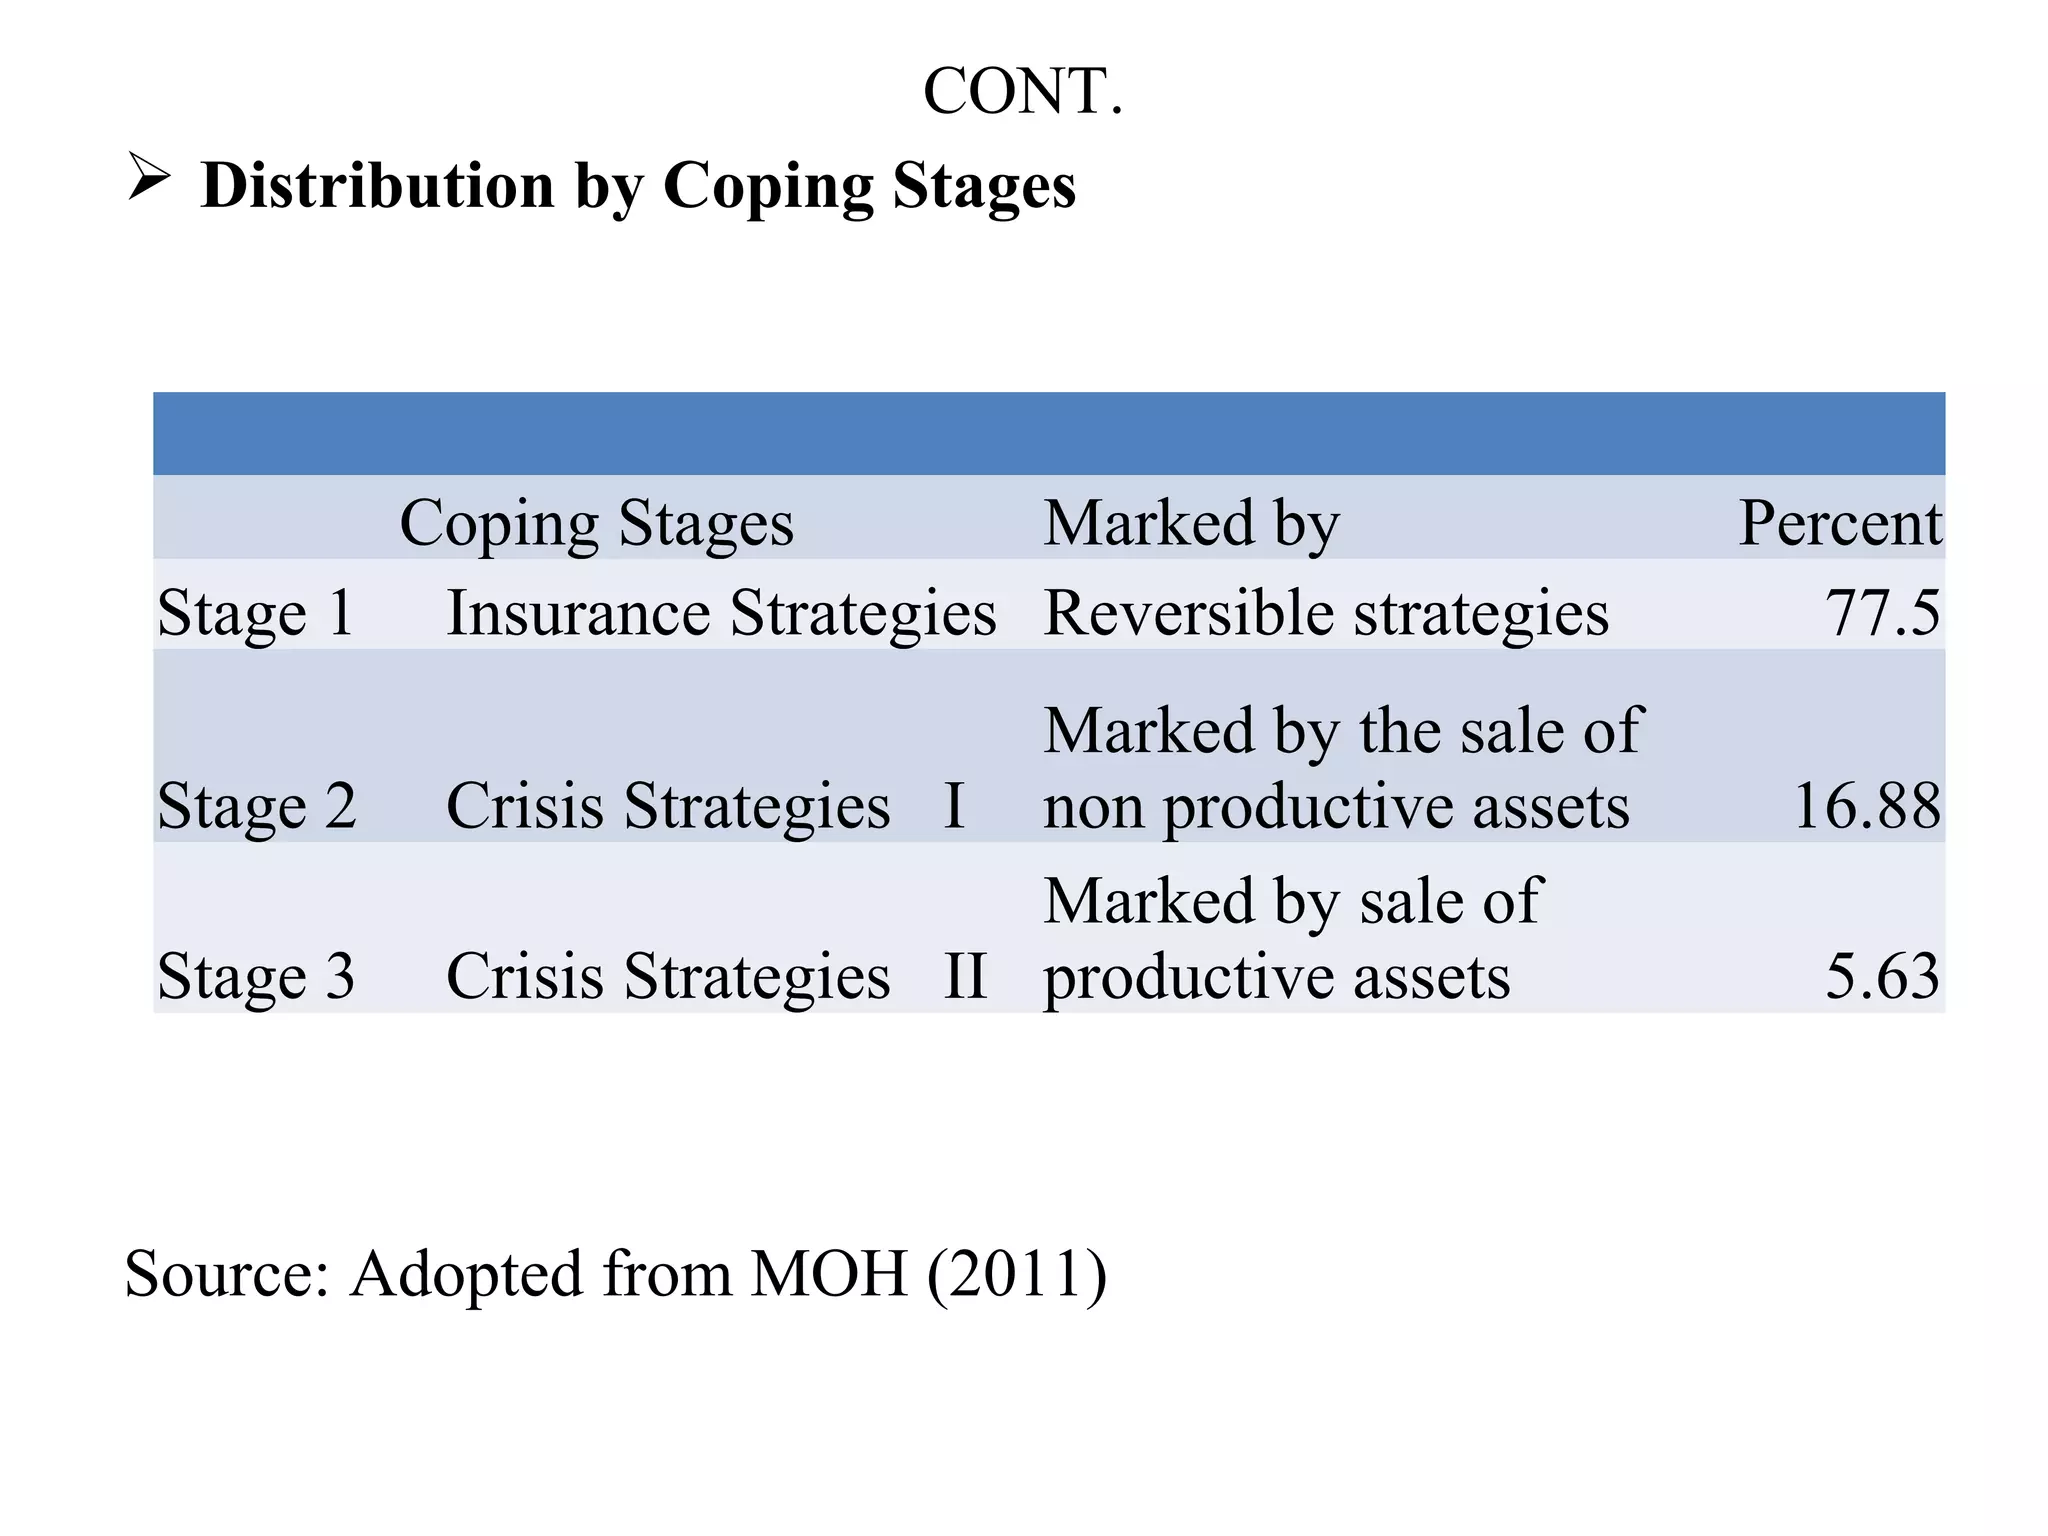
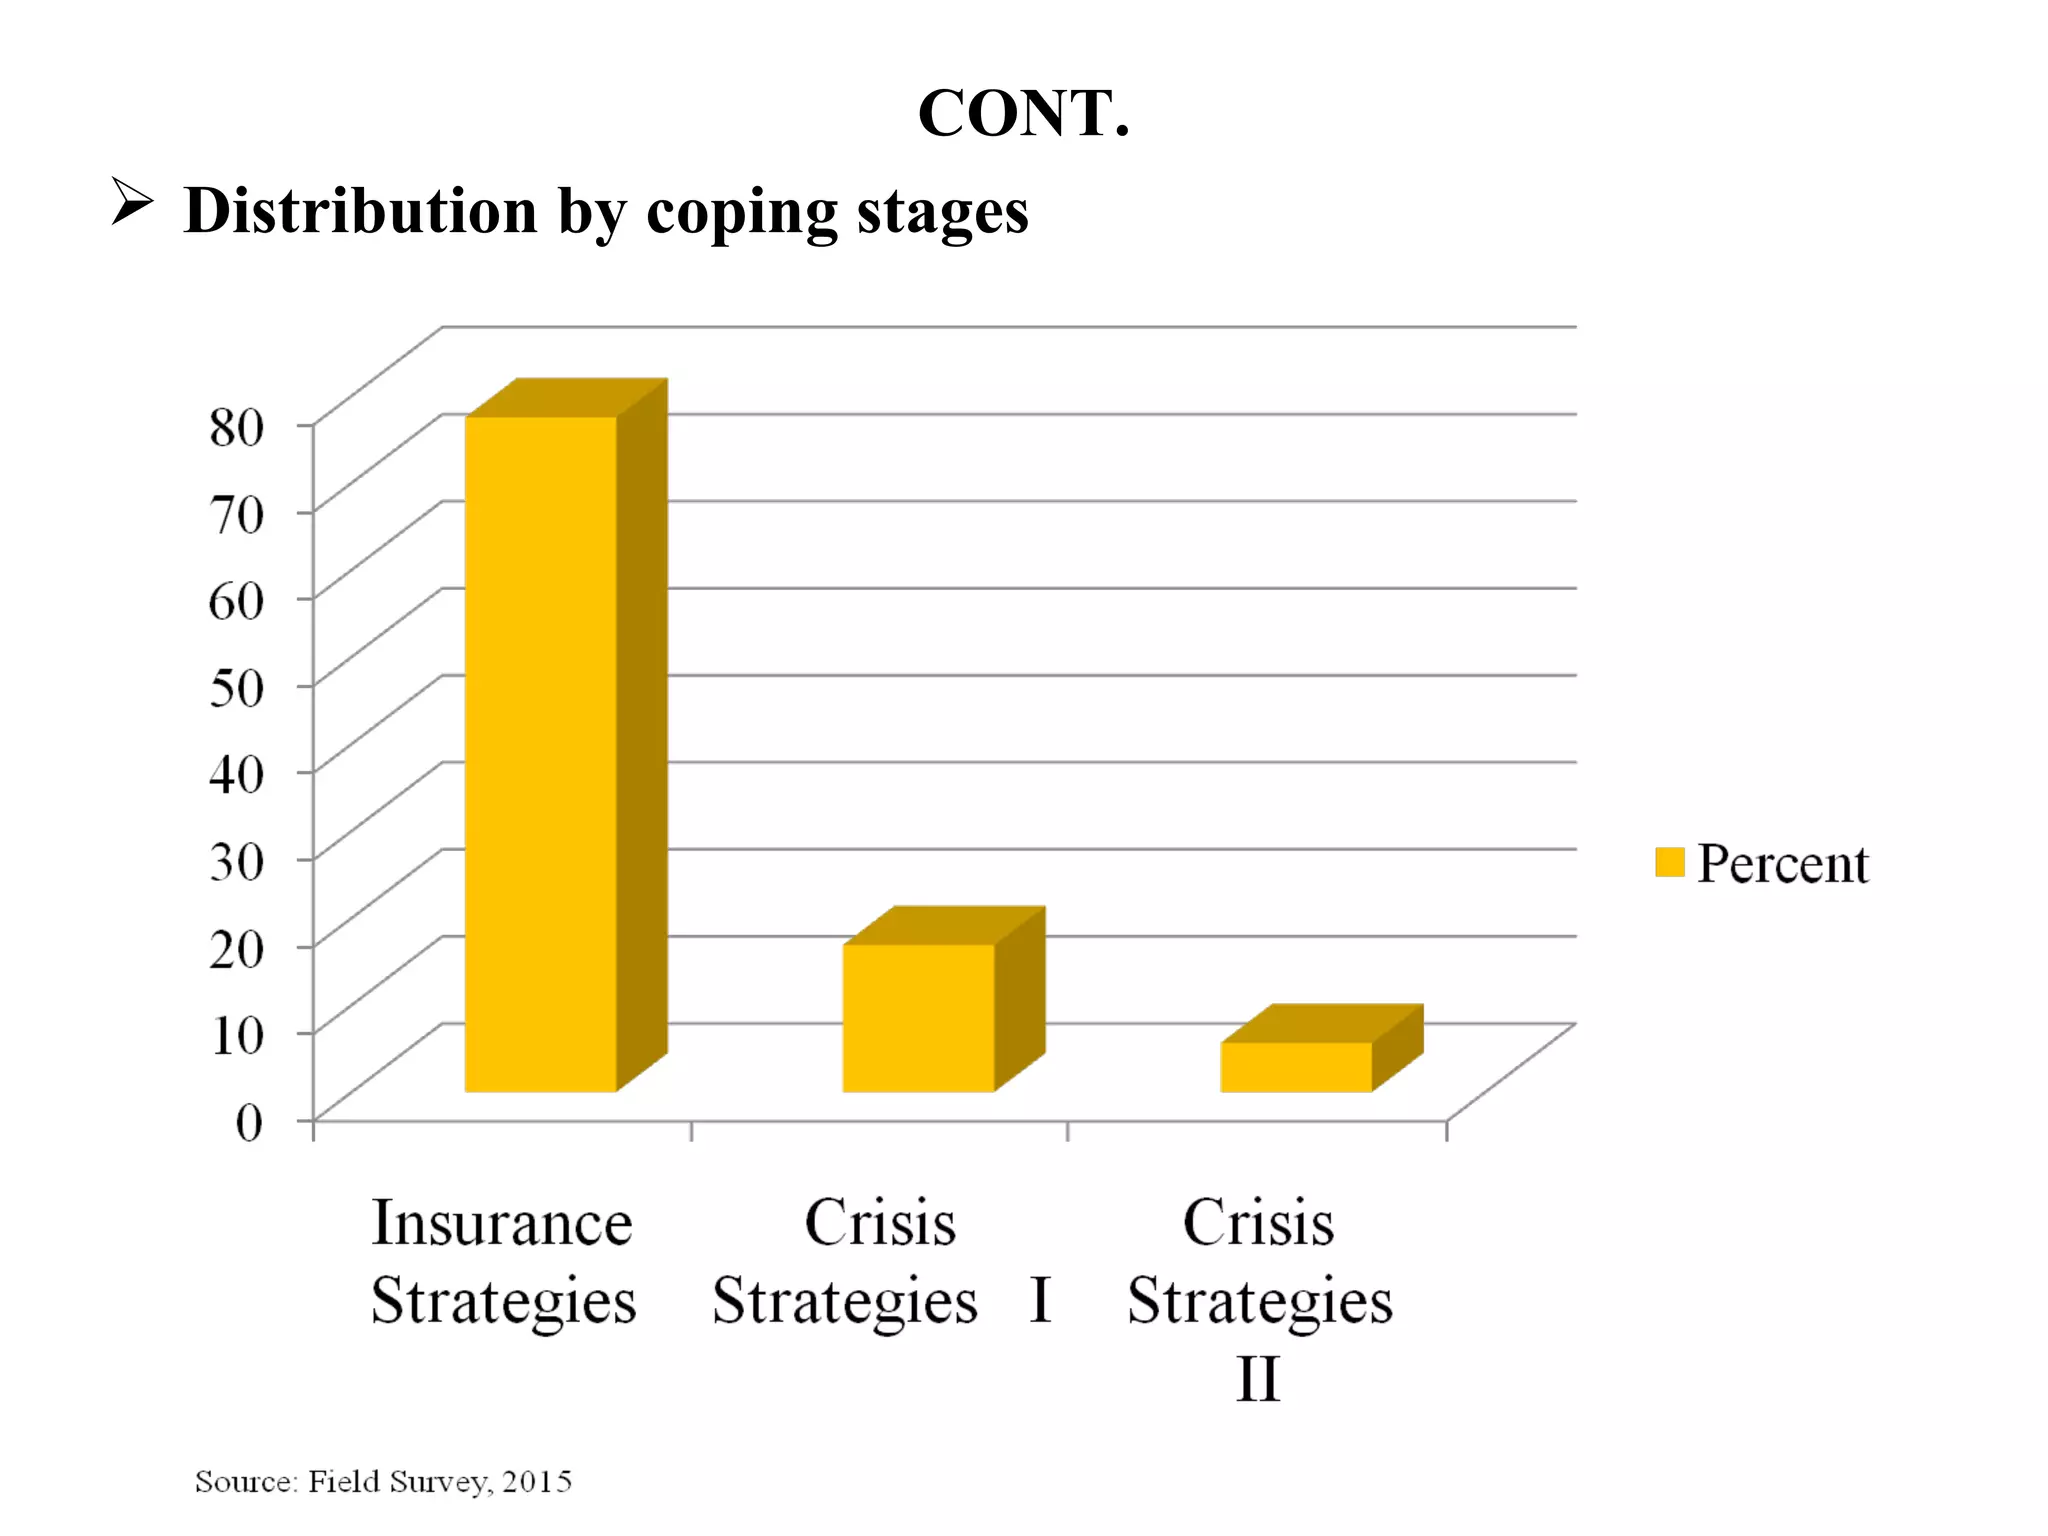
Distribution byCoping Stages
Source: Adopted from MOH (2011)
Coping Stages Marked by Percent
Stage 1 Insurance Strategies Reversible strategies 77.5
Stage 2 Crisis Strategies I
Marked by the sale of
non productive assets 16.88
Stage 3 Crisis Strategies II
Marked by sale of
productive assets 5.63
CONT
Determinants of foodsecurity
The maximum likelihood estimate of logit model
*** p<0.01, ** p<0.05, * p<0.1
Variable Estimated Coefficient Odds Ratio Std.
Err.
Significance Level
Family Size -.853 0.426 .17961 0.043**
Cultivable Land 6.775 875.724 2140.93 0.006***
Irrigated Land 16.707 61.222 1.5938 0.004 ***
Market Distance .572 1.772 .4058 0.012 **
Education -.737 .478 .2952 0.232
TLU .349 1.418 .8006 0.536
Annual Income .0001 1.000 .0003 0.63
24.
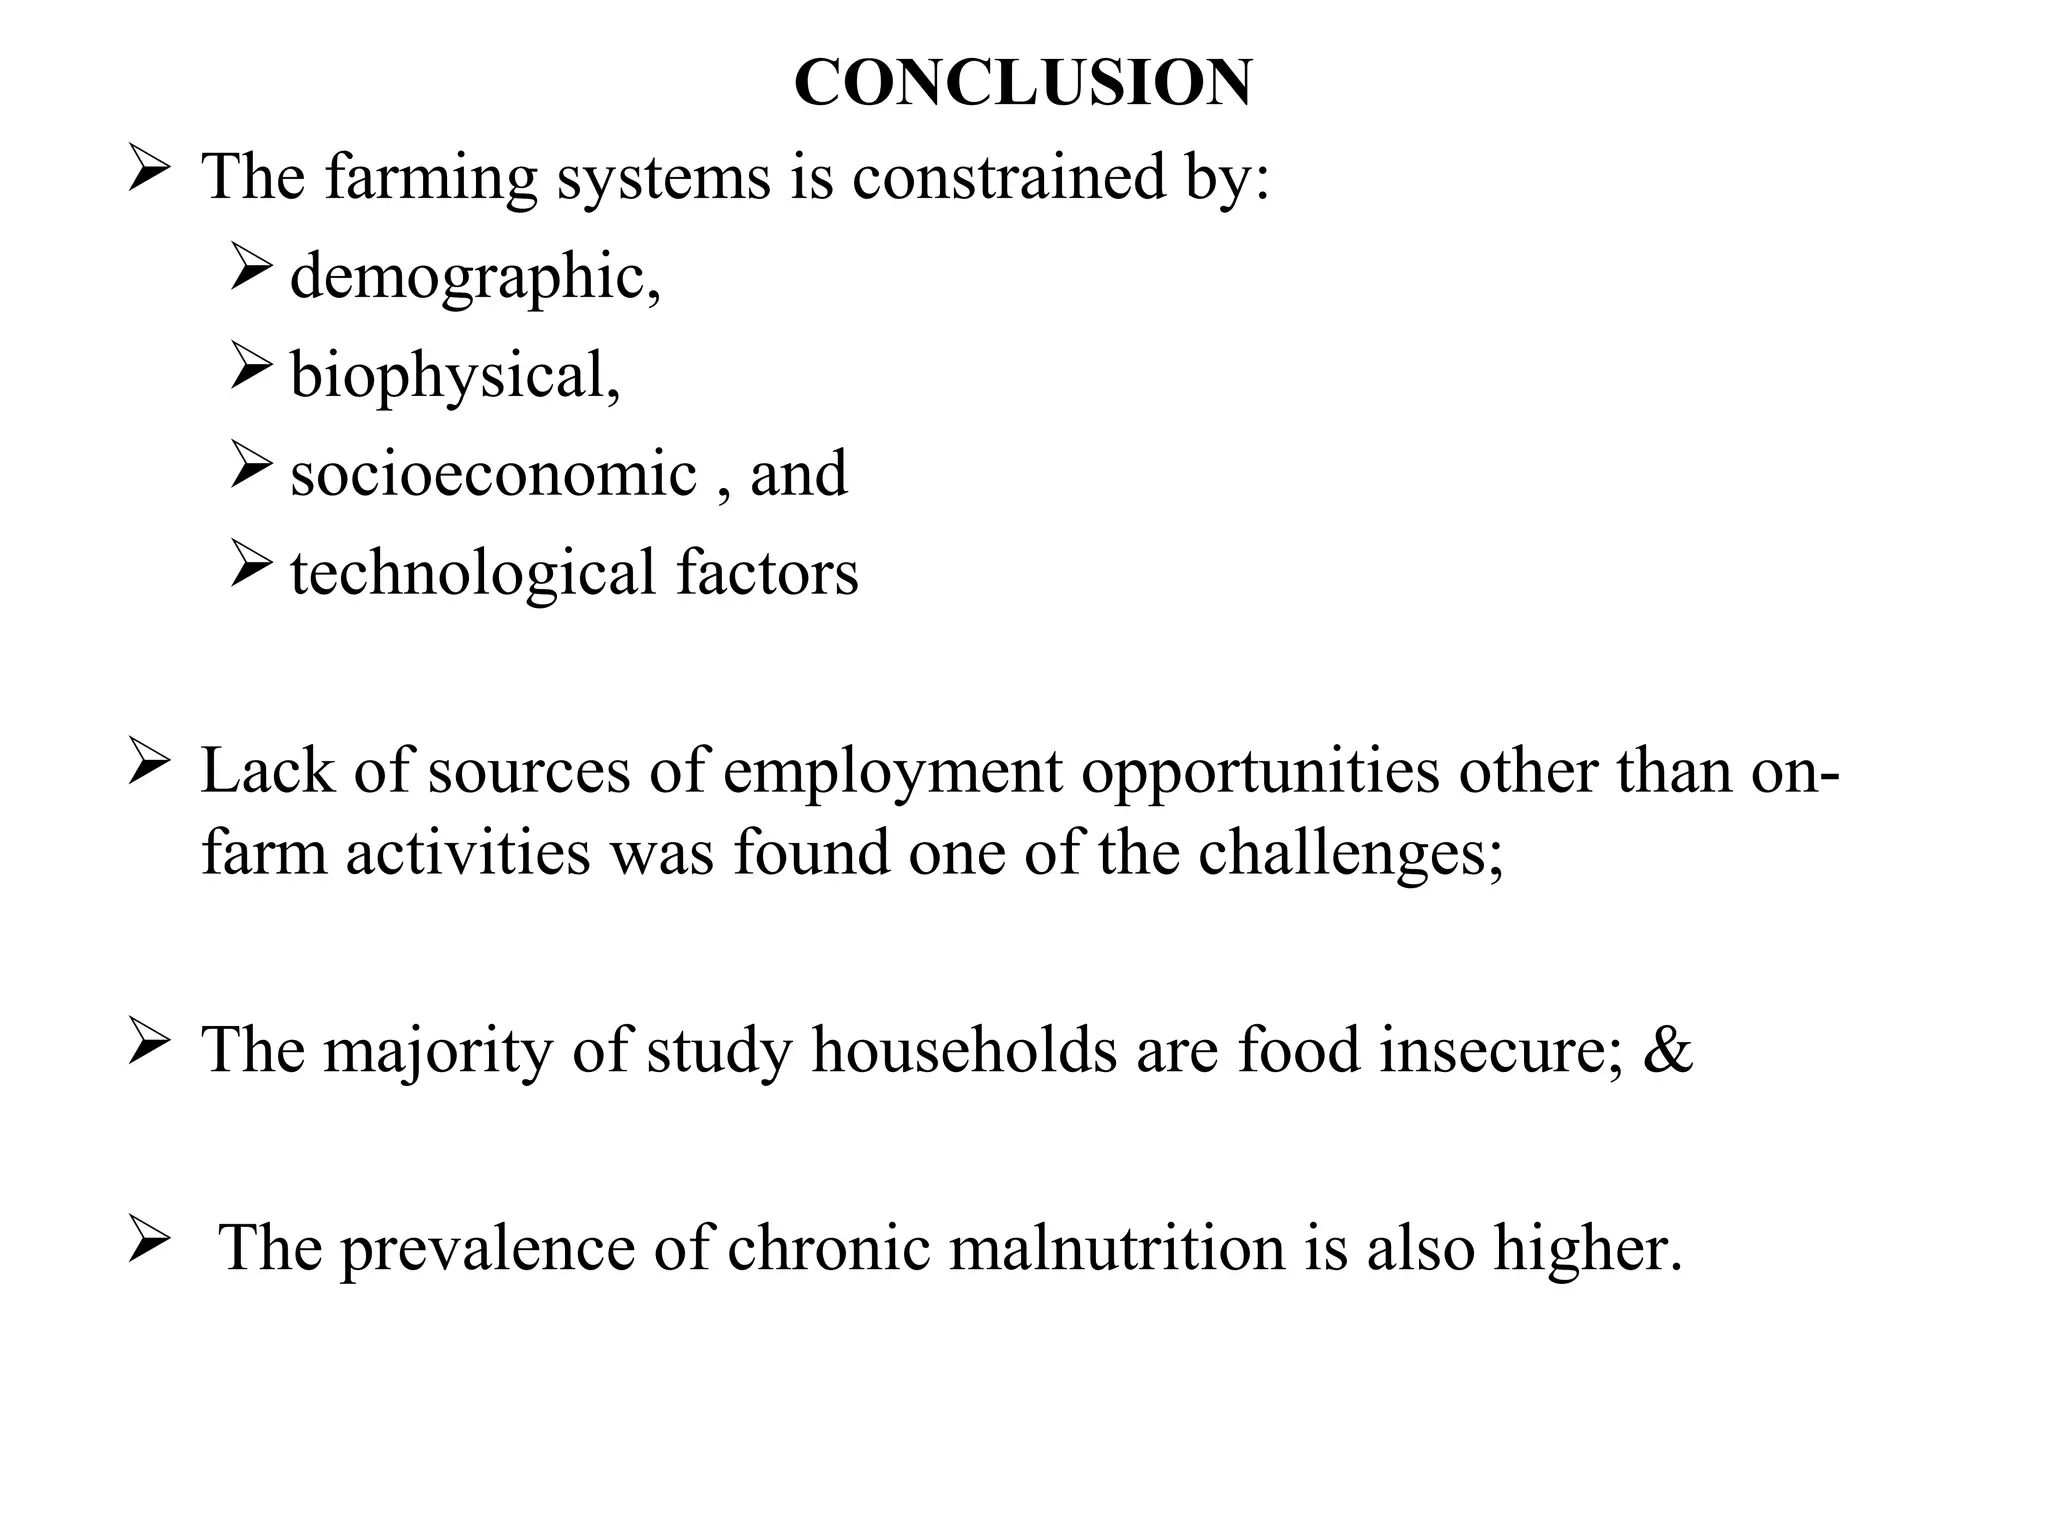
CONCLUSION
The farmingsystems is constrained by:
demographic,
biophysical,
socioeconomic , and
technological factors
Lack of sources of employment opportunities other than on-
farm activities was found one of the challenges;
The majority of study households are food insecure; &
The prevalence of chronic malnutrition is also higher.
25.
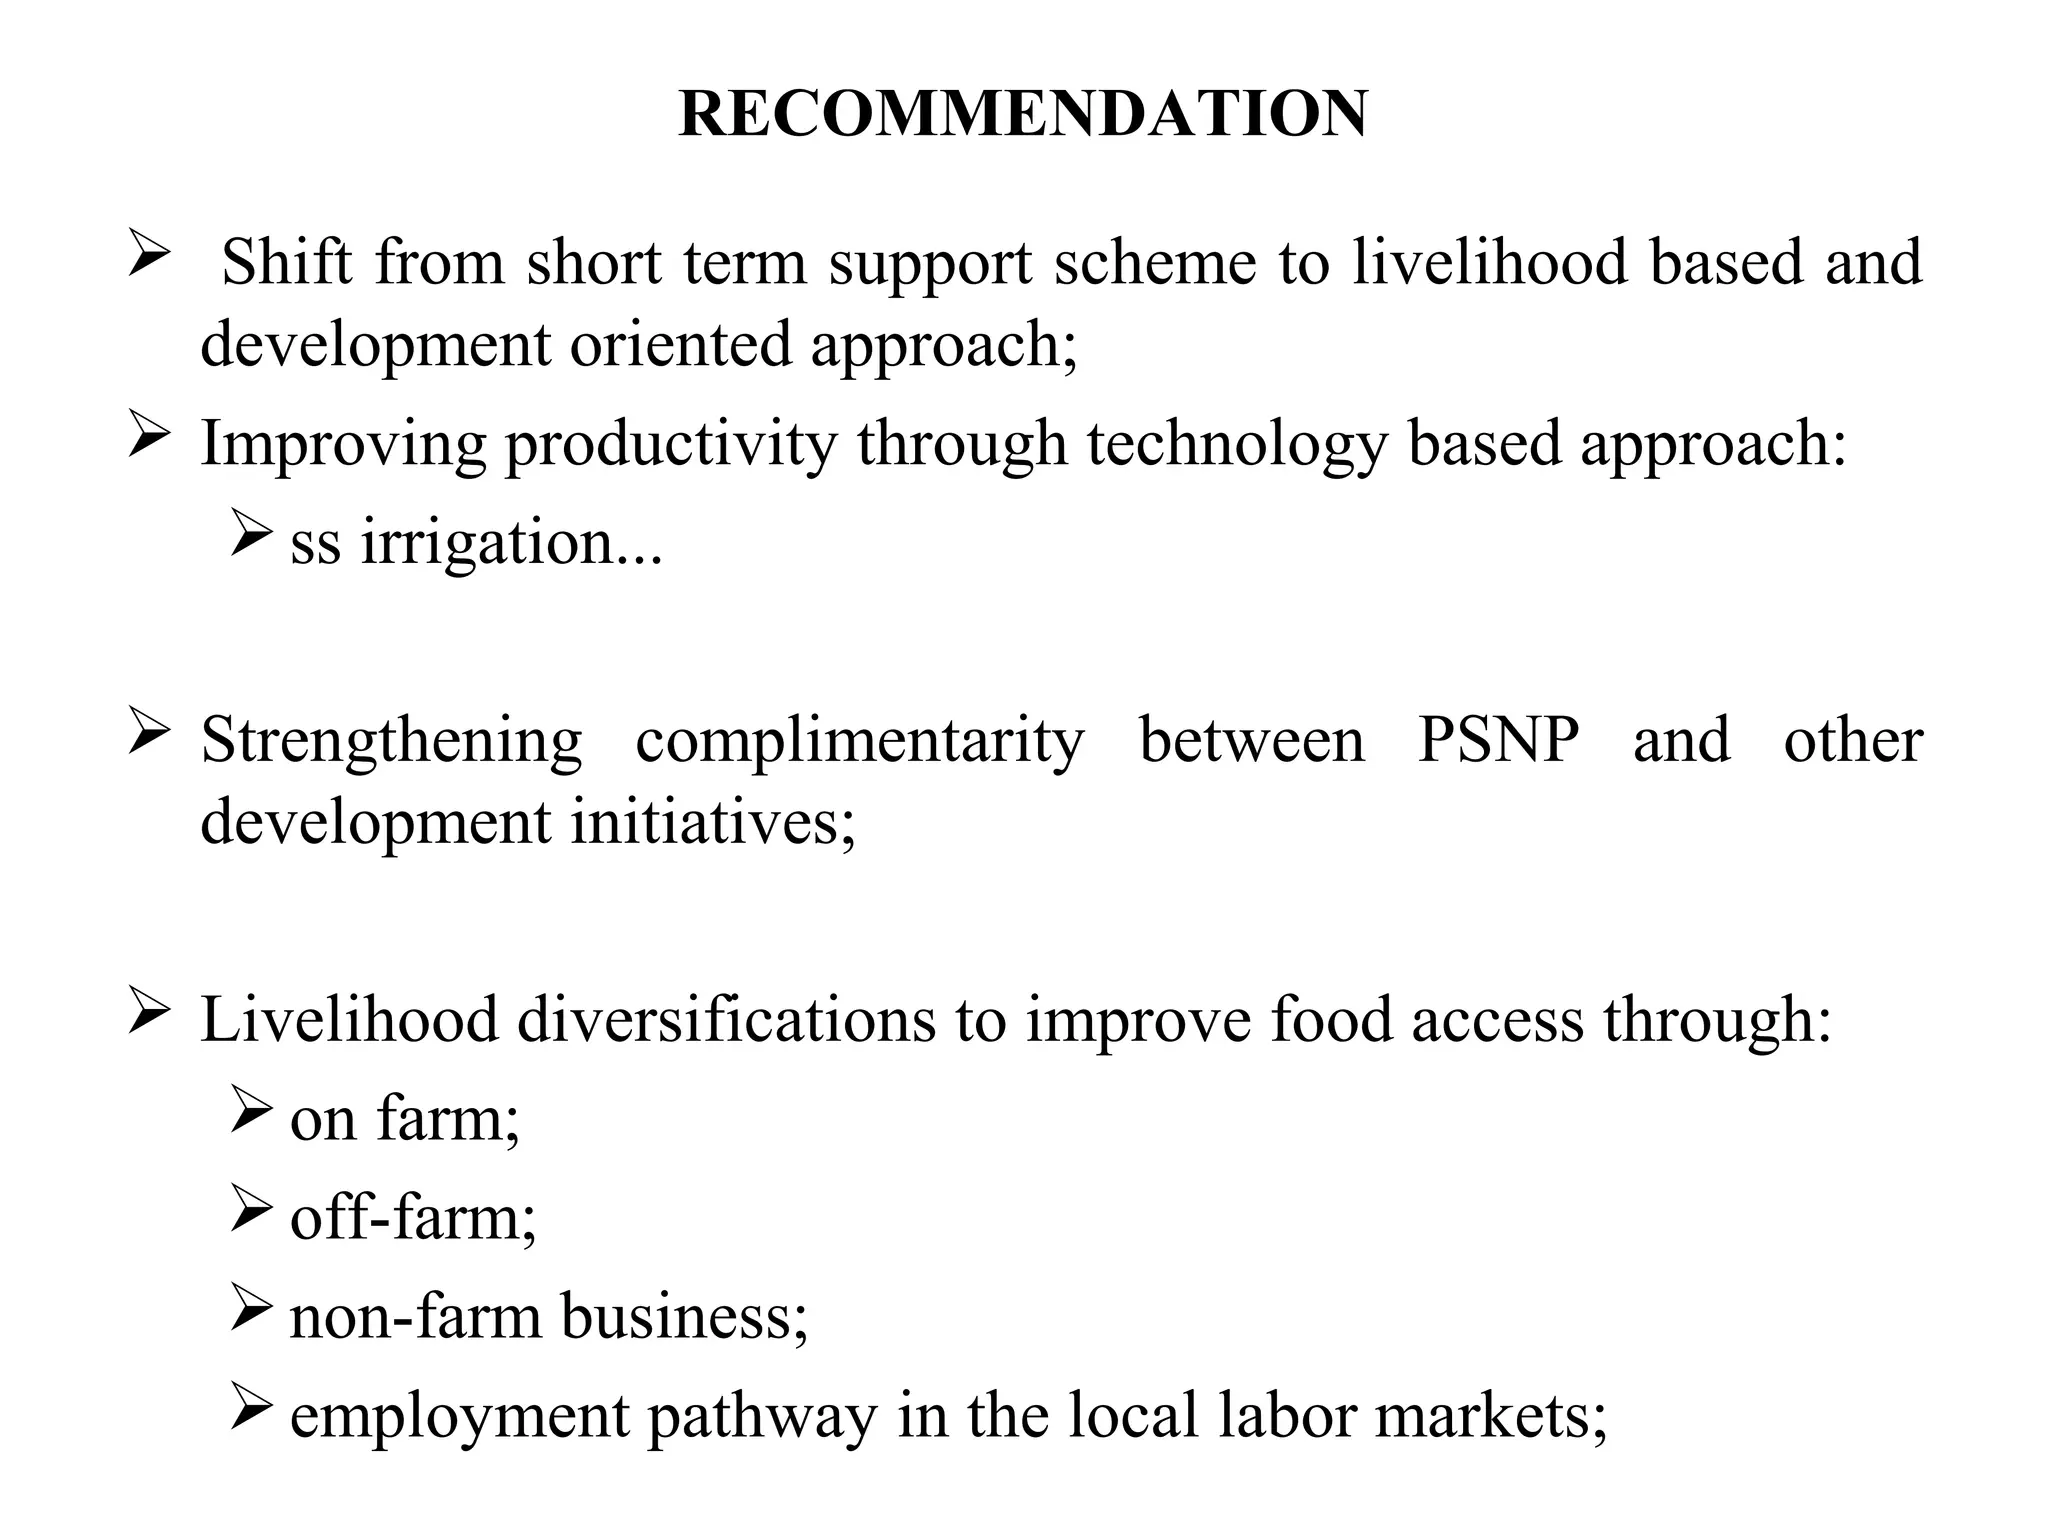
RECOMMENDATION
Shift fromshort term support scheme to livelihood based and
development oriented approach;
Improving productivity through technology based approach:
ss irrigation...
Strengthening complimentarity between PSNP and other
development initiatives;
Livelihood diversifications to improve food access through:
on farm;
off-farm;
non-farm business;
employment pathway in the local labor markets;
26.
RECOMMENDATION
Appropriate developmentinterventions toward women:
increase women’s income earning opportunities;
reducing their work load;
IGS and decision making at household level.
Targeted intervention within the ongoing FSP [ PSNP] :
pregnant and lactating mothers;and
child.
27.
RECOMMENDATION
Linking thePSNP cash/food transfer with non food
contributors of nutrition:
social transformation process through
social behavioral change approach:
family planning;
nutrition promotion…


![CONT.
Causes of food insecurity in Ethiopia?
poverty;
weak institutions (market and land tenure);
land degradation;
insufficient landholding;
low productivity rain fed agriculture;
low off farm opportunities;
population pressure;
low literacy.
[Firehiwot 2007; Degefa 2002; Gebremedhin 2001;
Devereux-2000; Masefield 2000; Hurni 1998]](https://image.slidesharecdn.com/fe47df58-bfb4-4529-97b8-0928302d9896-160511125310/75/BEHAILU-DEFENCE-PPT-final-4-4-2048.jpg)

![METHODOLOGY
Selection of study area
selection of Libokemkem district was purposive:
CFI districts [targeted by PSNP program];
frequent visit RRM (Rapid Response Mechanism)
Data source; Ethiopian mapping agency](https://image.slidesharecdn.com/fe47df58-bfb4-4529-97b8-0928302d9896-160511125310/75/BEHAILU-DEFENCE-PPT-final-4-10-2048.jpg)


![CONT.
Stunting by sex
N = 62 [F 29, M 33]
2 out of 3 were admitted for Out Patient Therapeutic Feeding (Birkute HP).](https://image.slidesharecdn.com/fe47df58-bfb4-4529-97b8-0928302d9896-160511125310/75/BEHAILU-DEFENCE-PPT-final-4-19-2048.jpg)

![RECOMMENDATION
Appropriate development interventions toward women:
increase women’s income earning opportunities;
reducing their work load;
IGS and decision making at household level.
Targeted intervention within the ongoing FSP [ PSNP] :
pregnant and lactating mothers;and
child.](https://image.slidesharecdn.com/fe47df58-bfb4-4529-97b8-0928302d9896-160511125310/75/BEHAILU-DEFENCE-PPT-final-4-26-2048.jpg)


