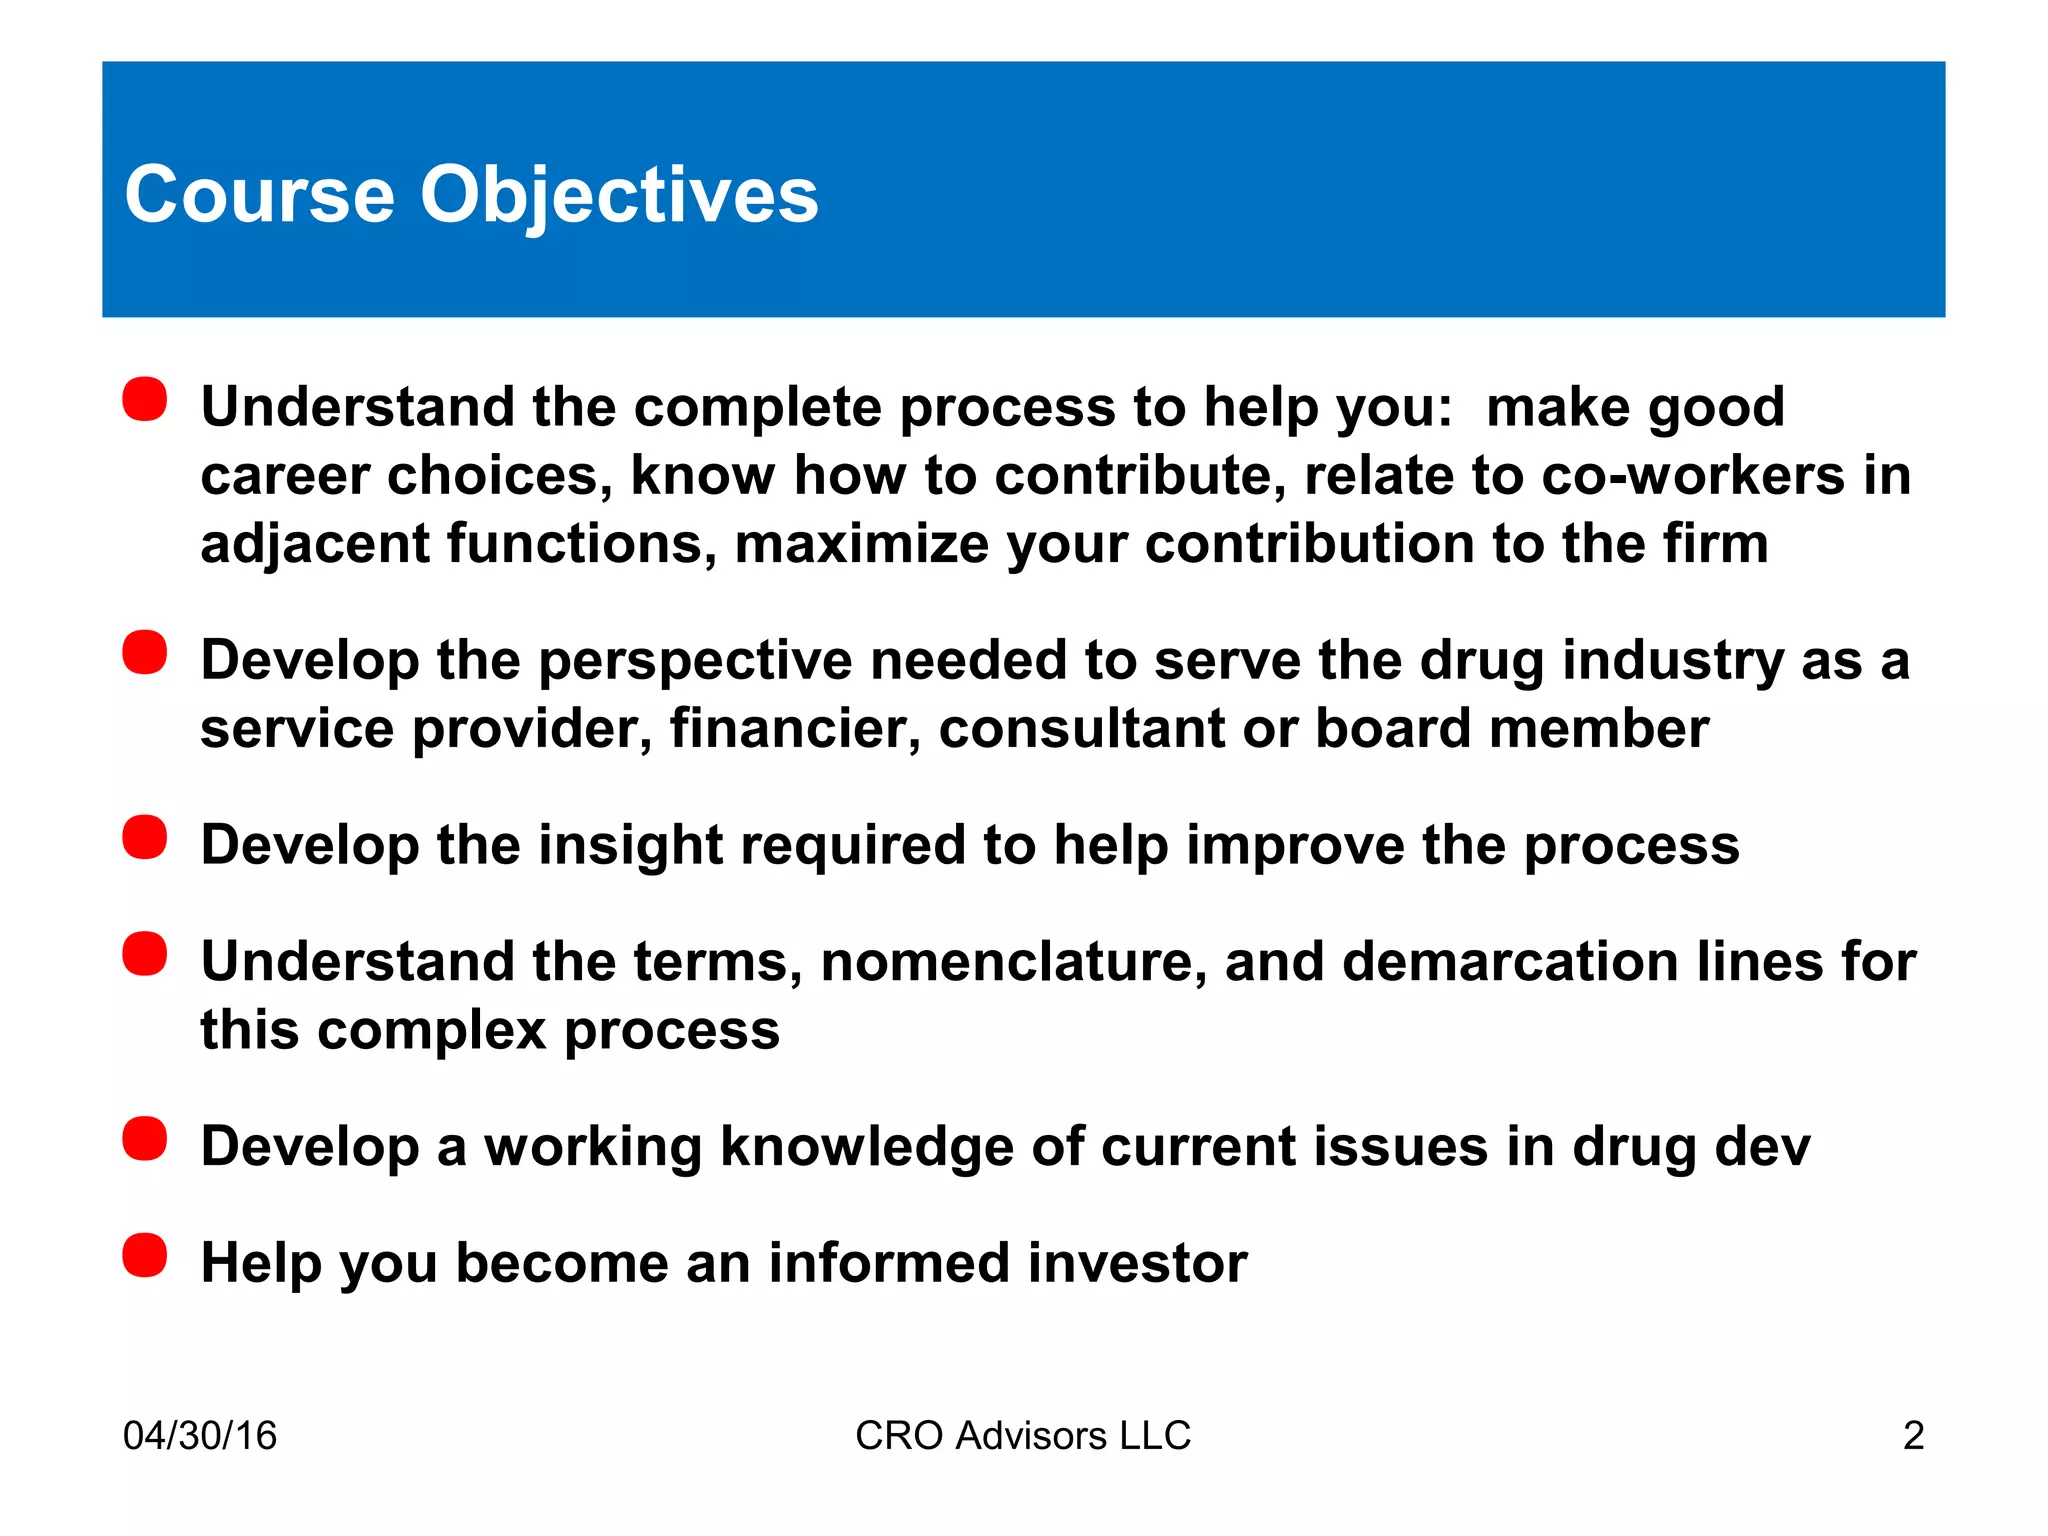
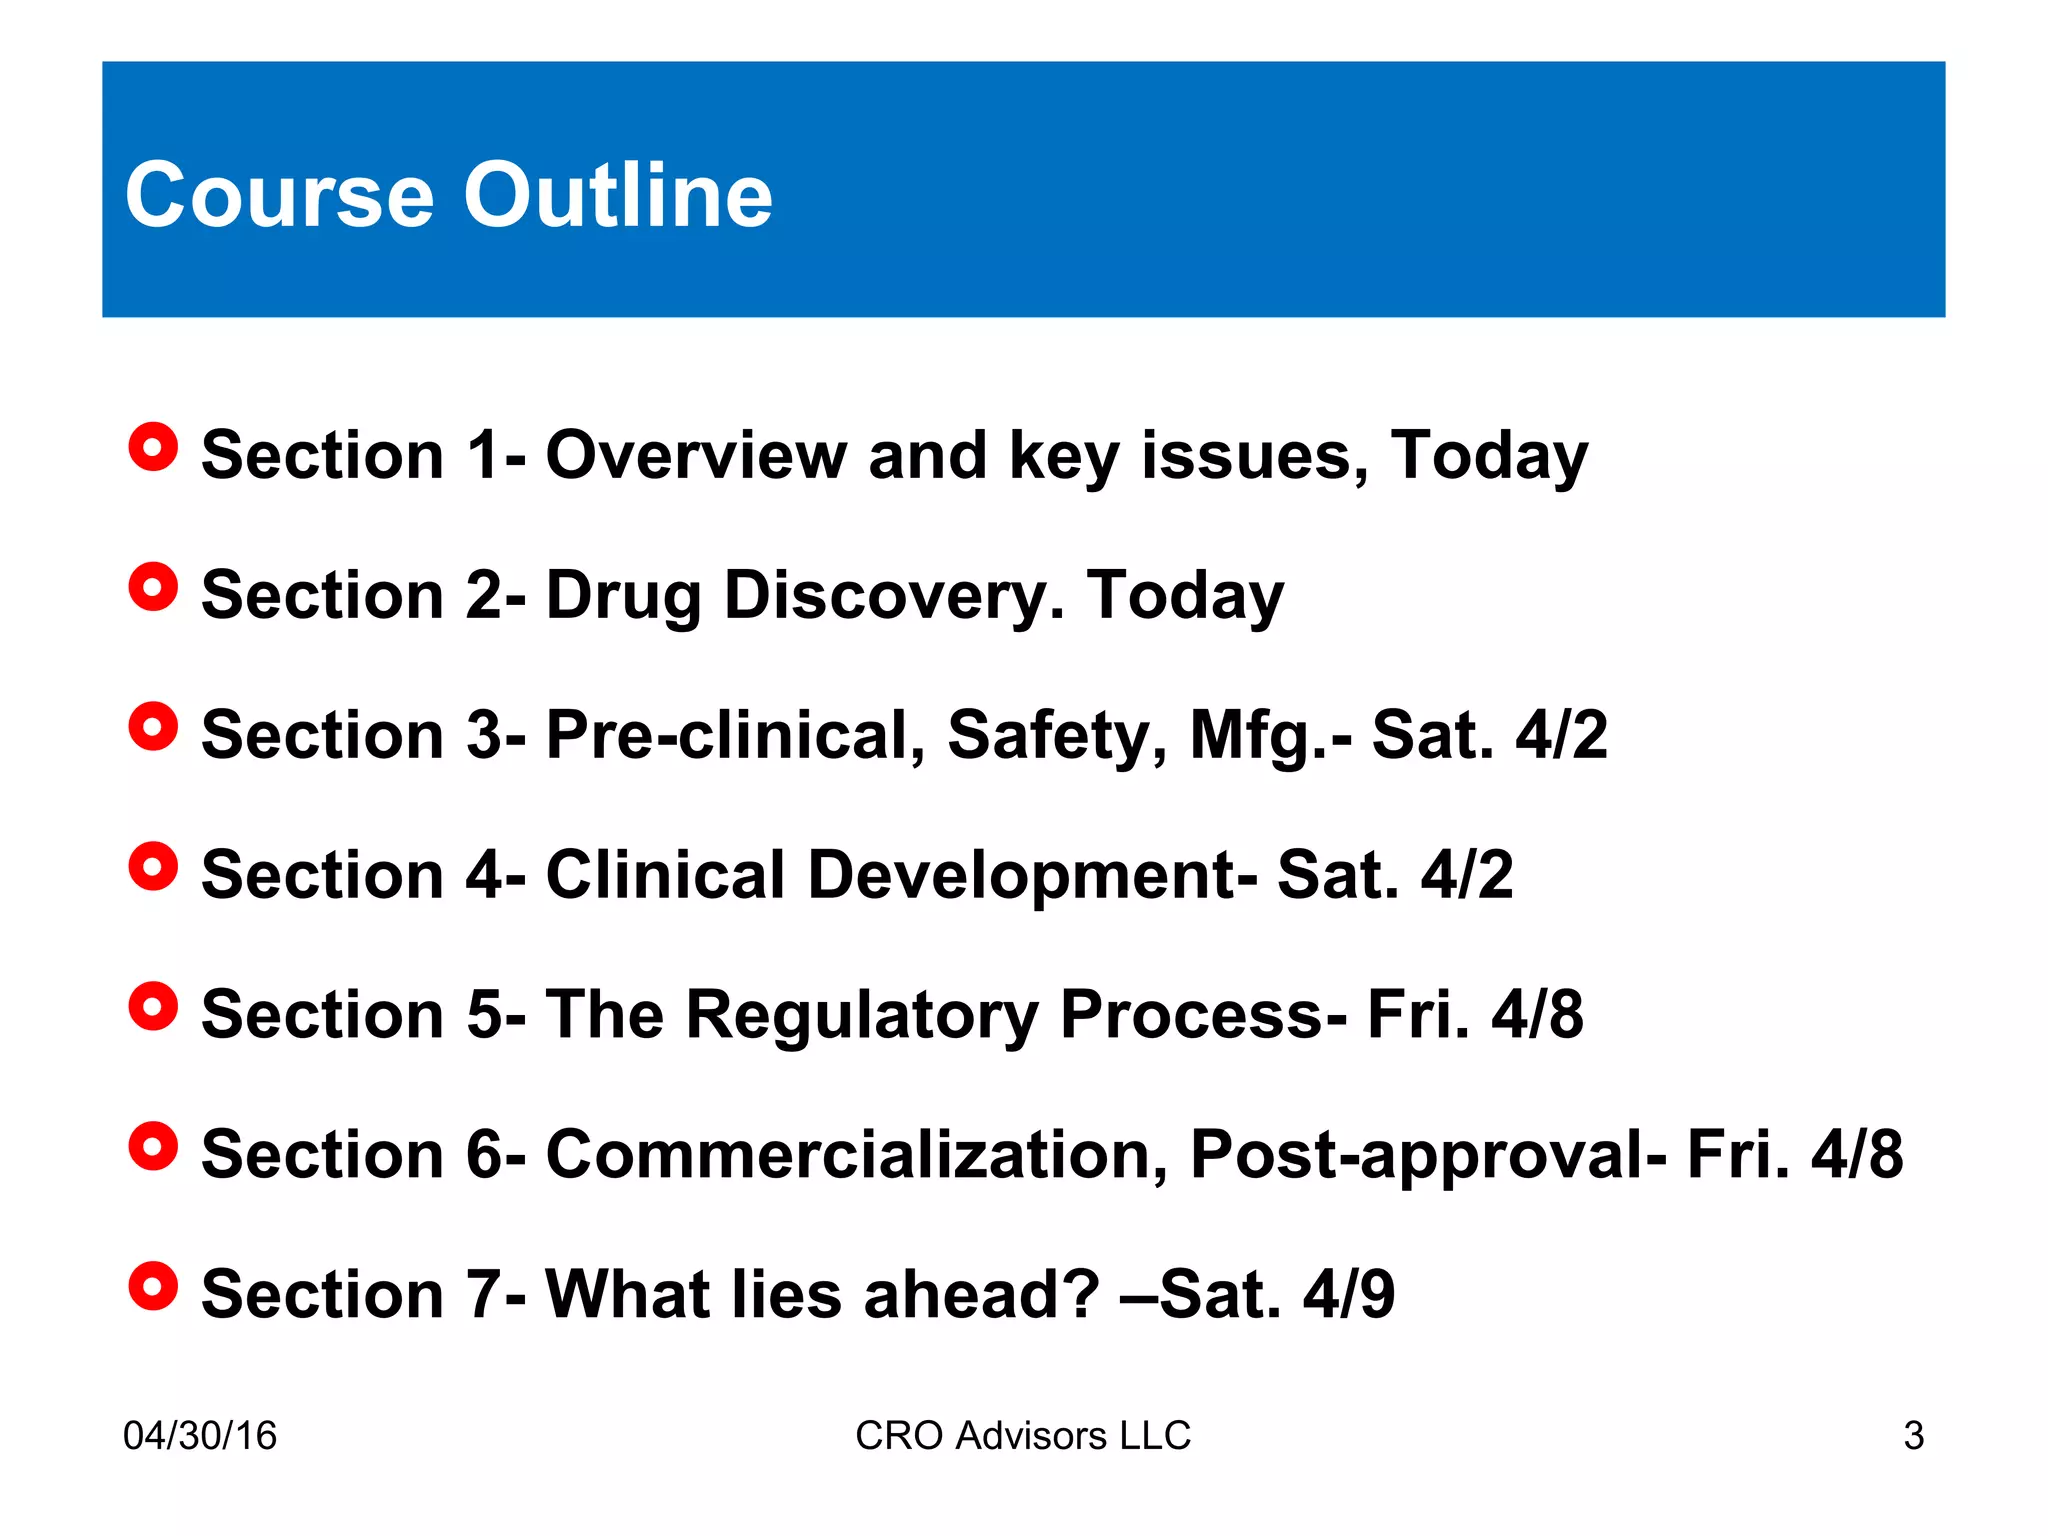
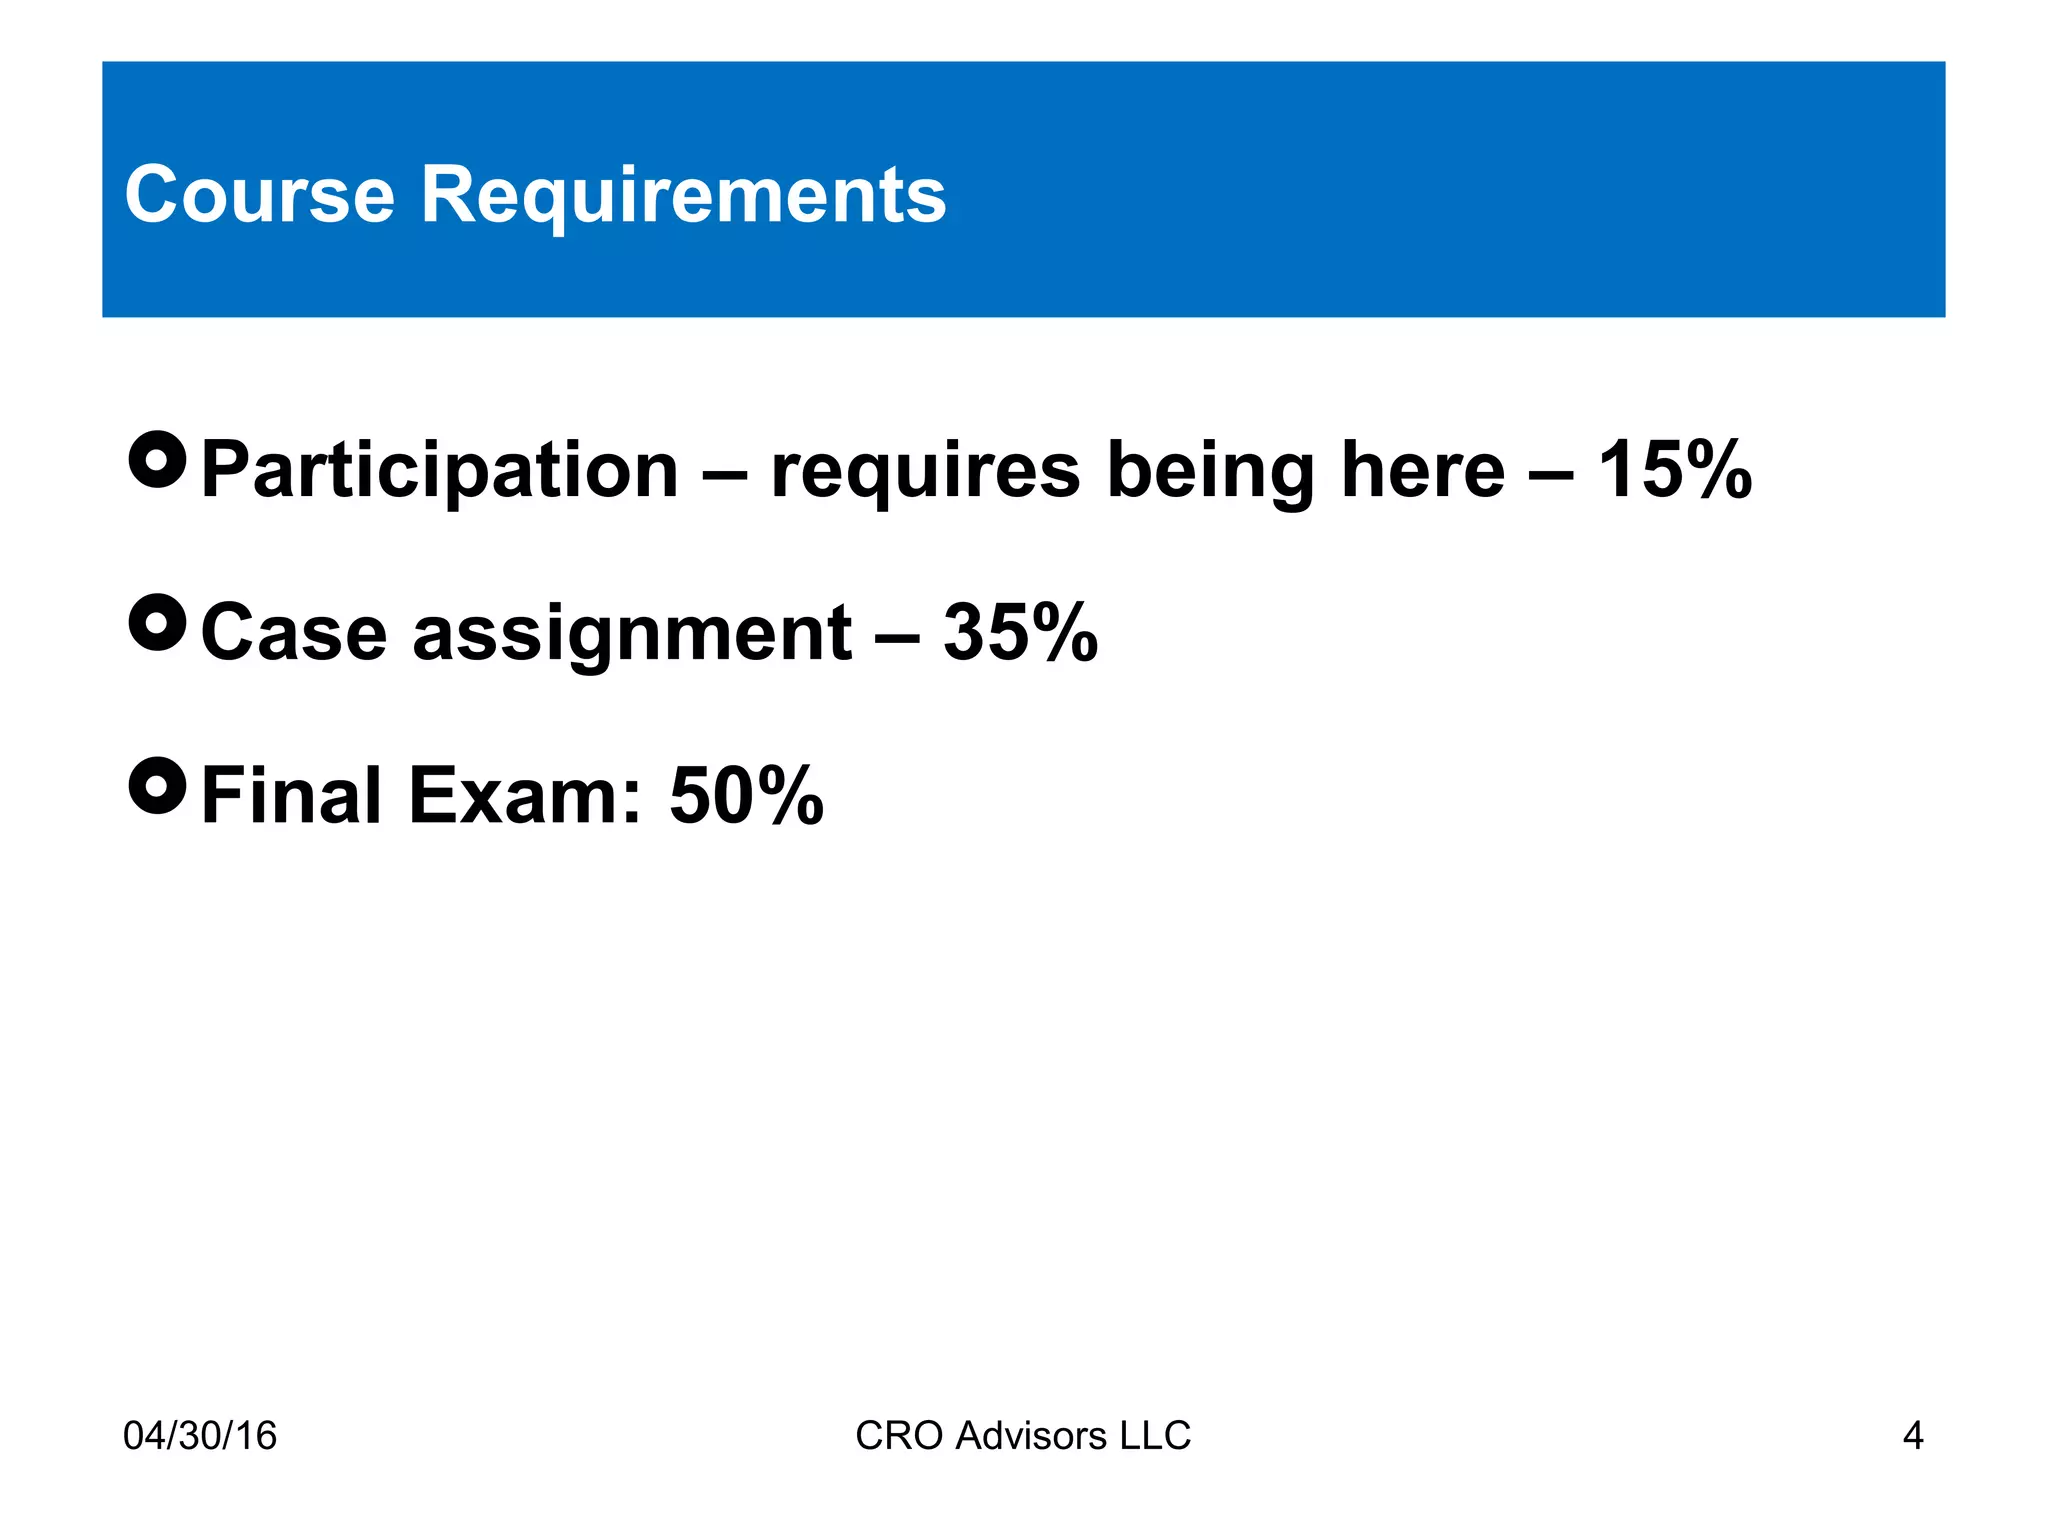
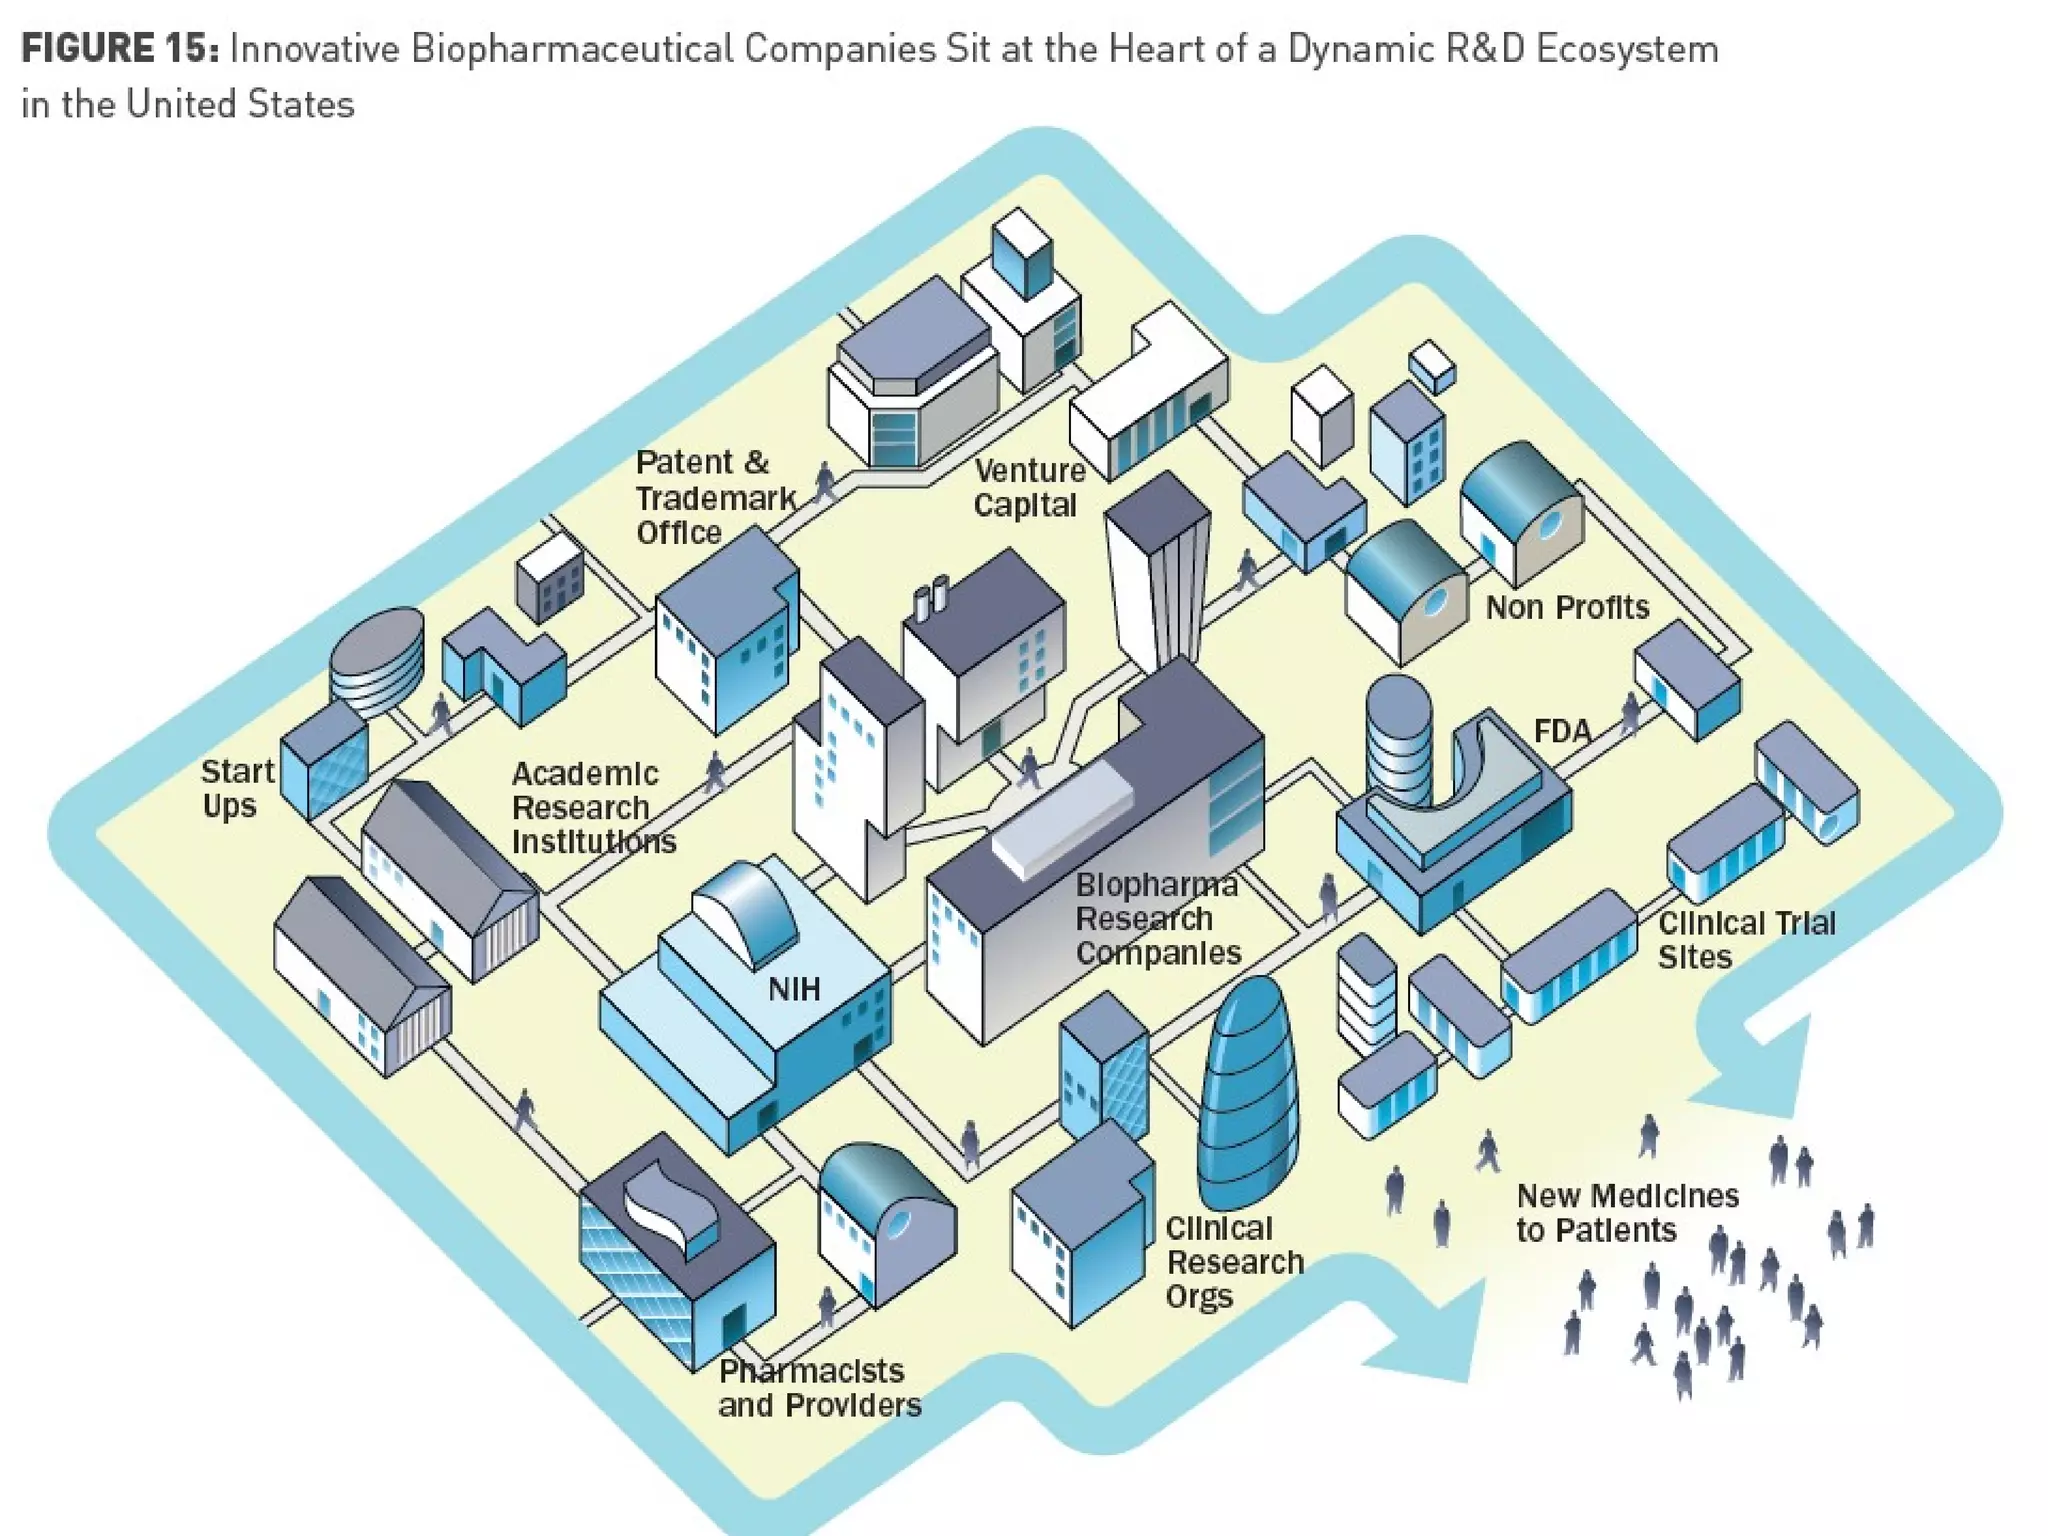
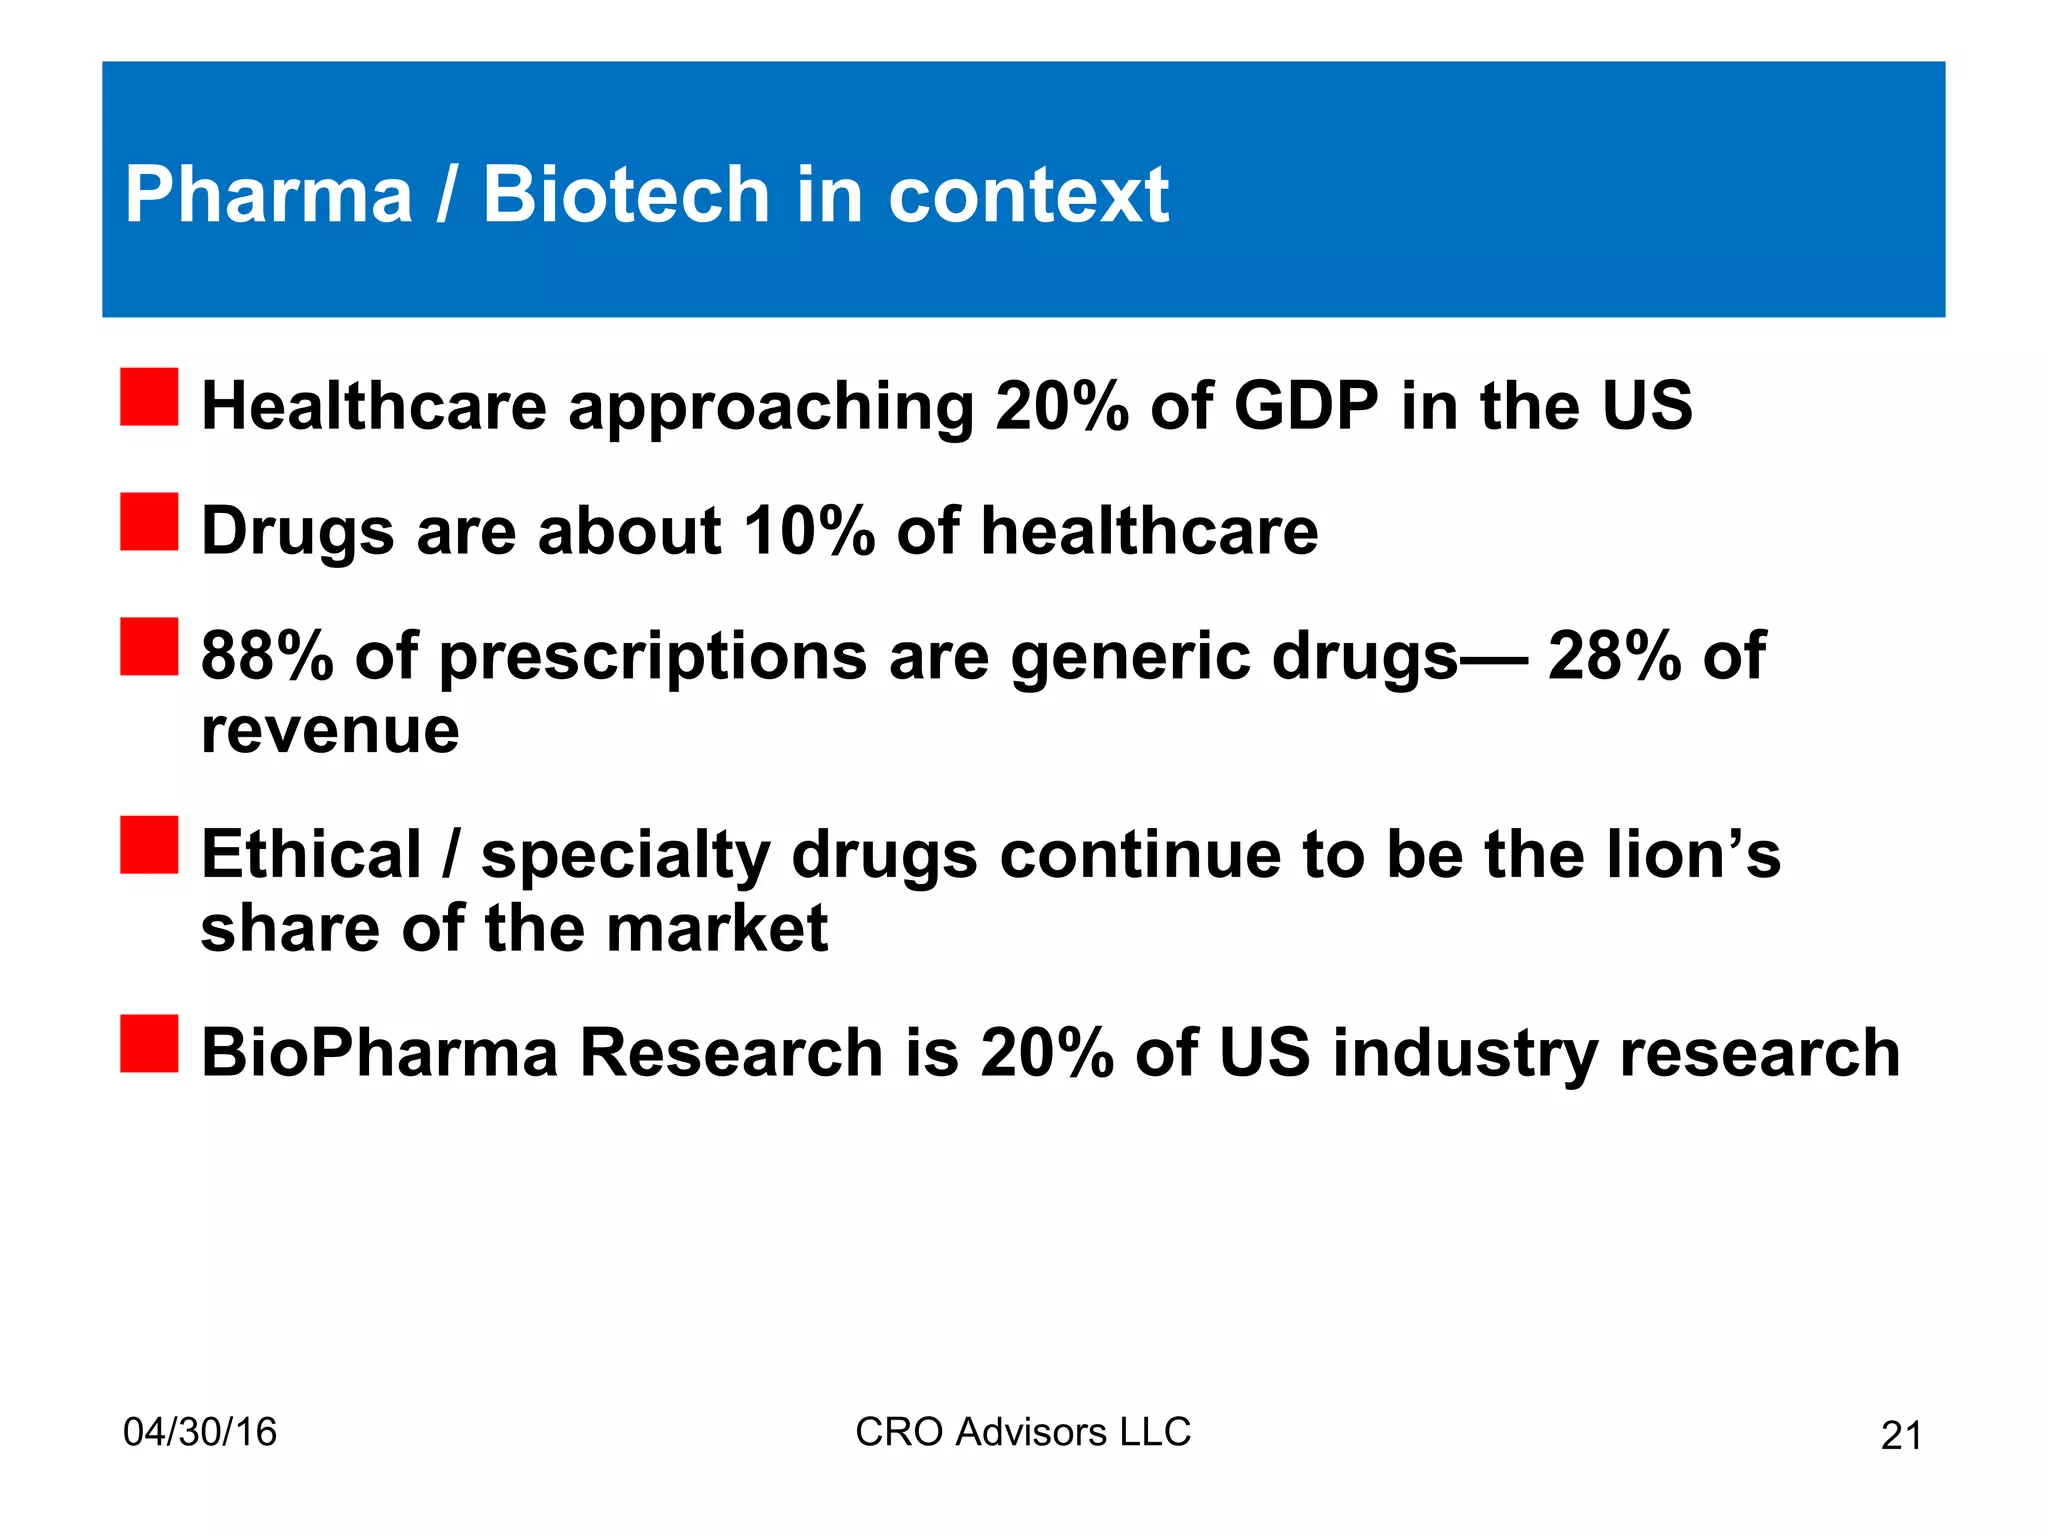
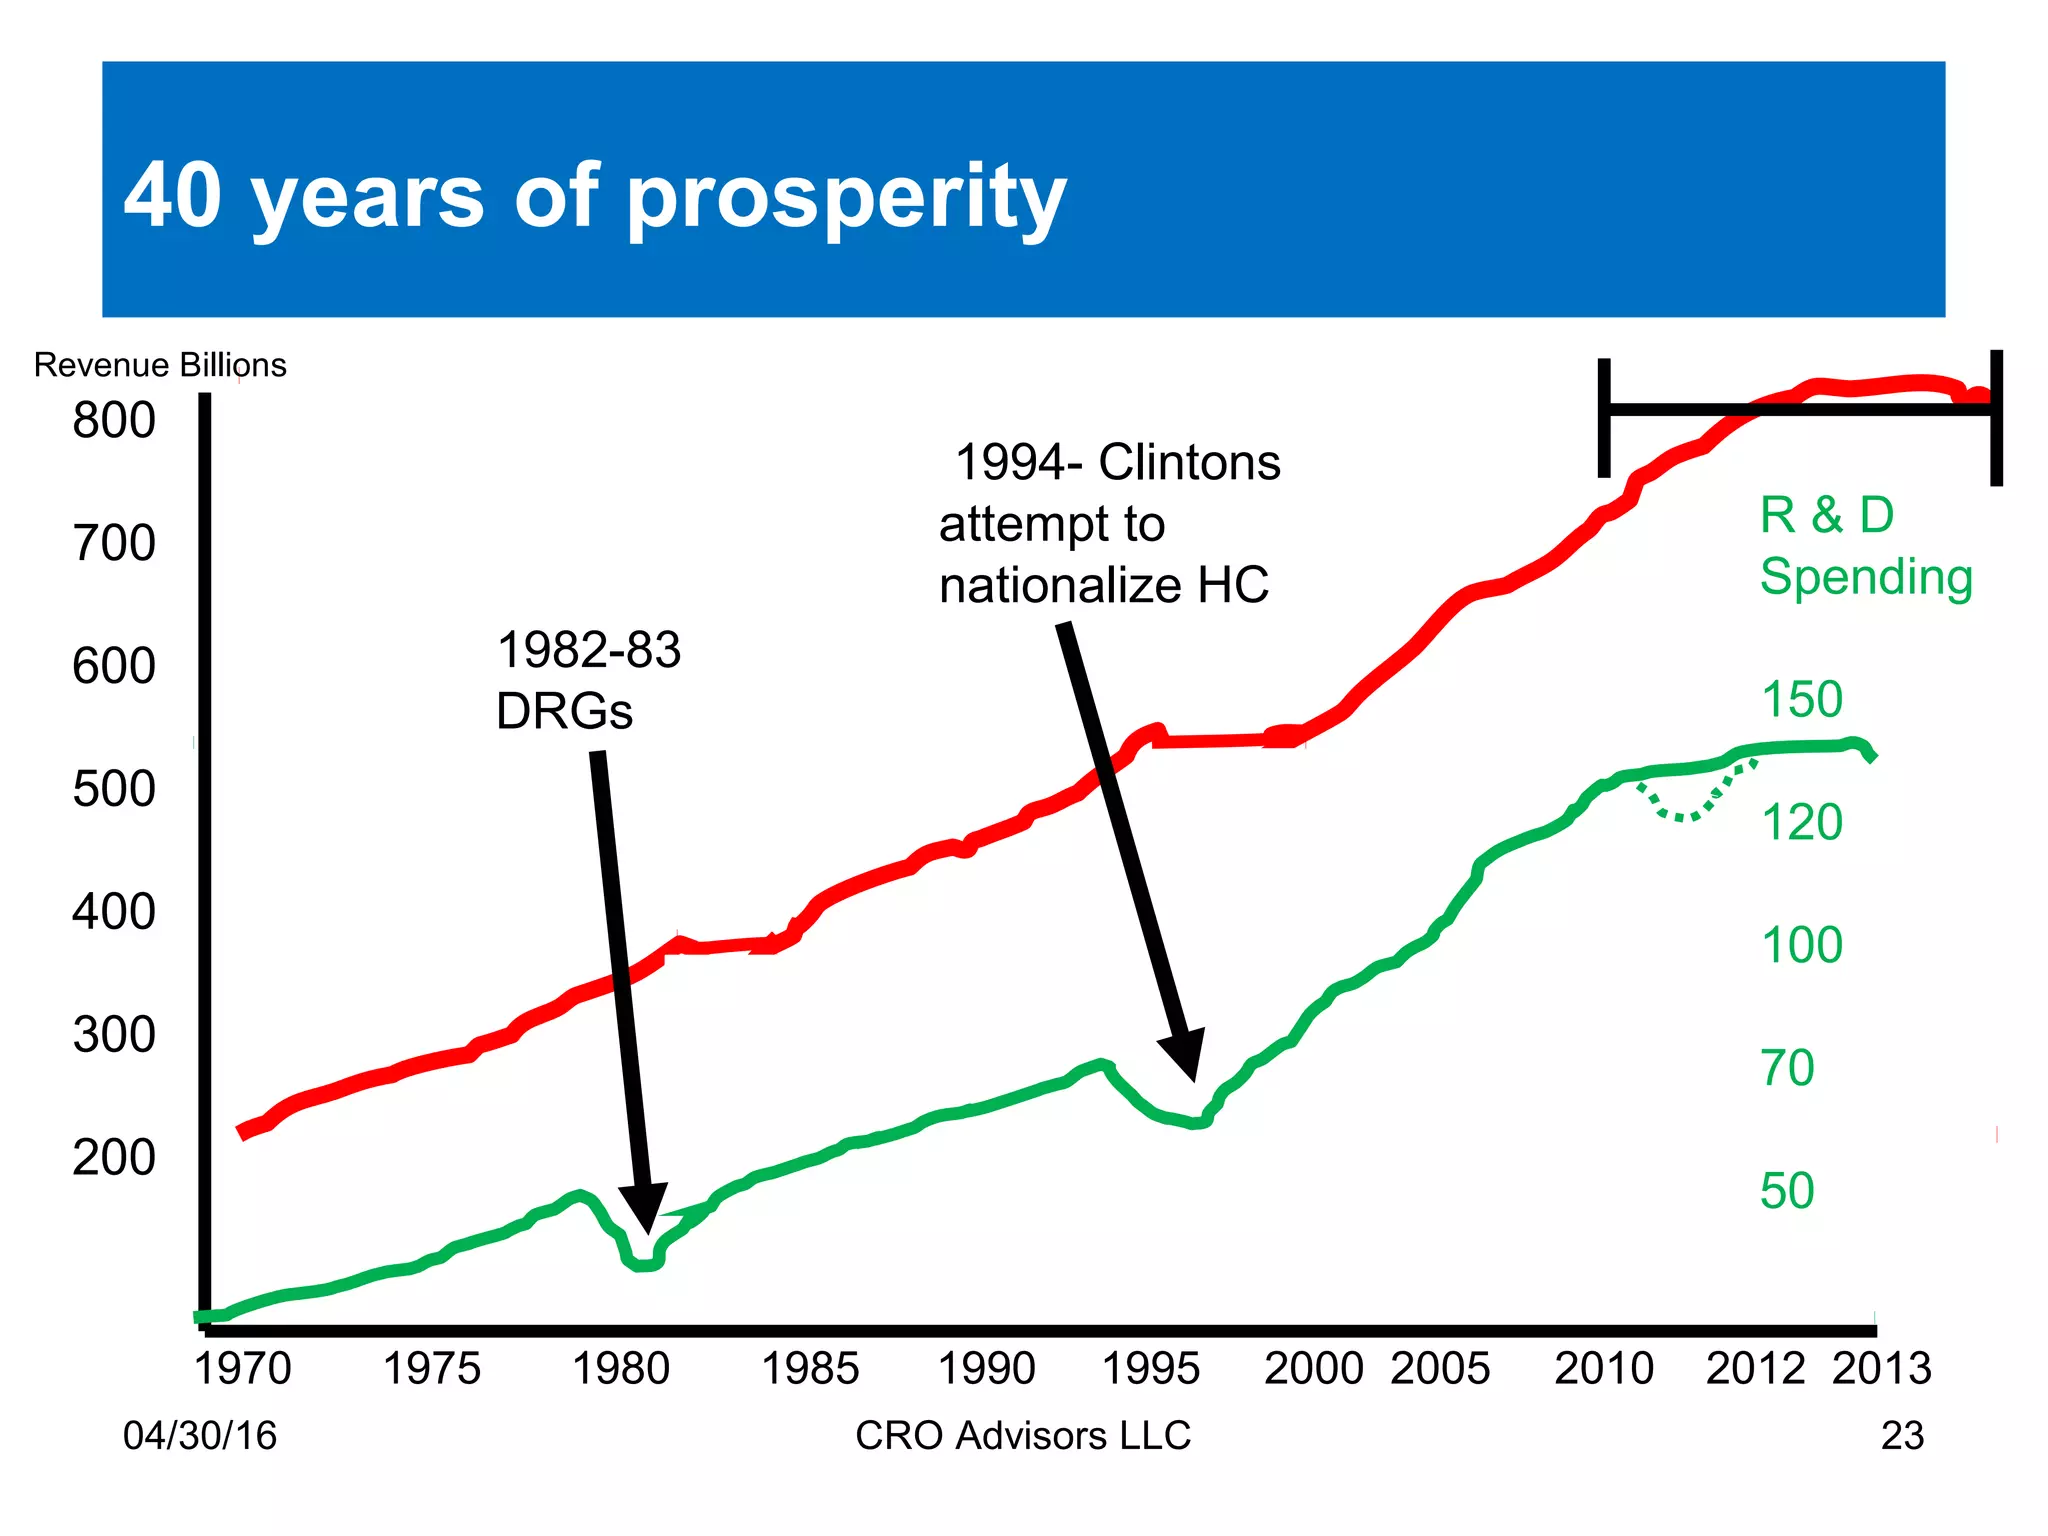
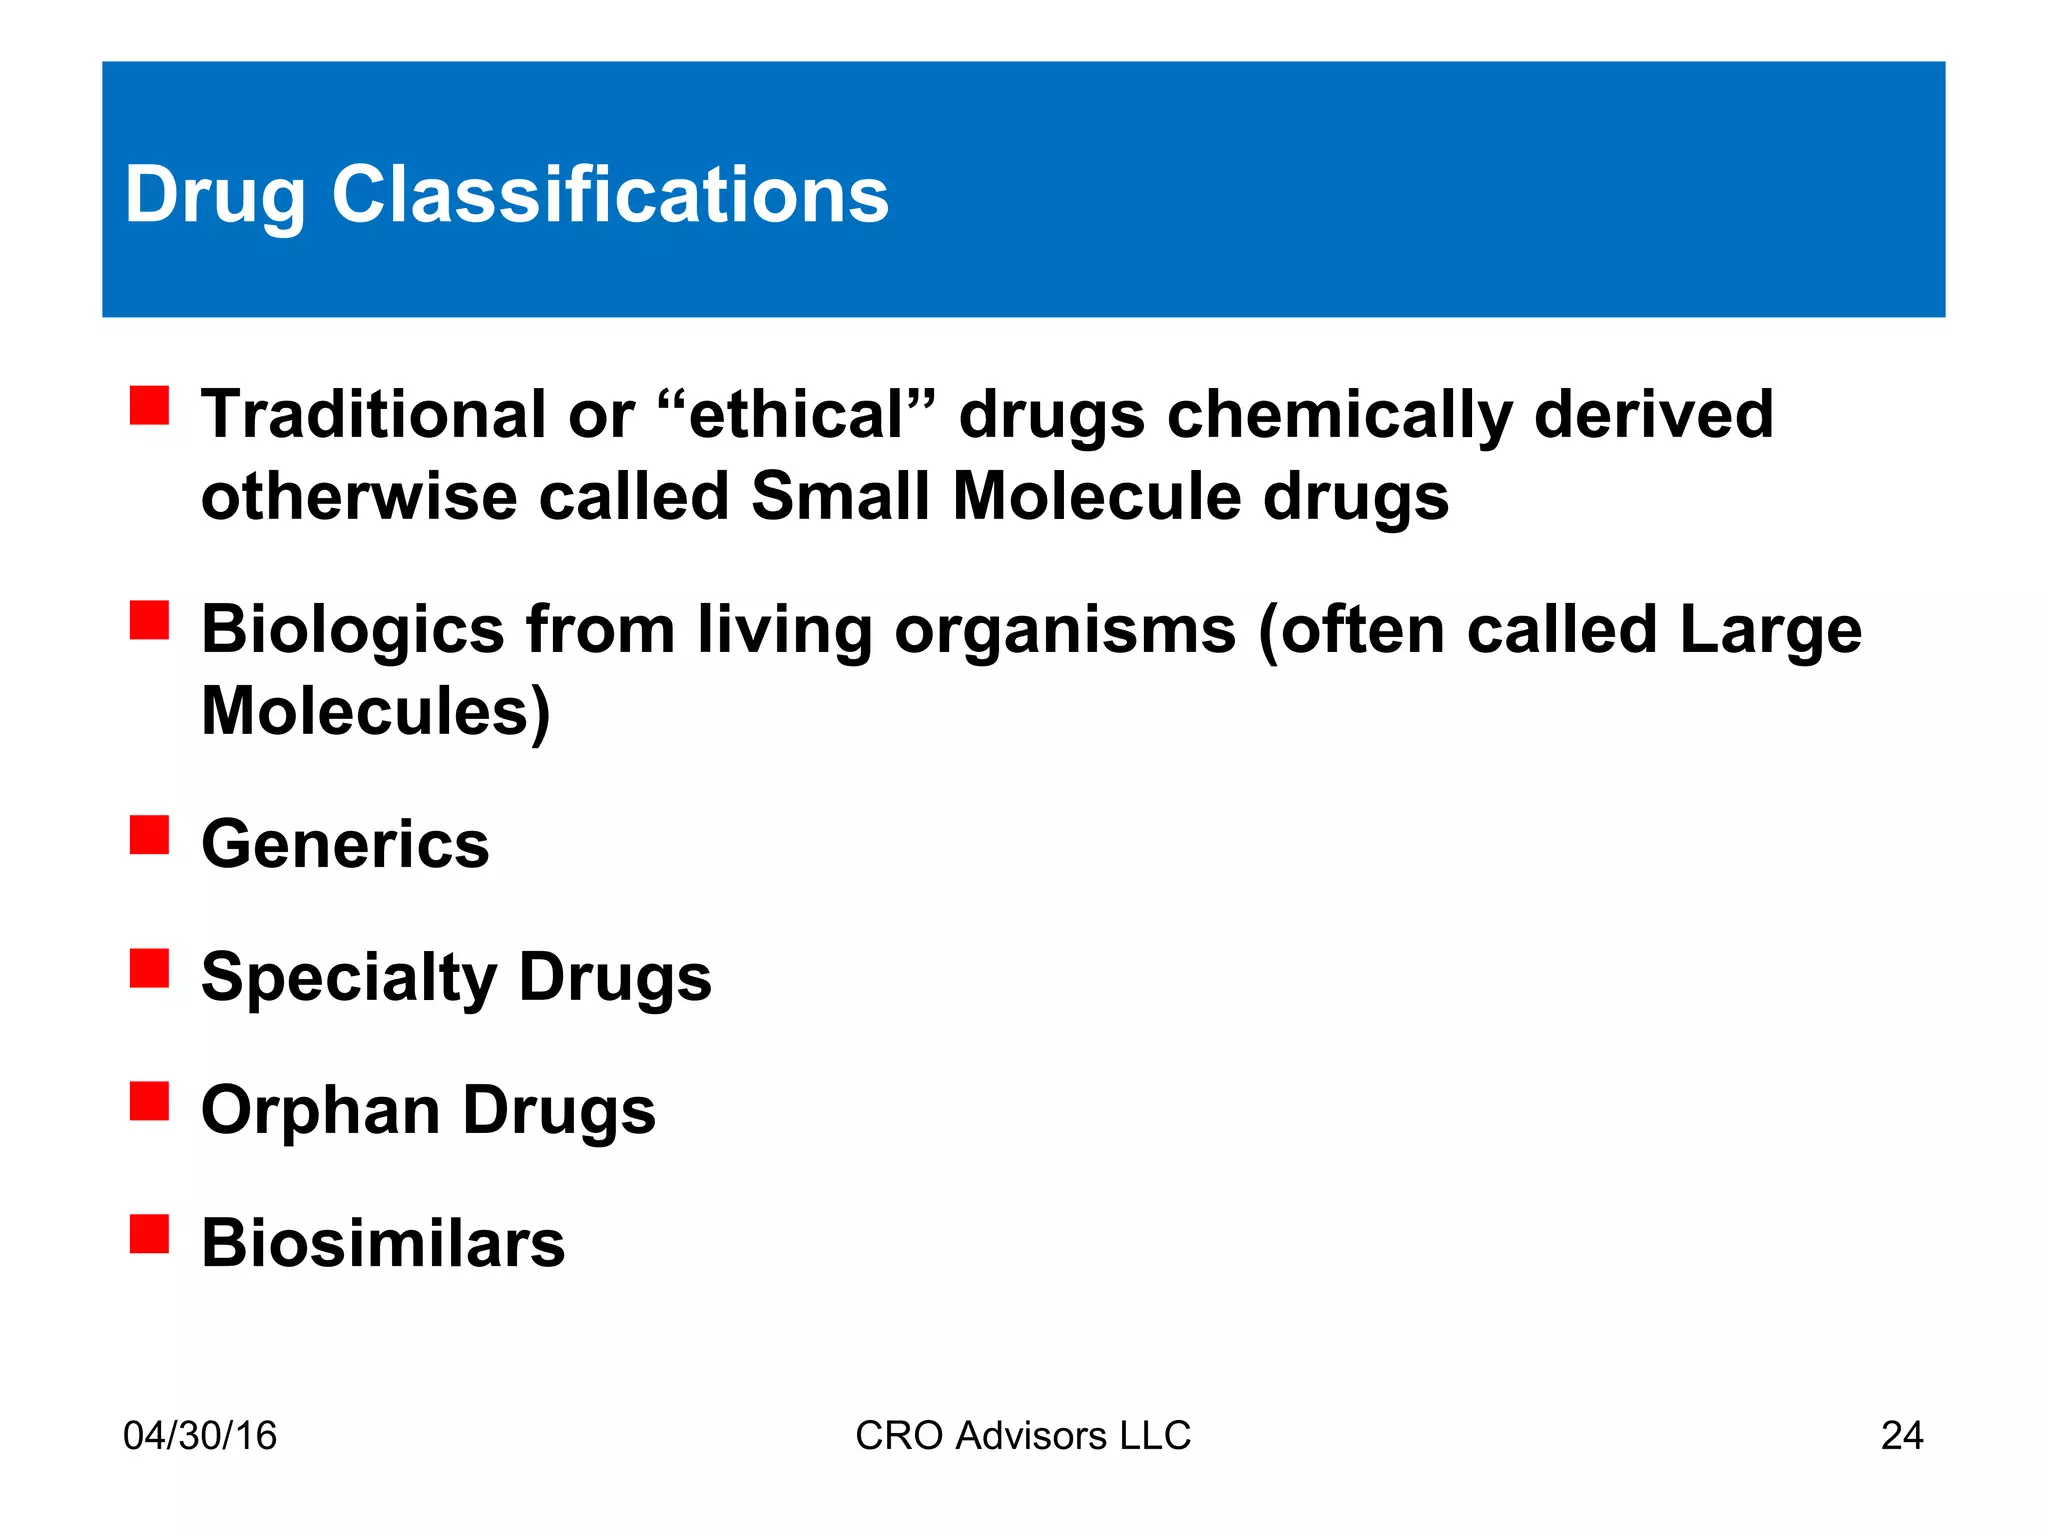
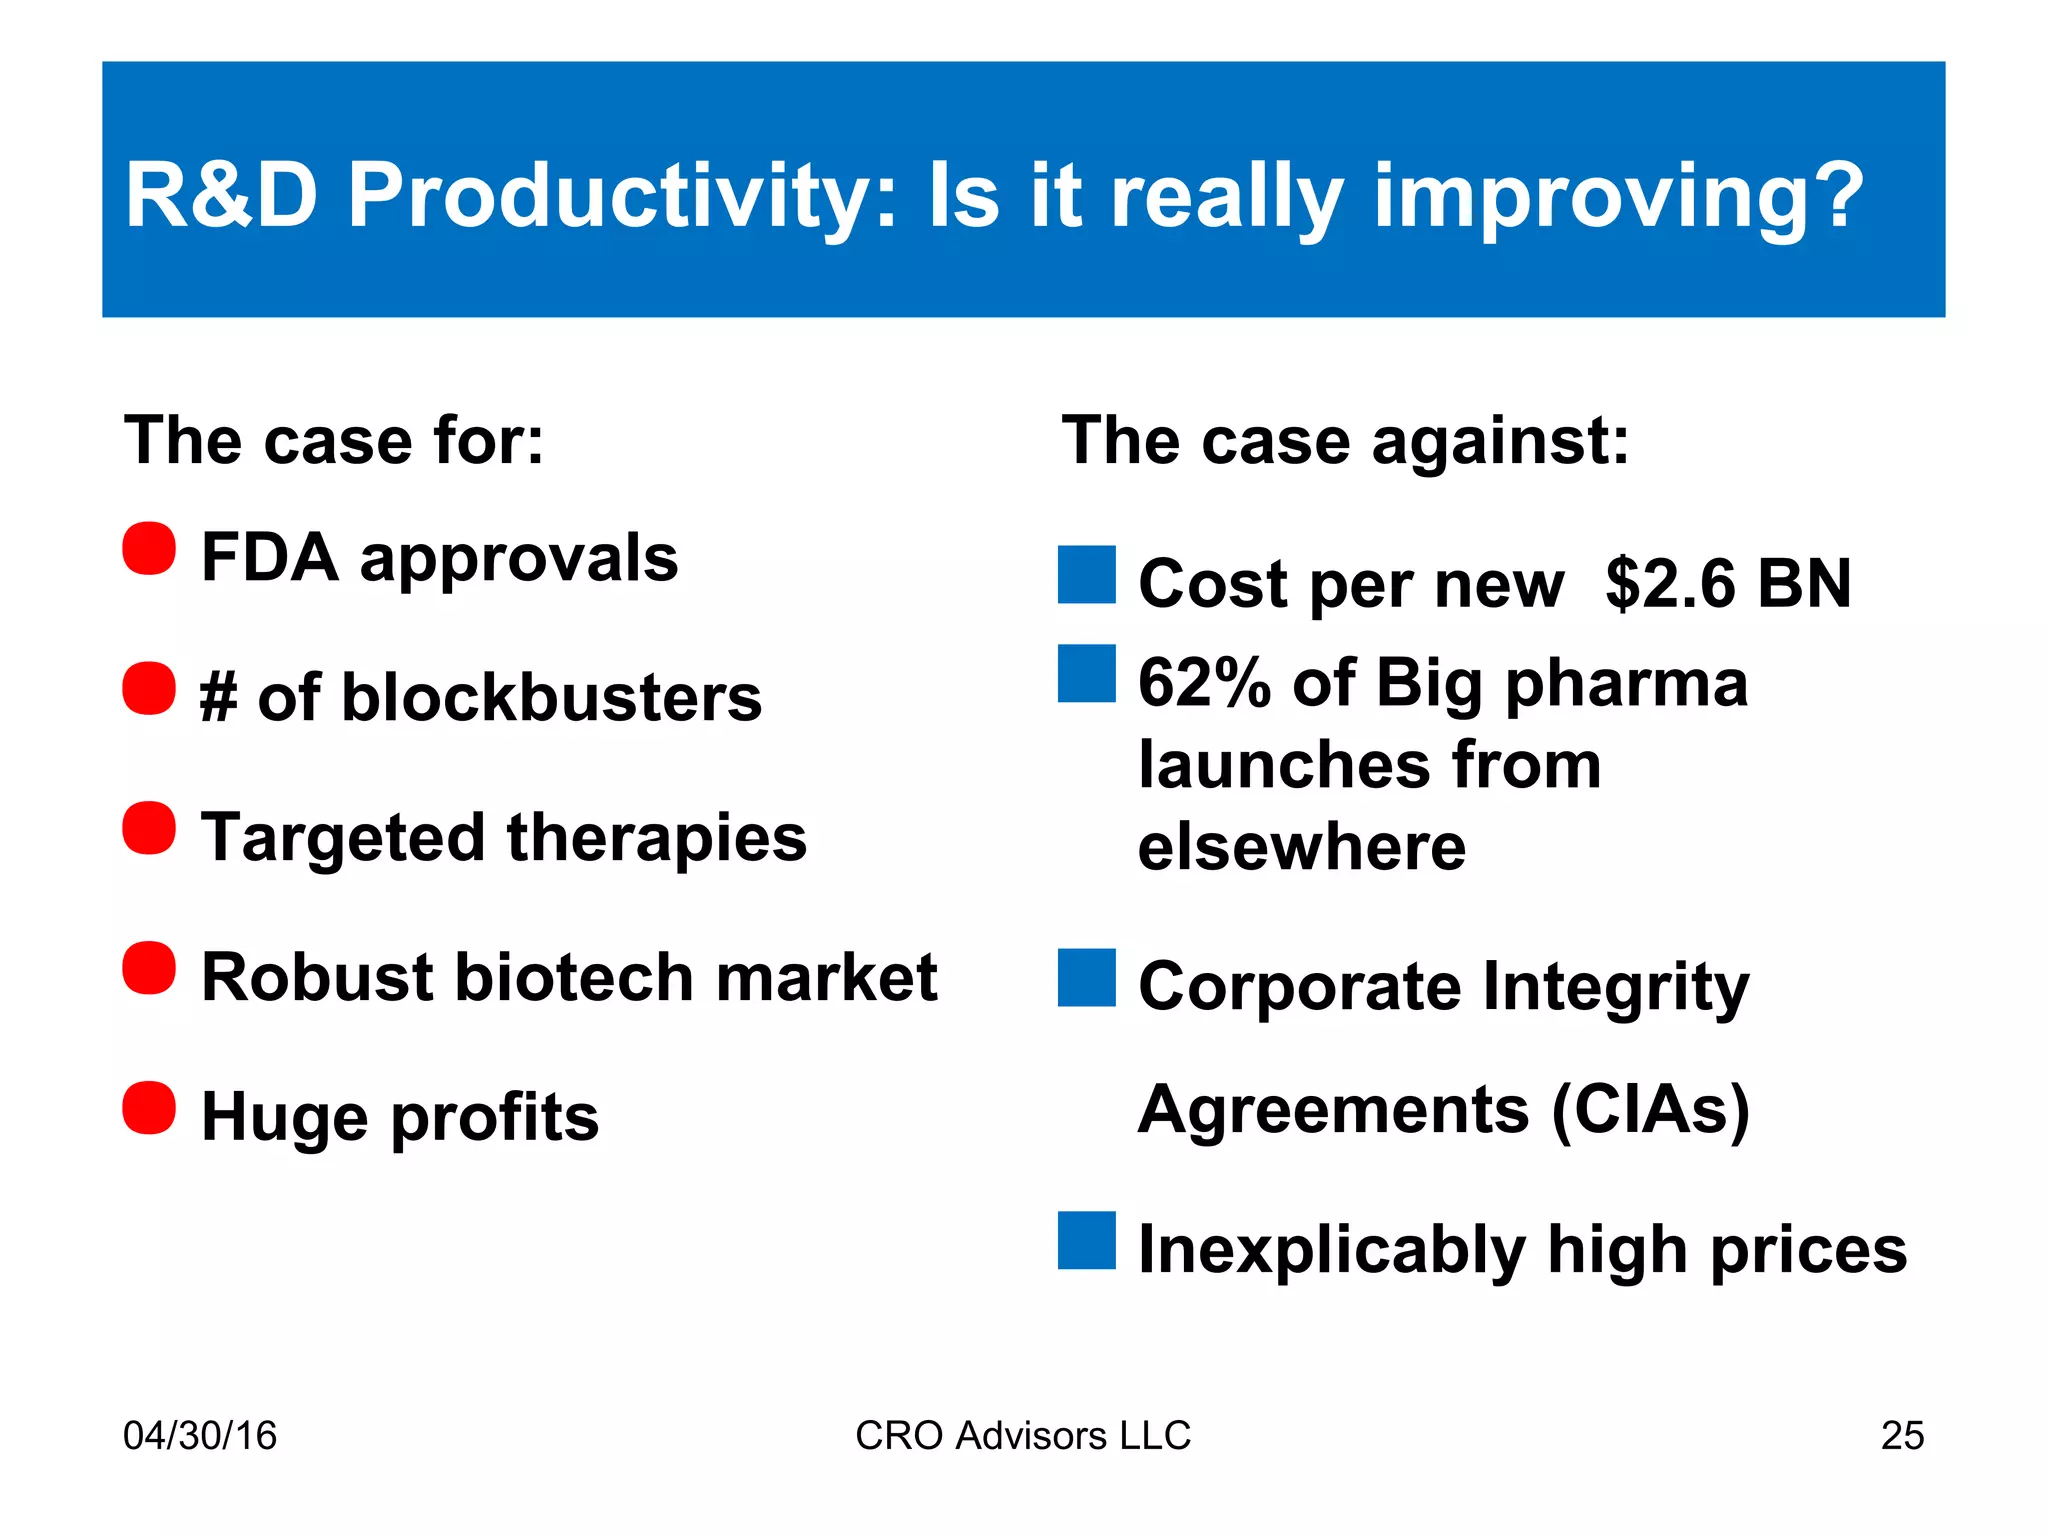
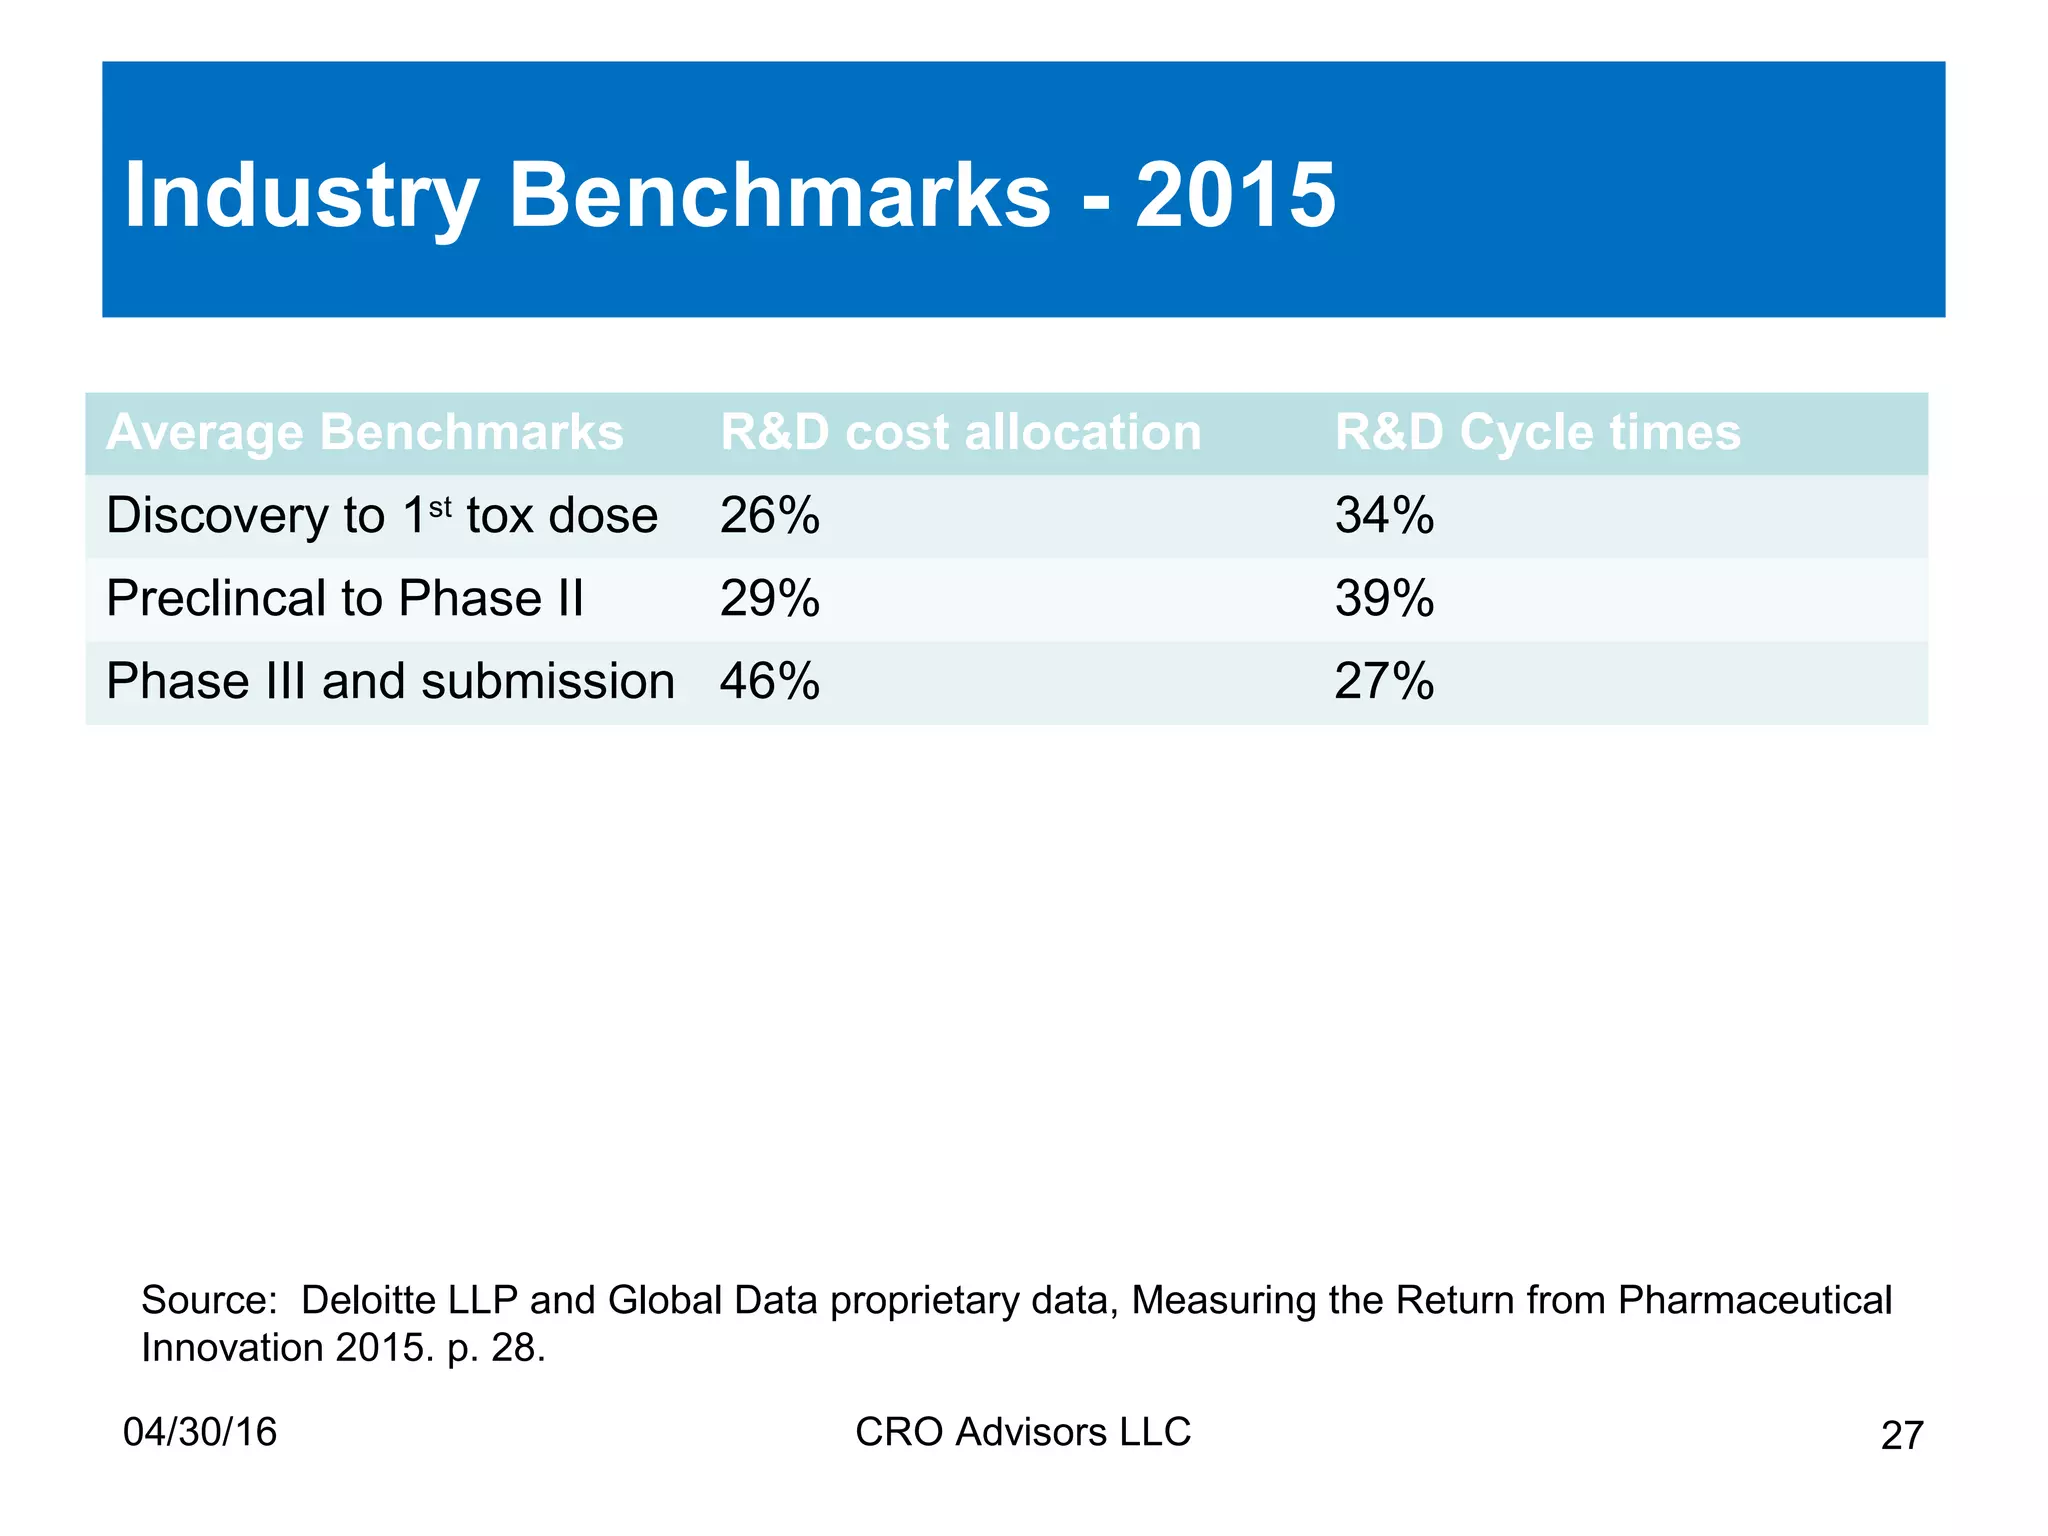
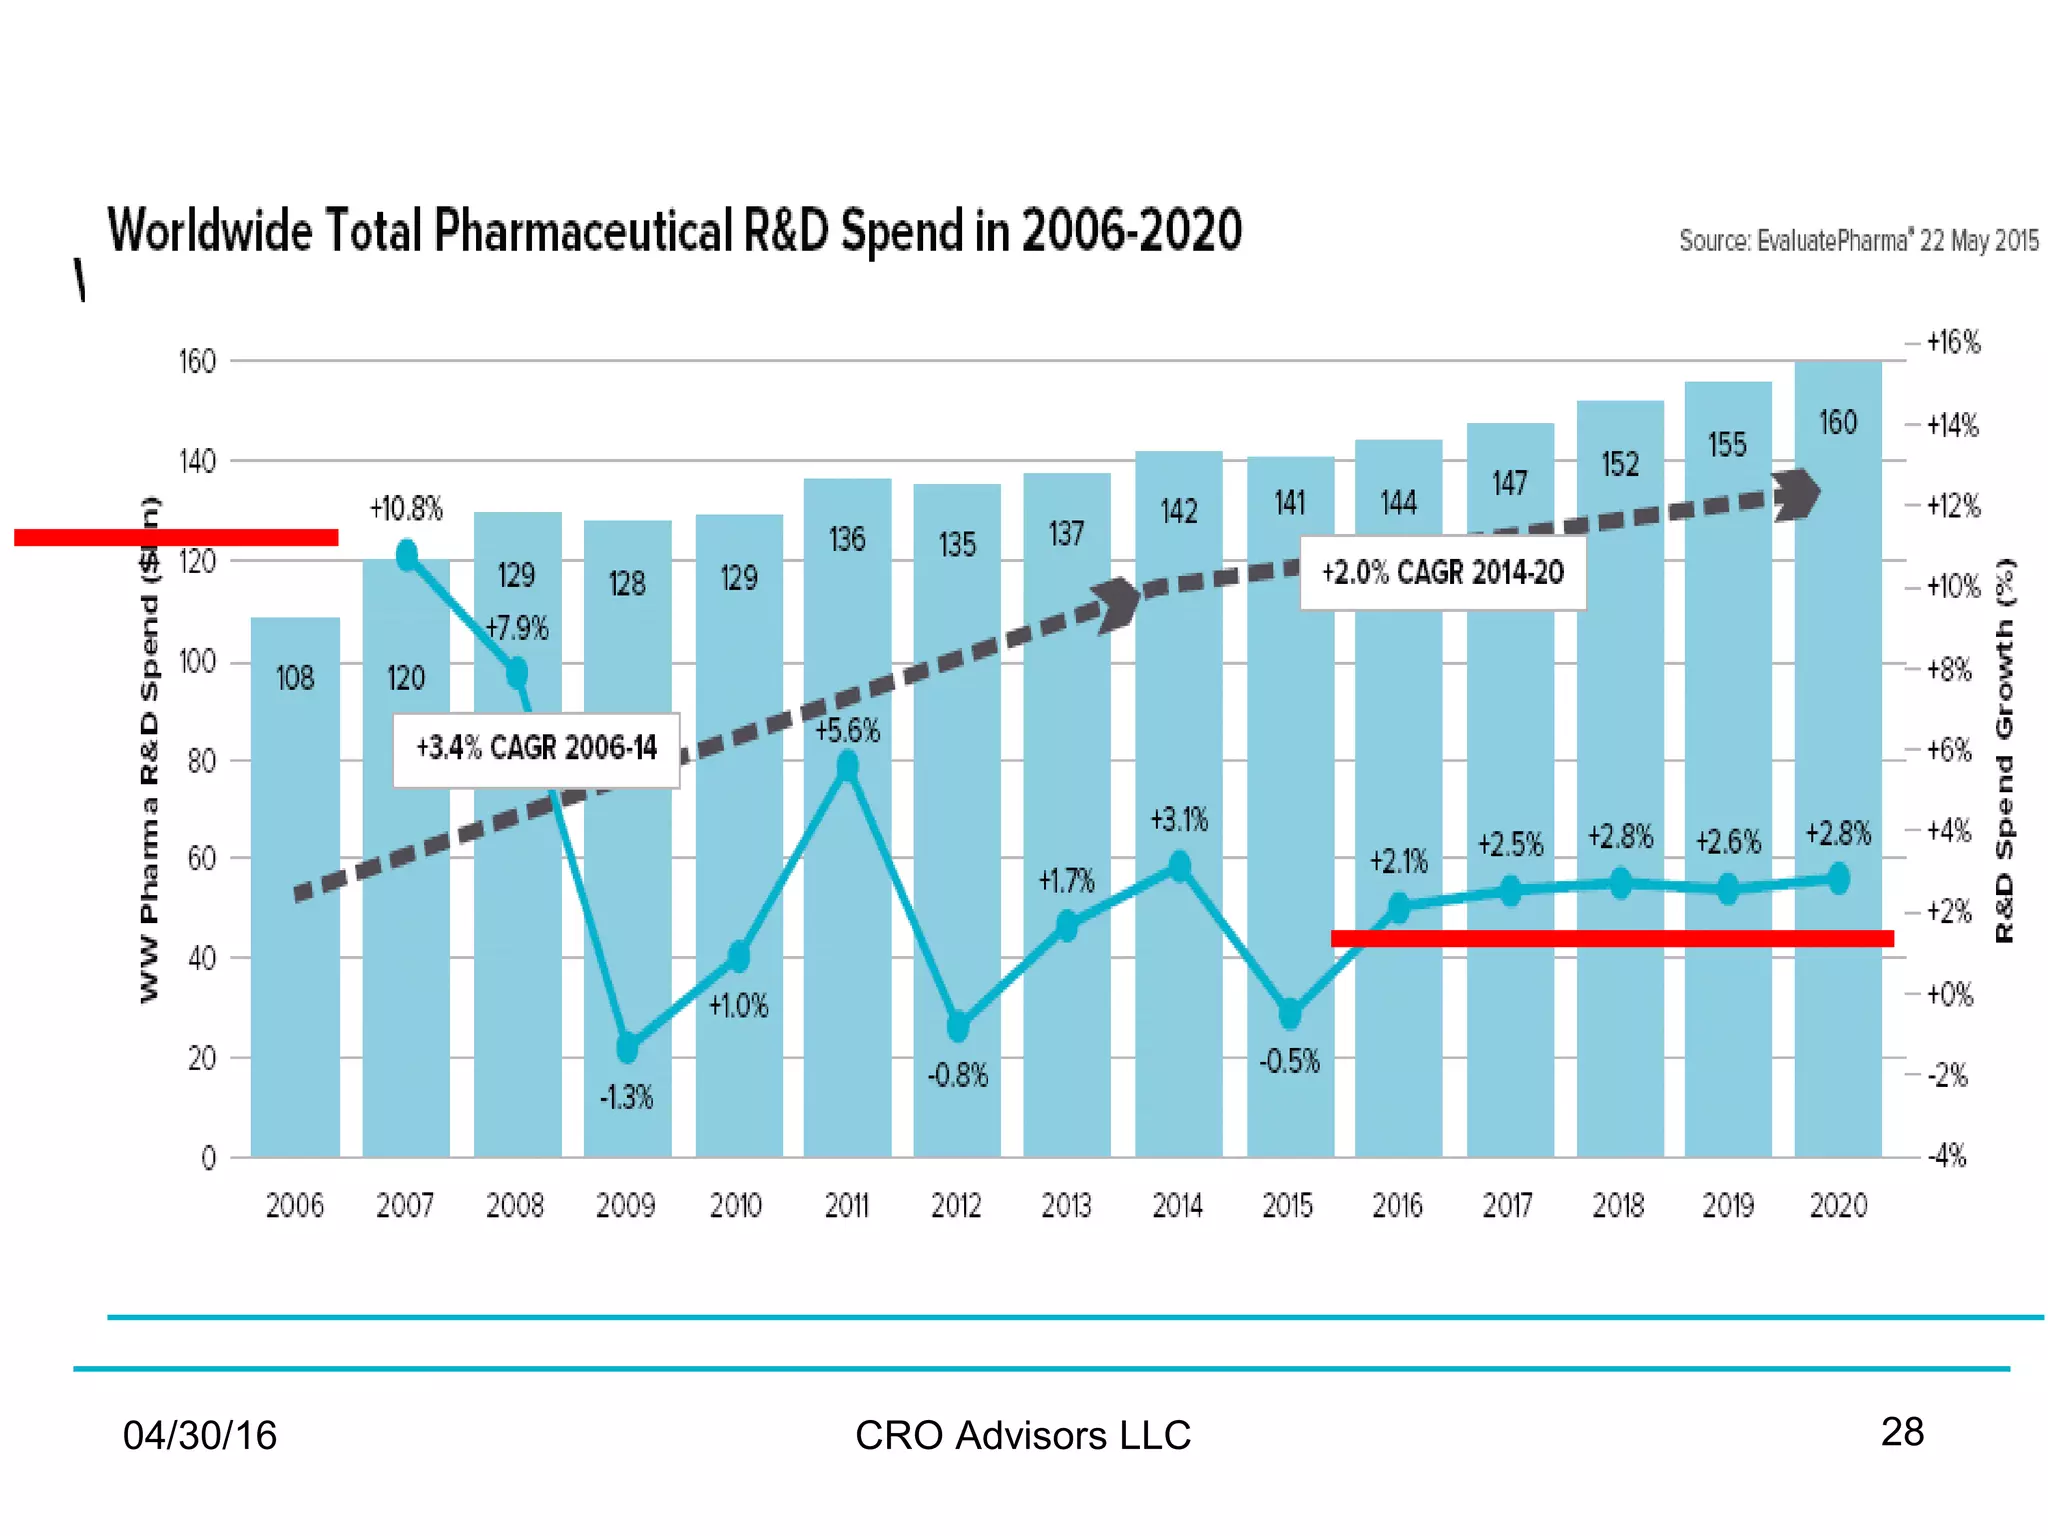
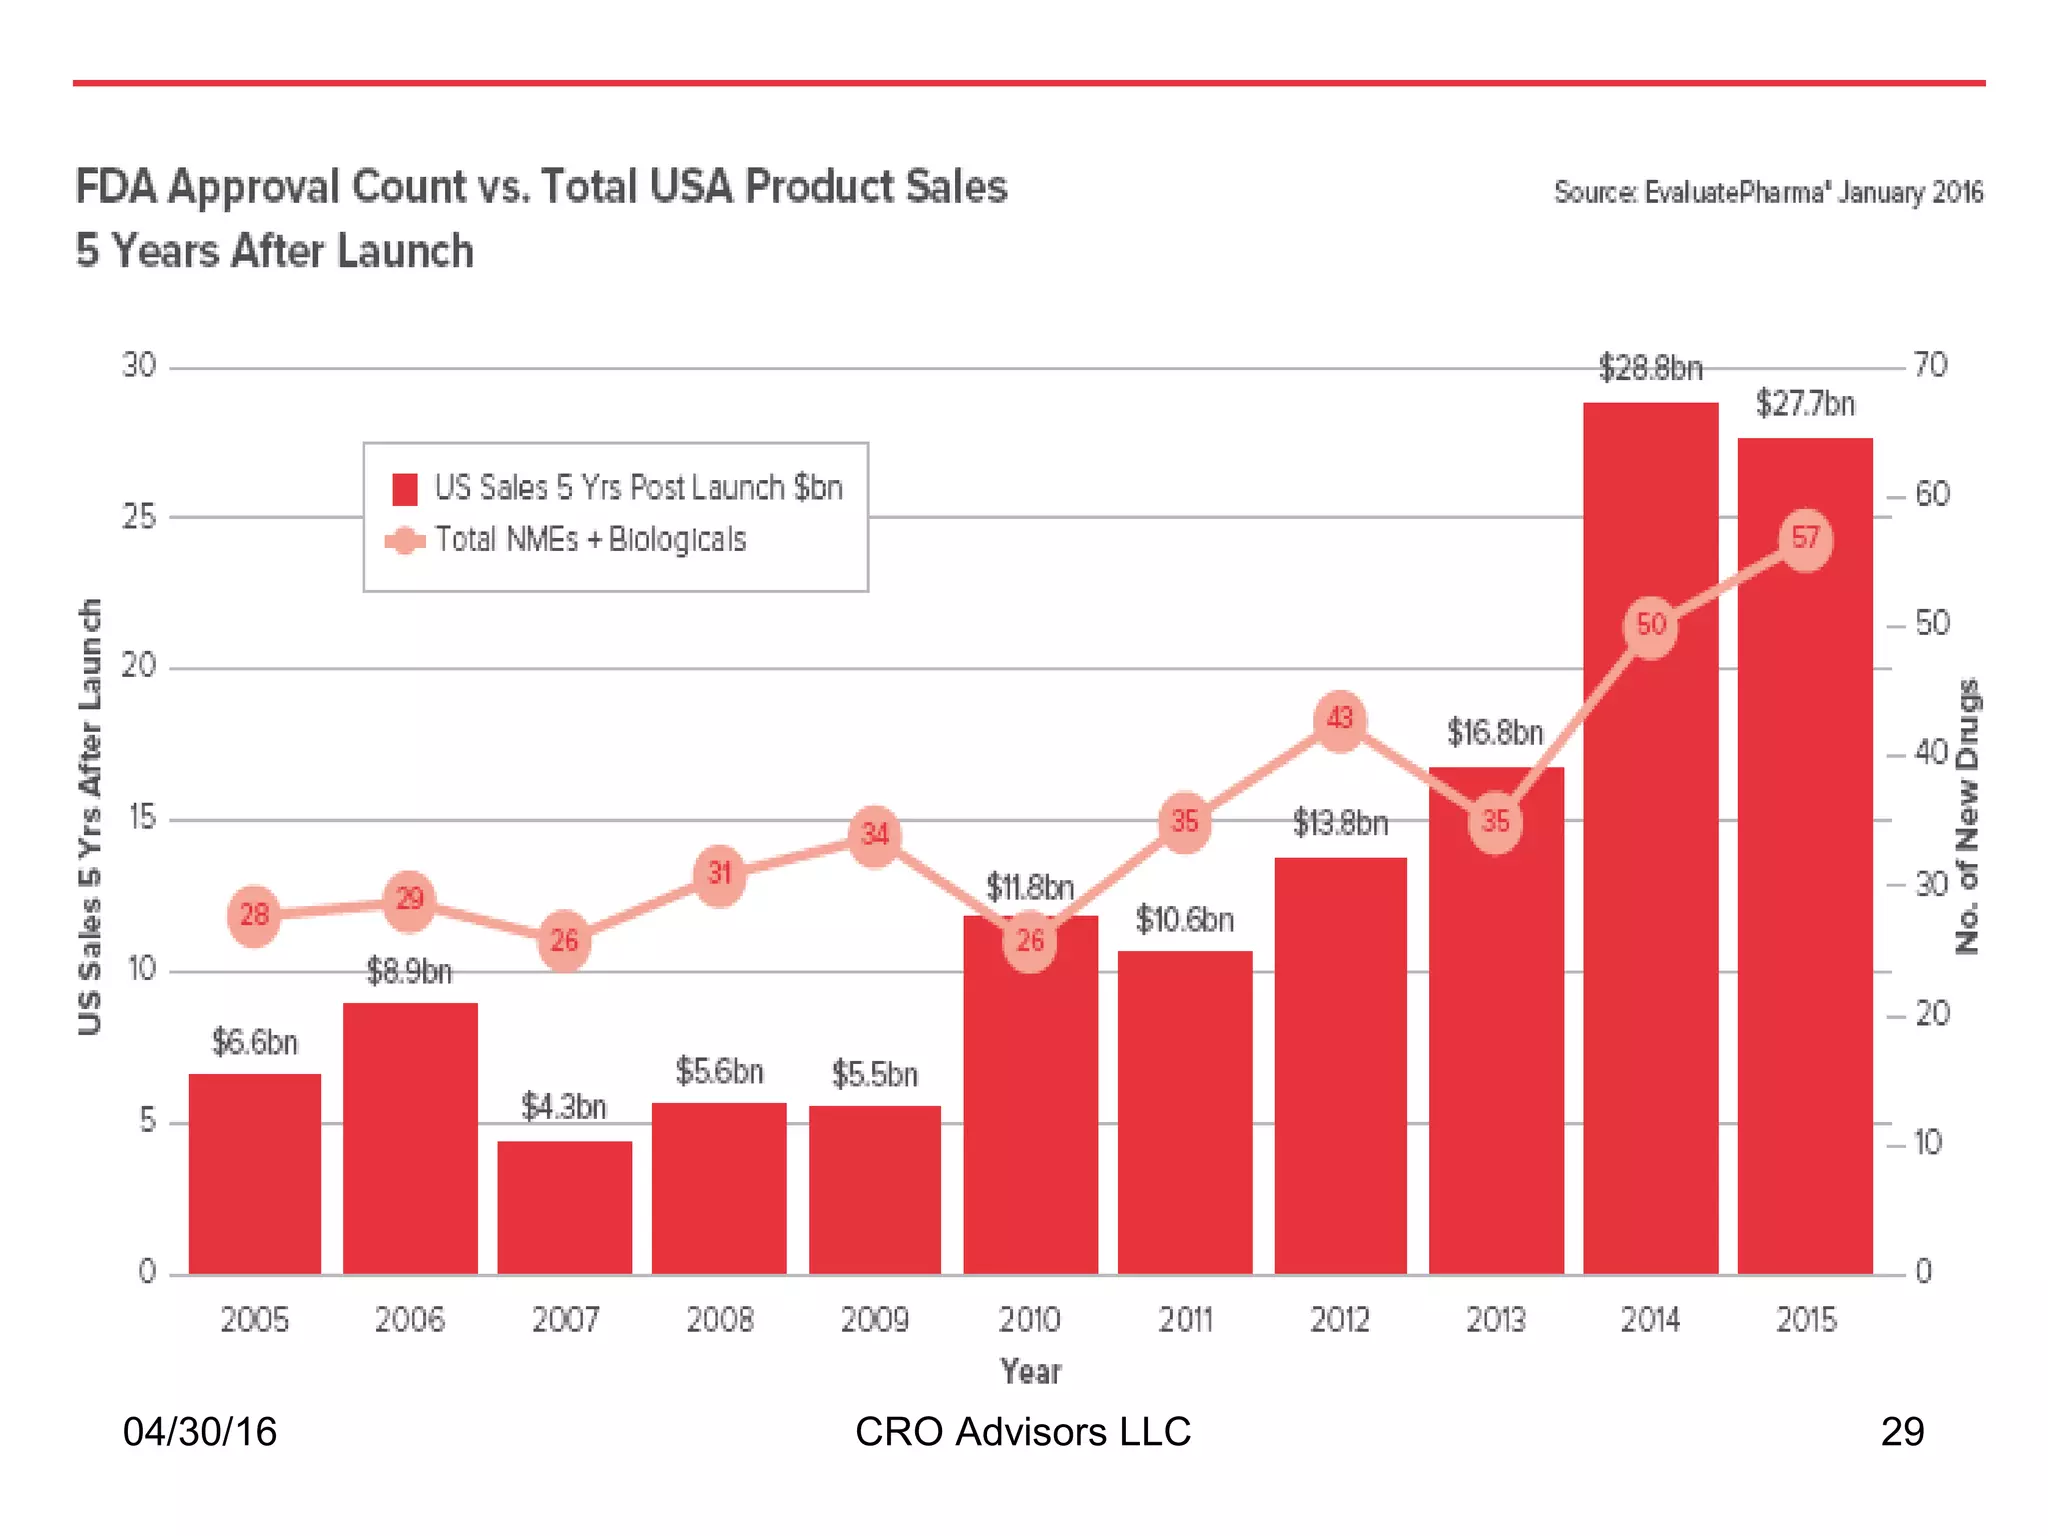
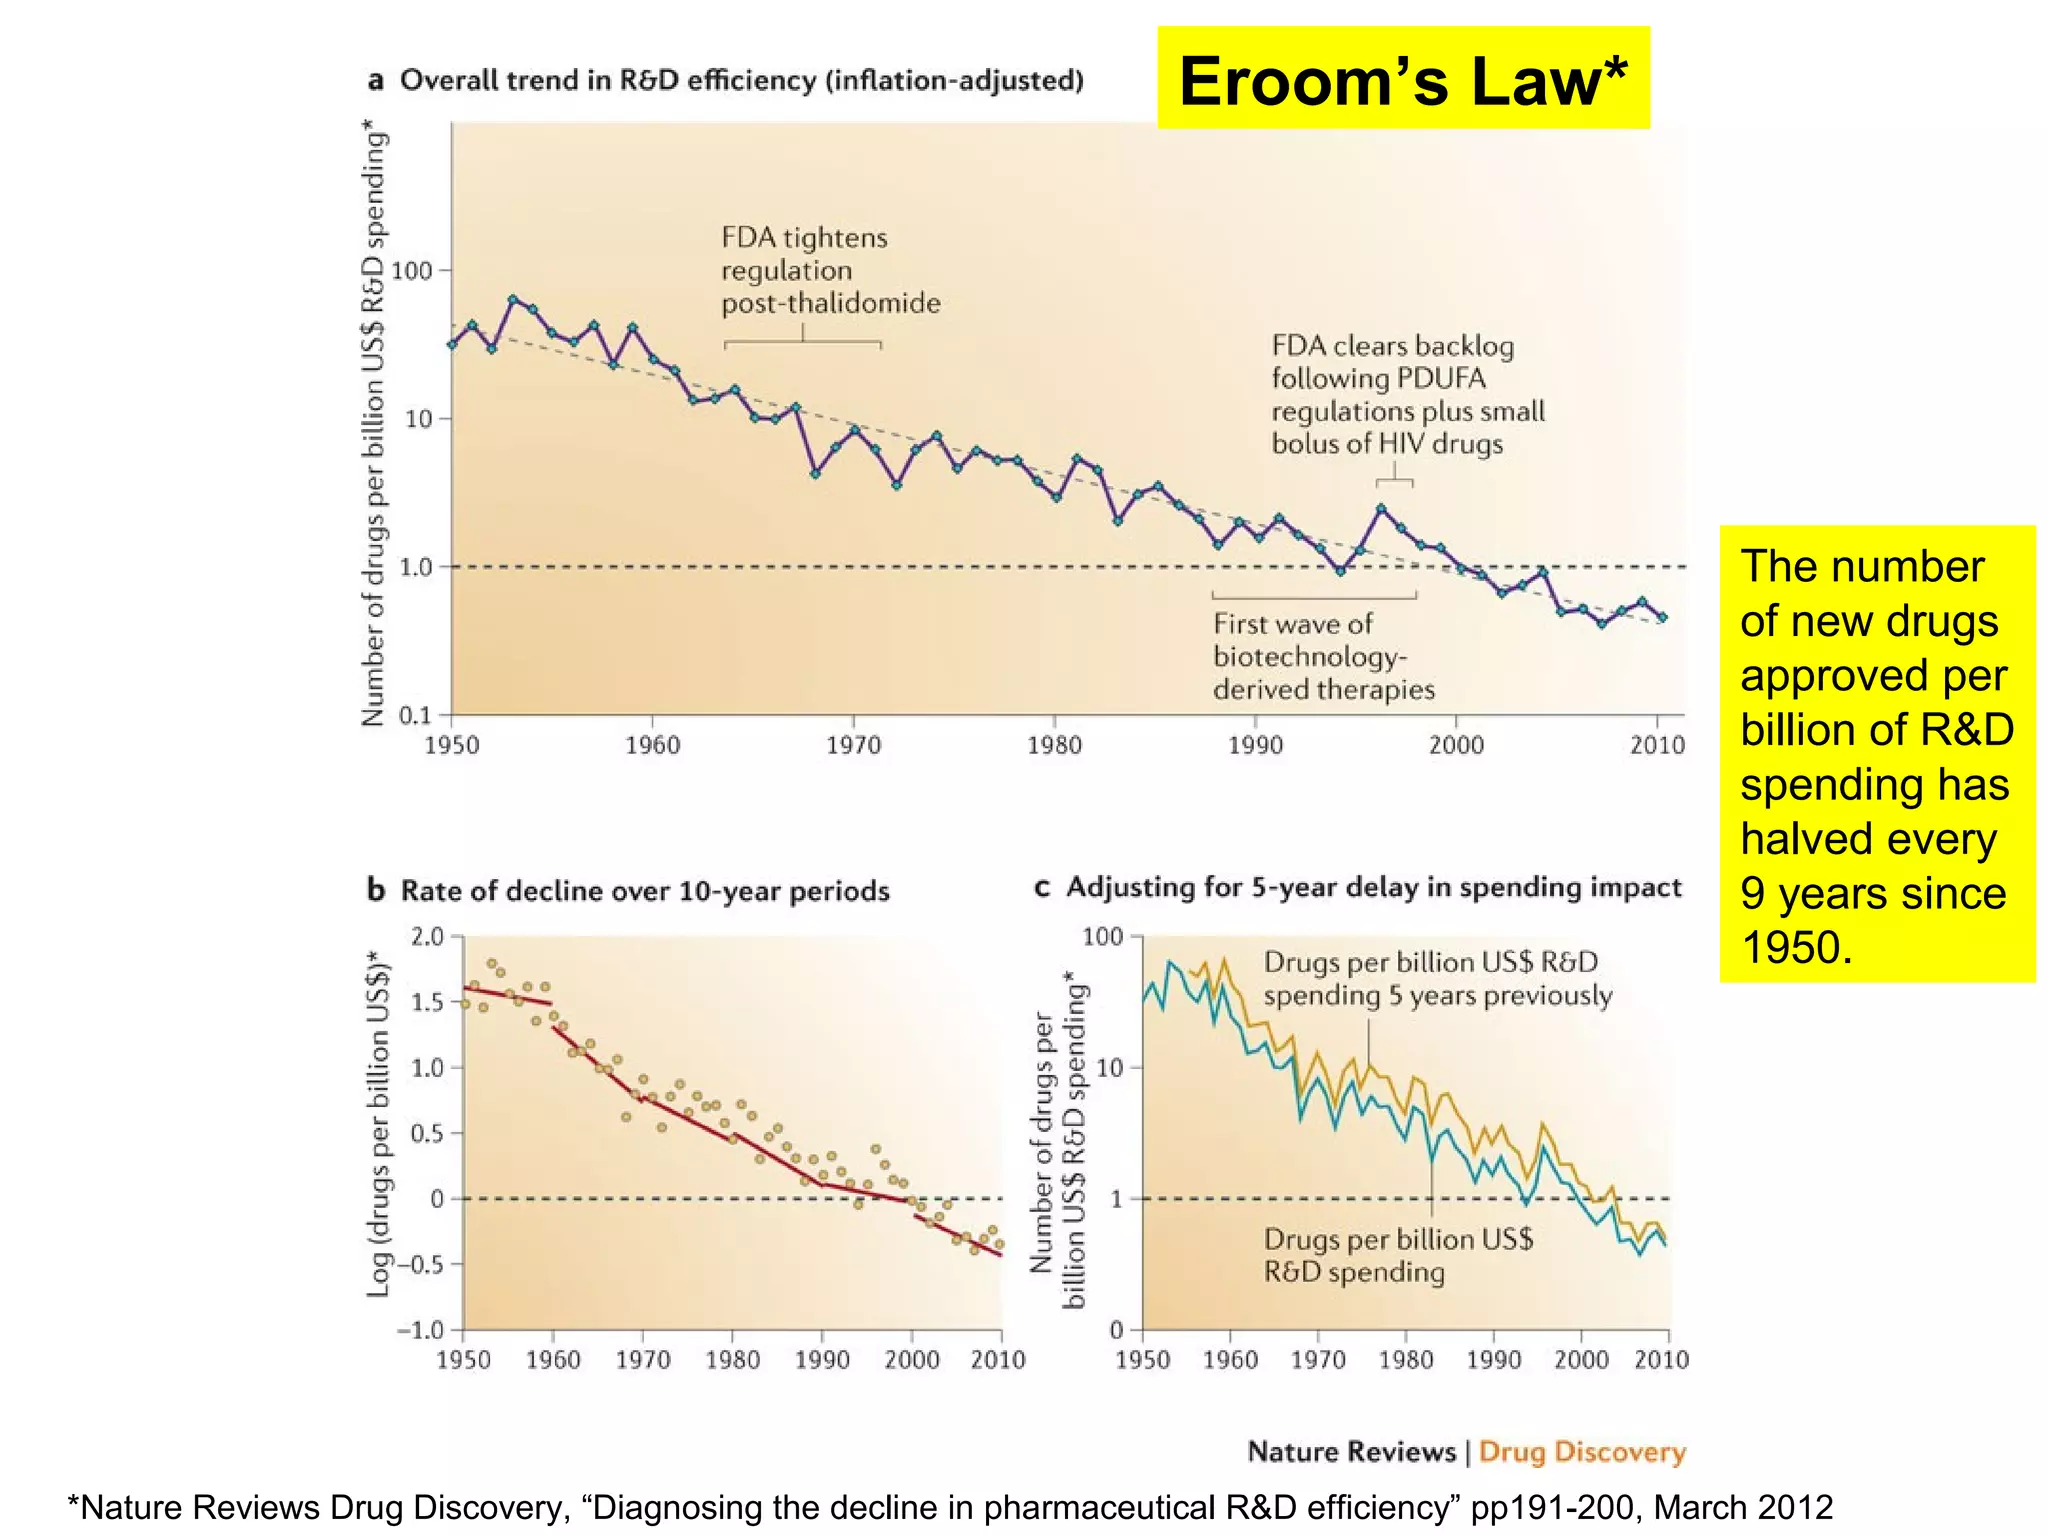
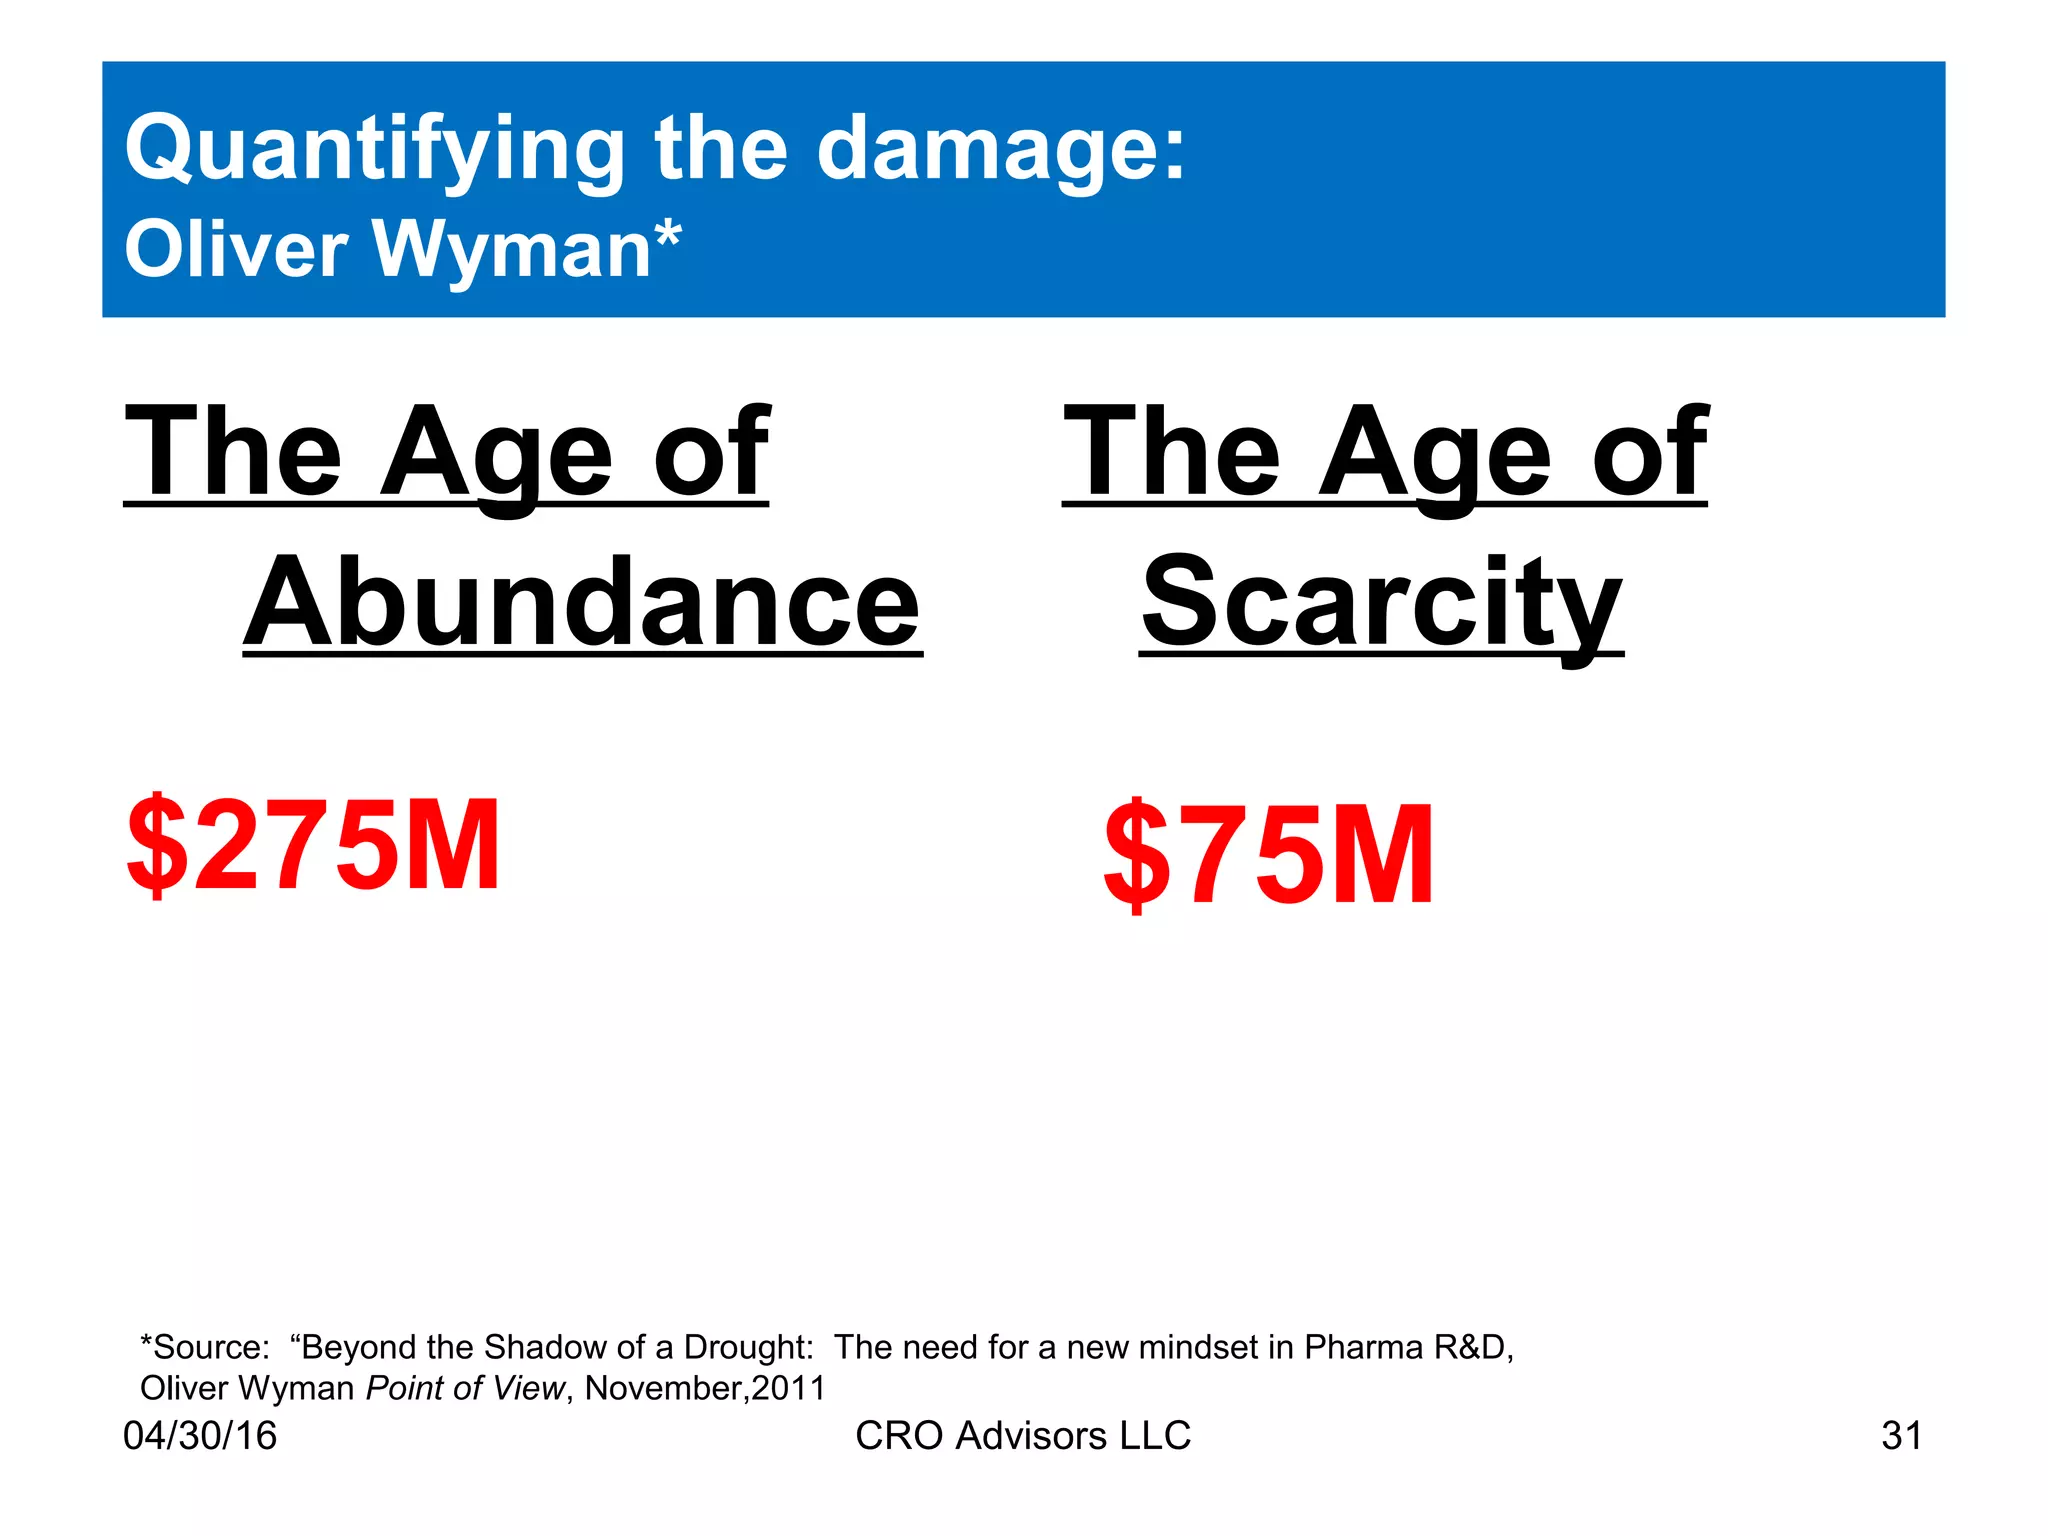
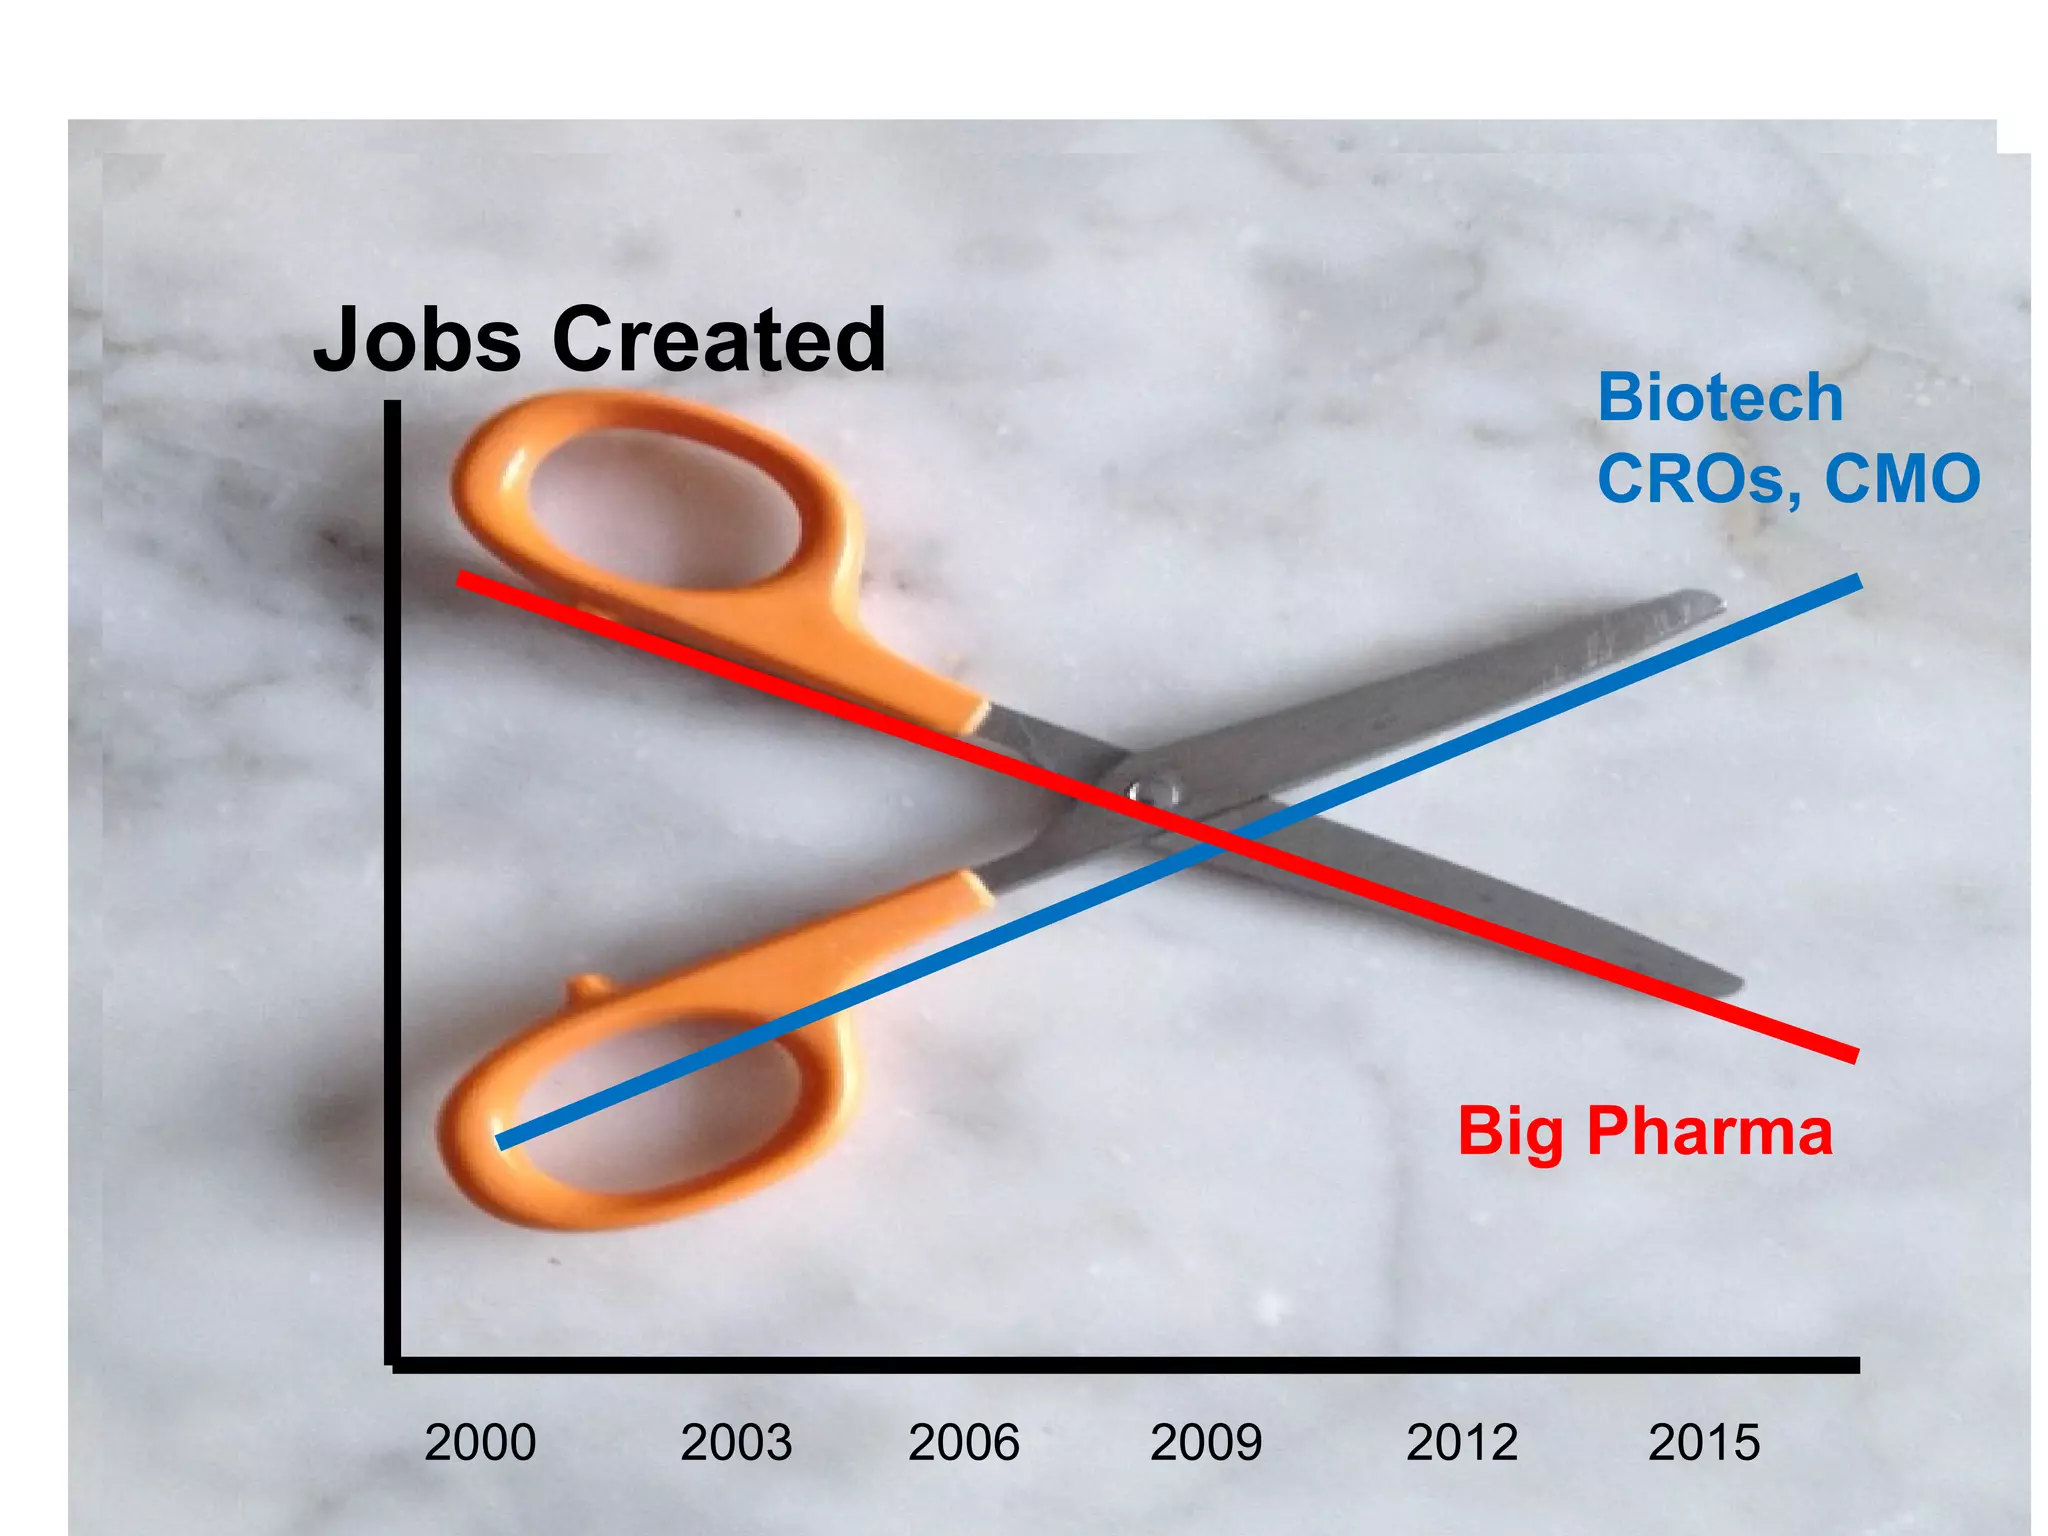
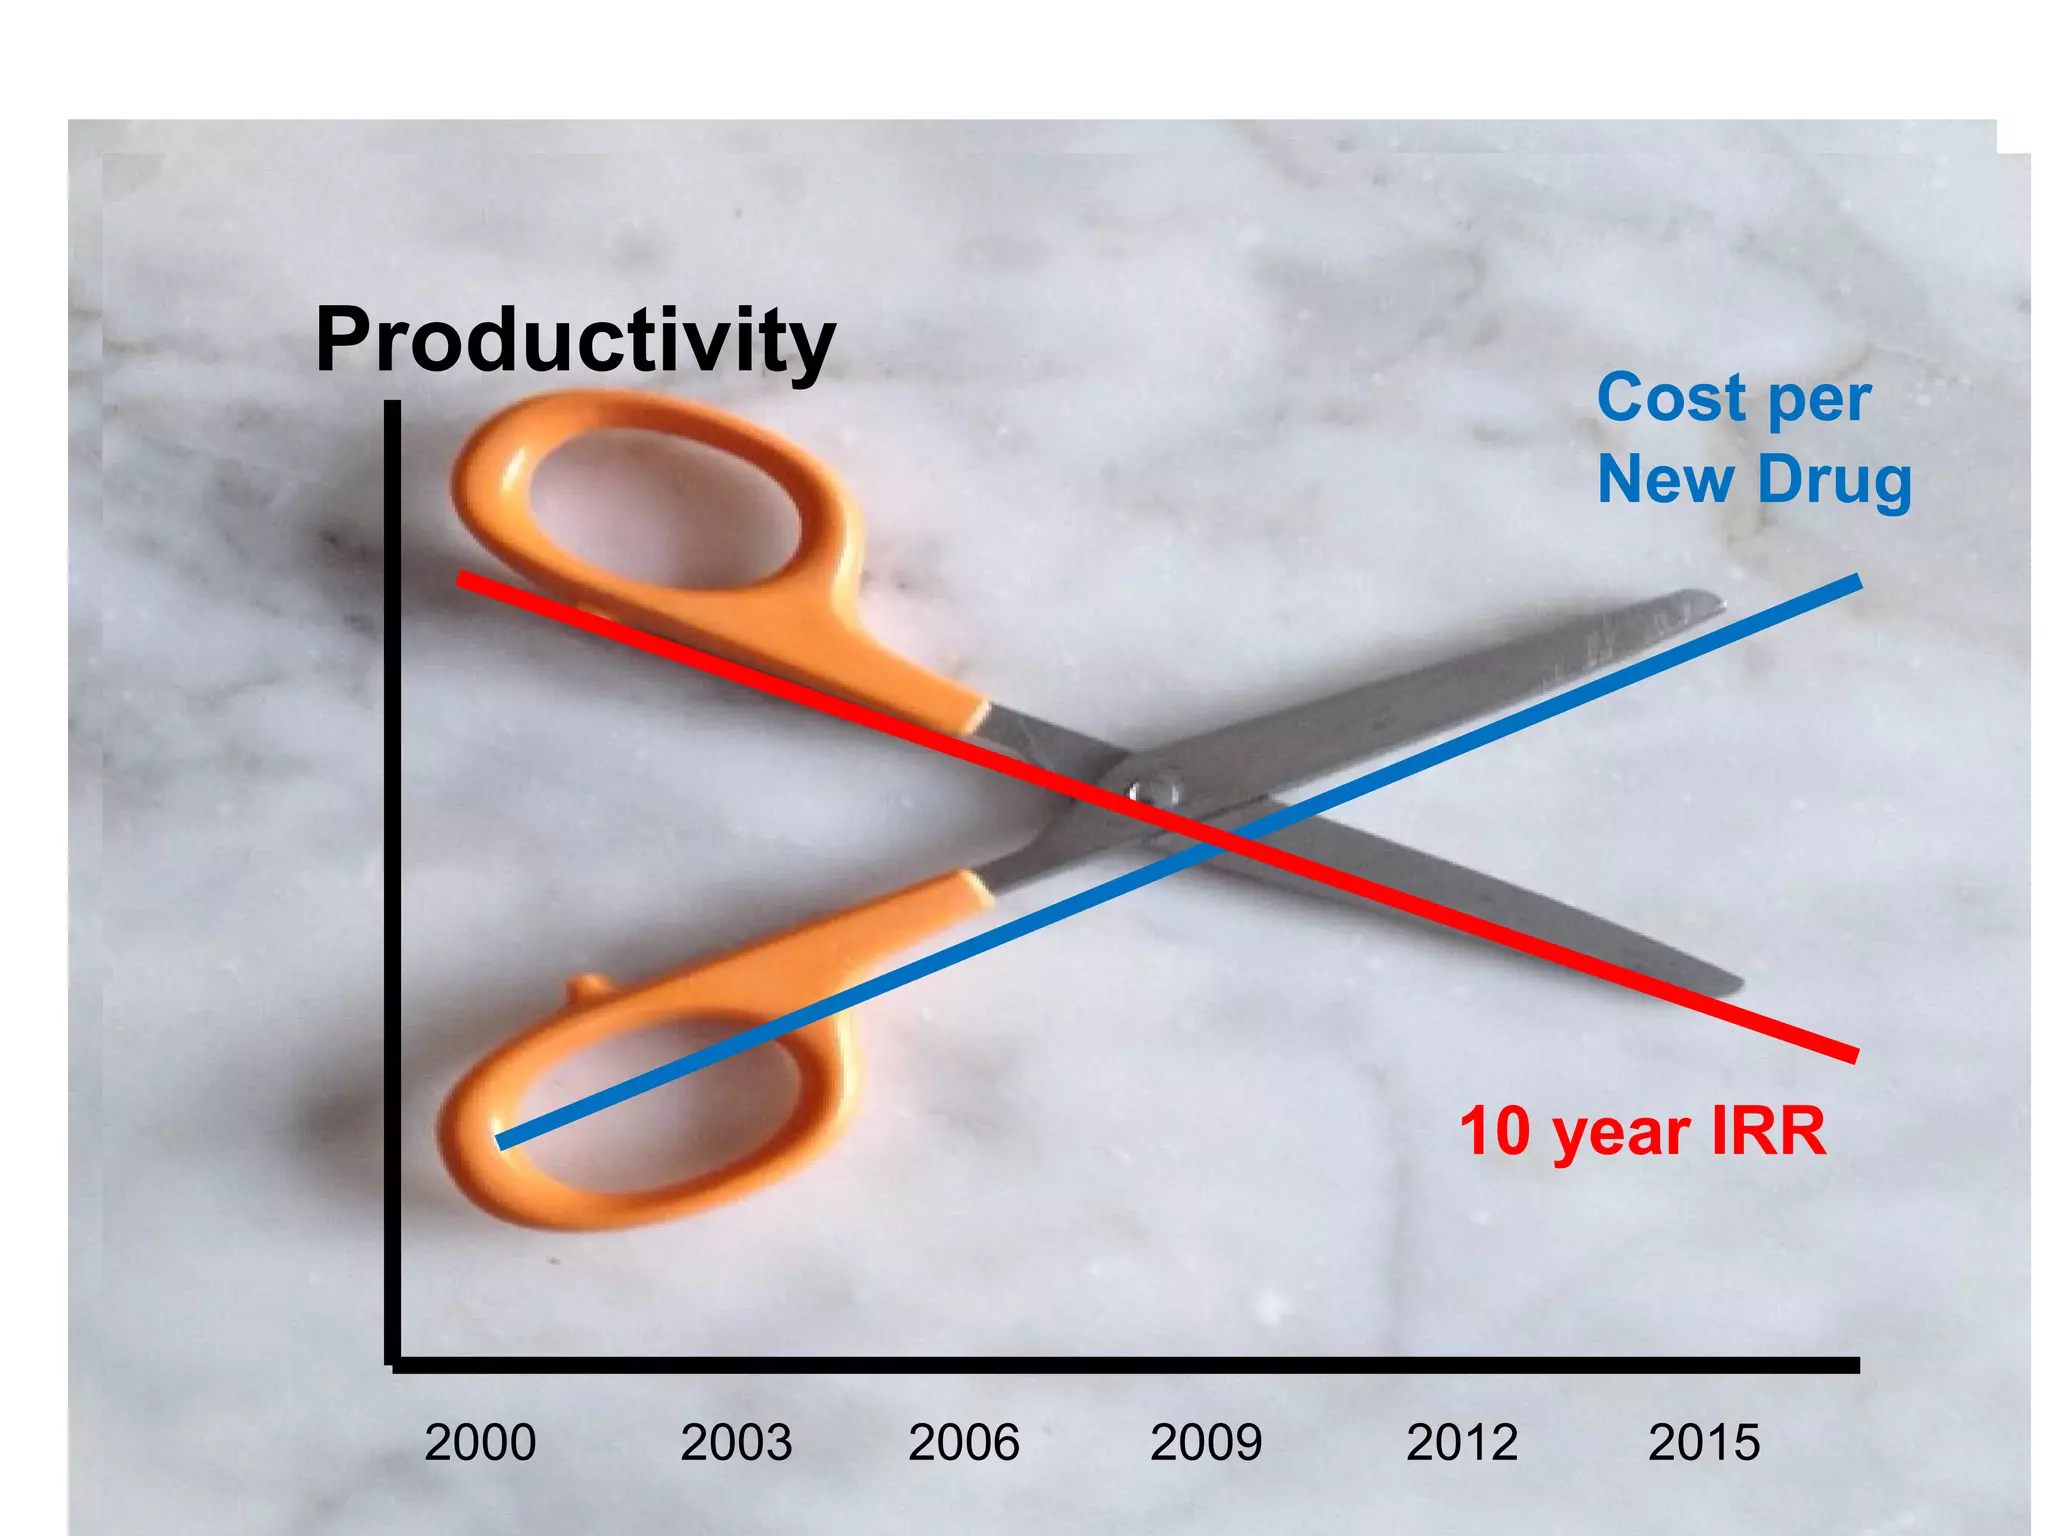
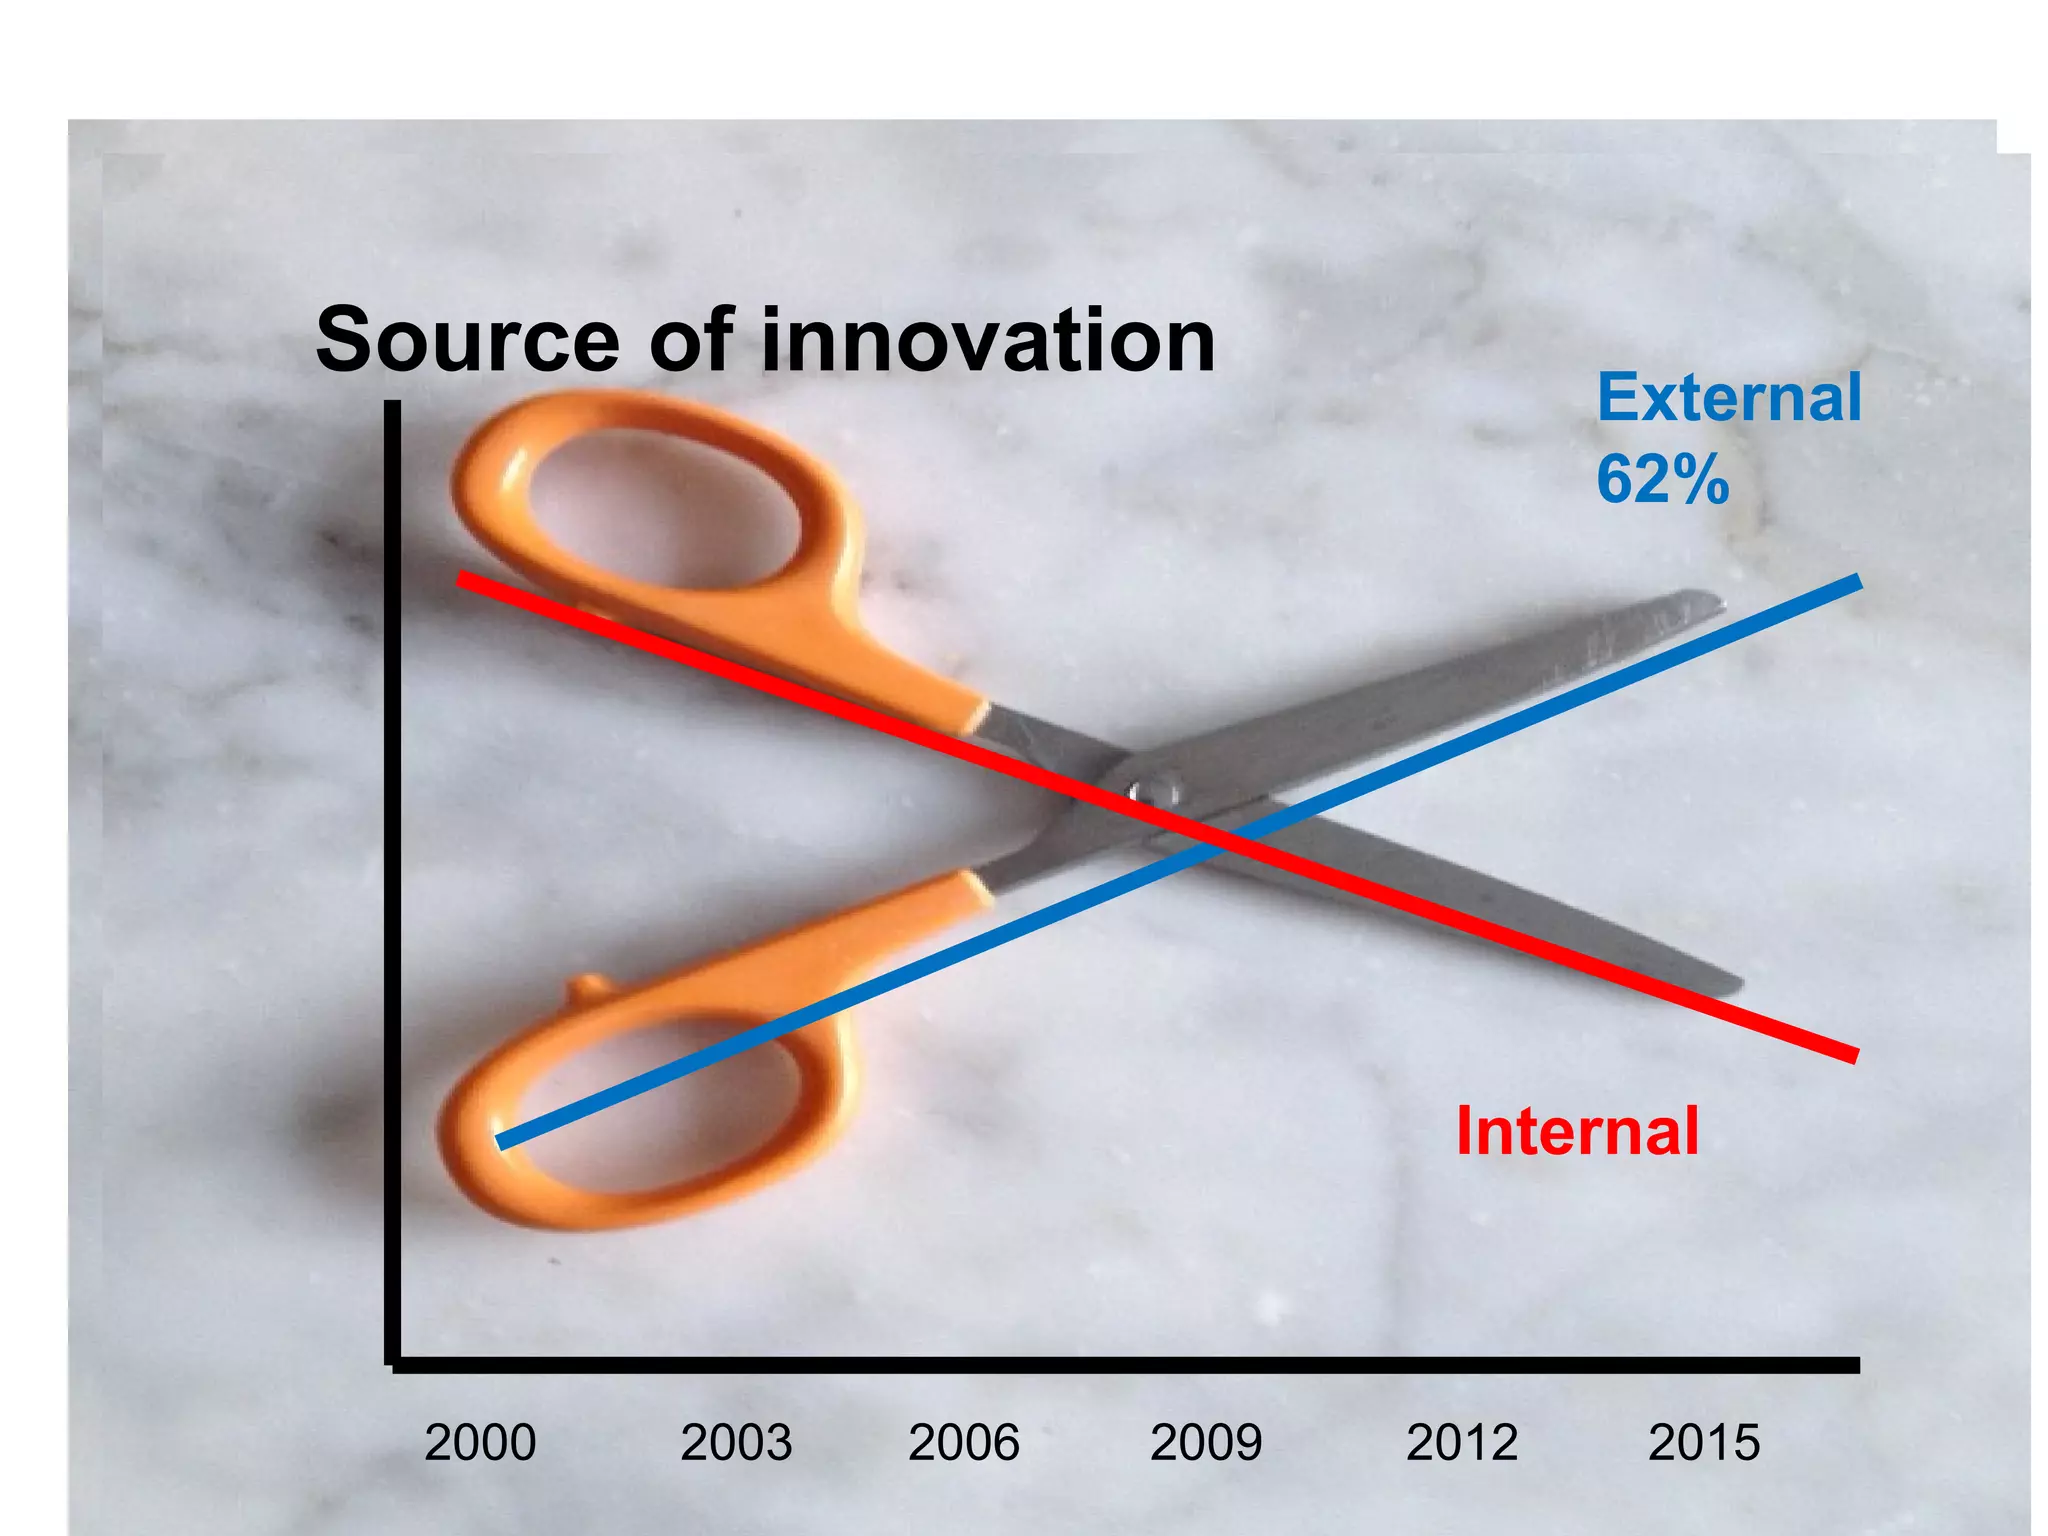
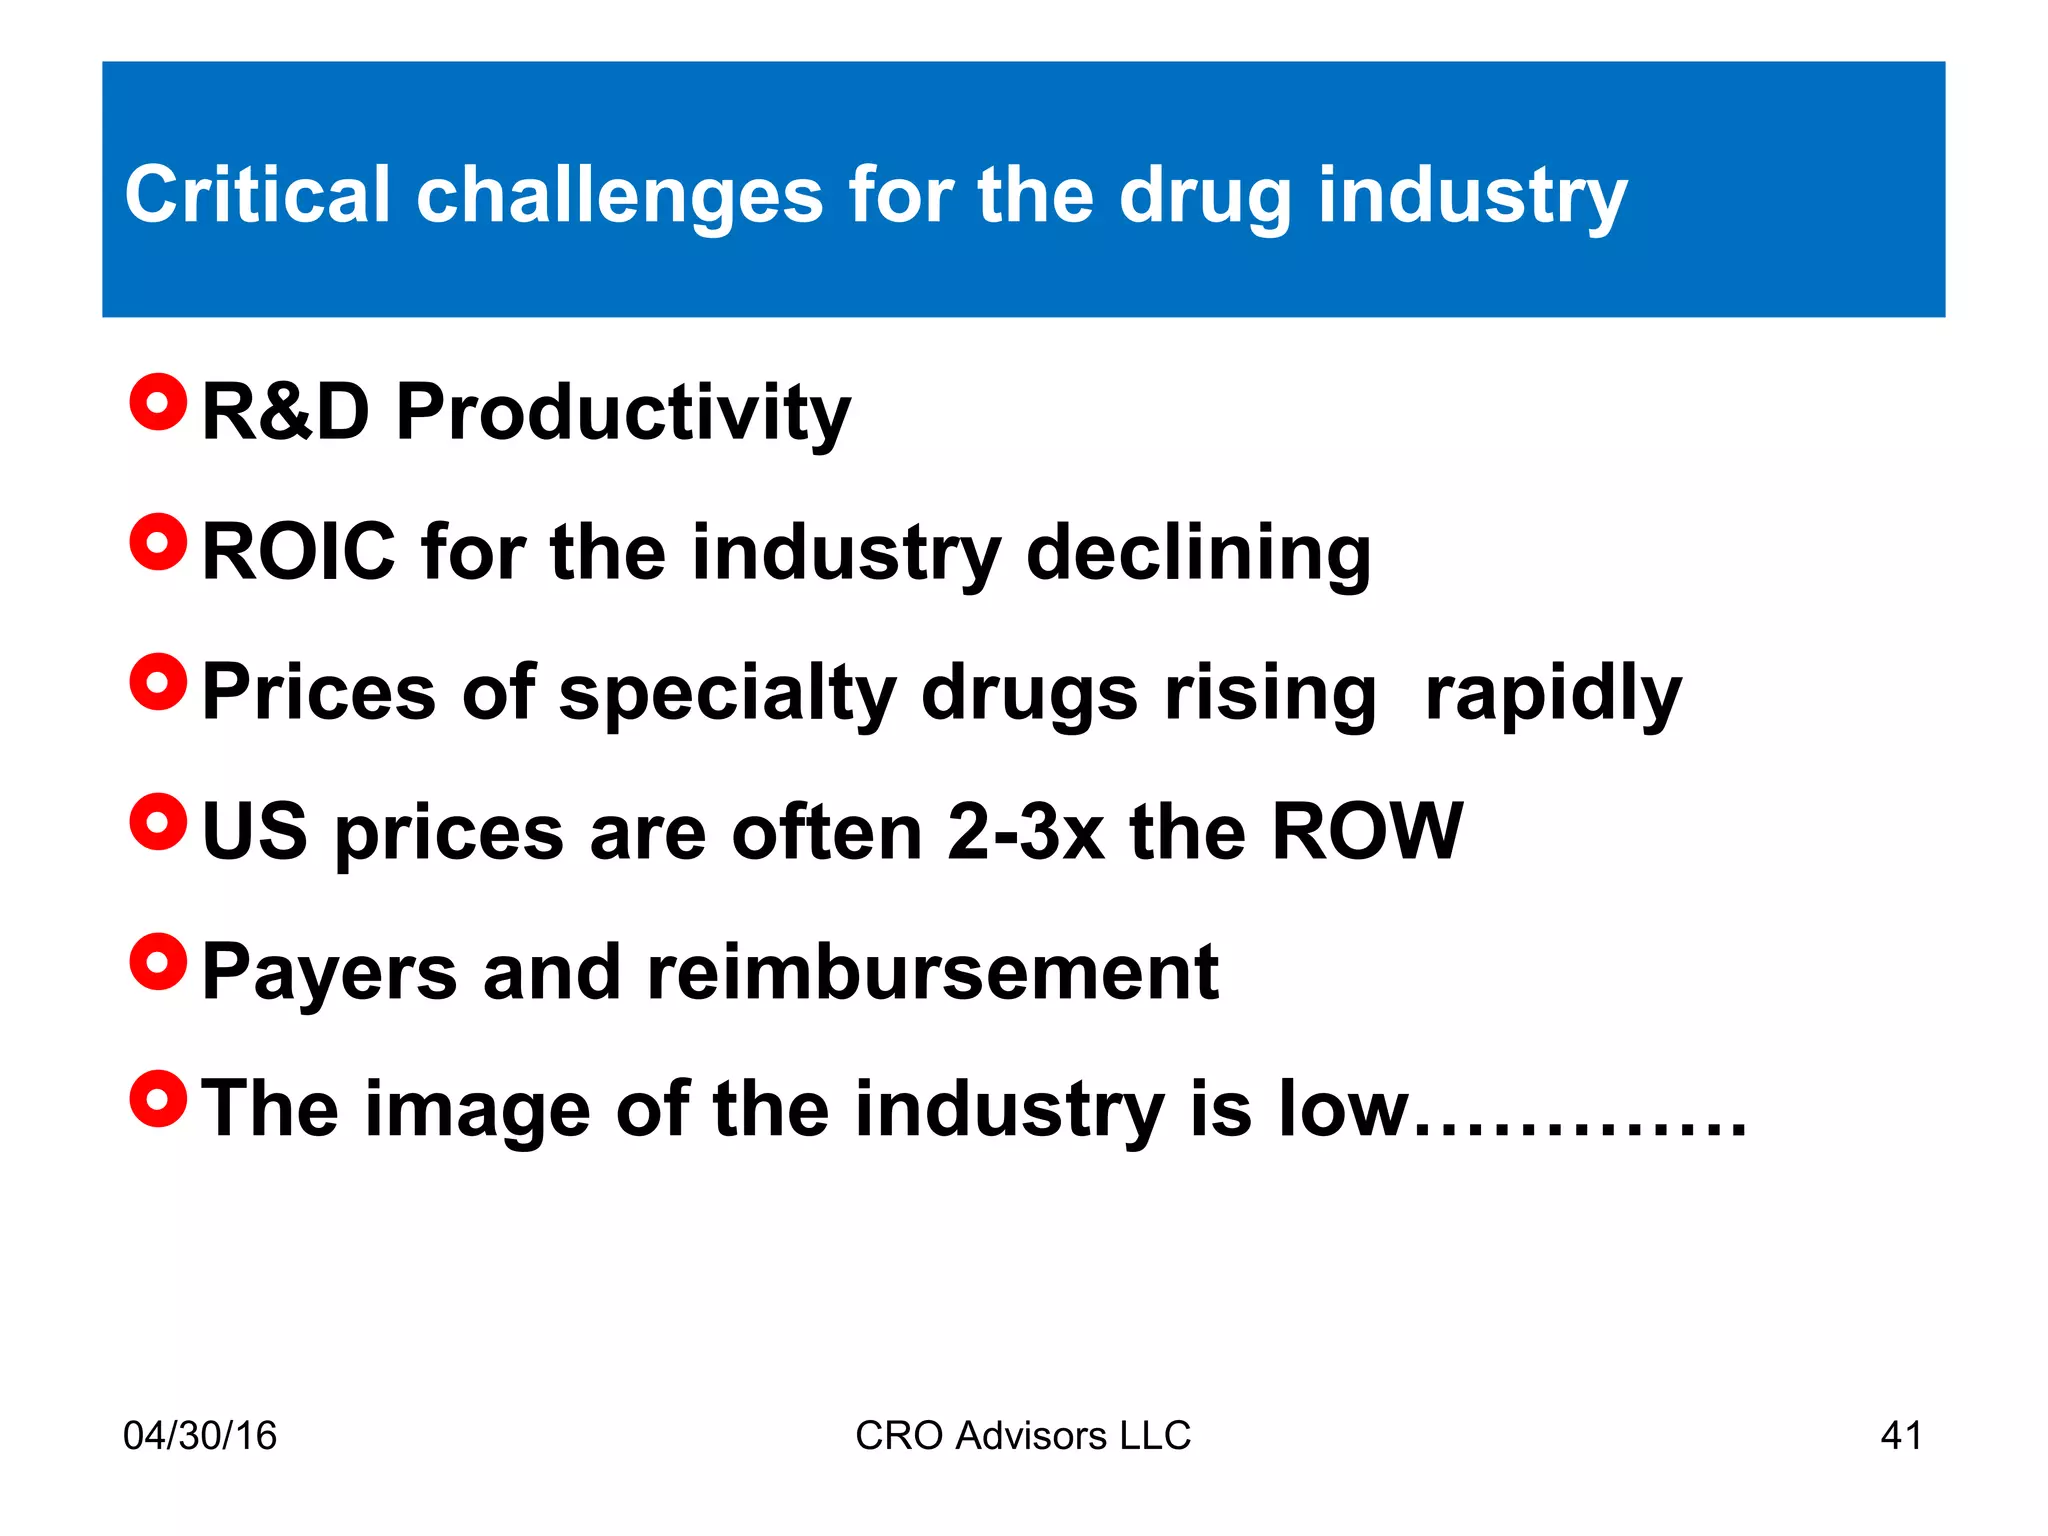
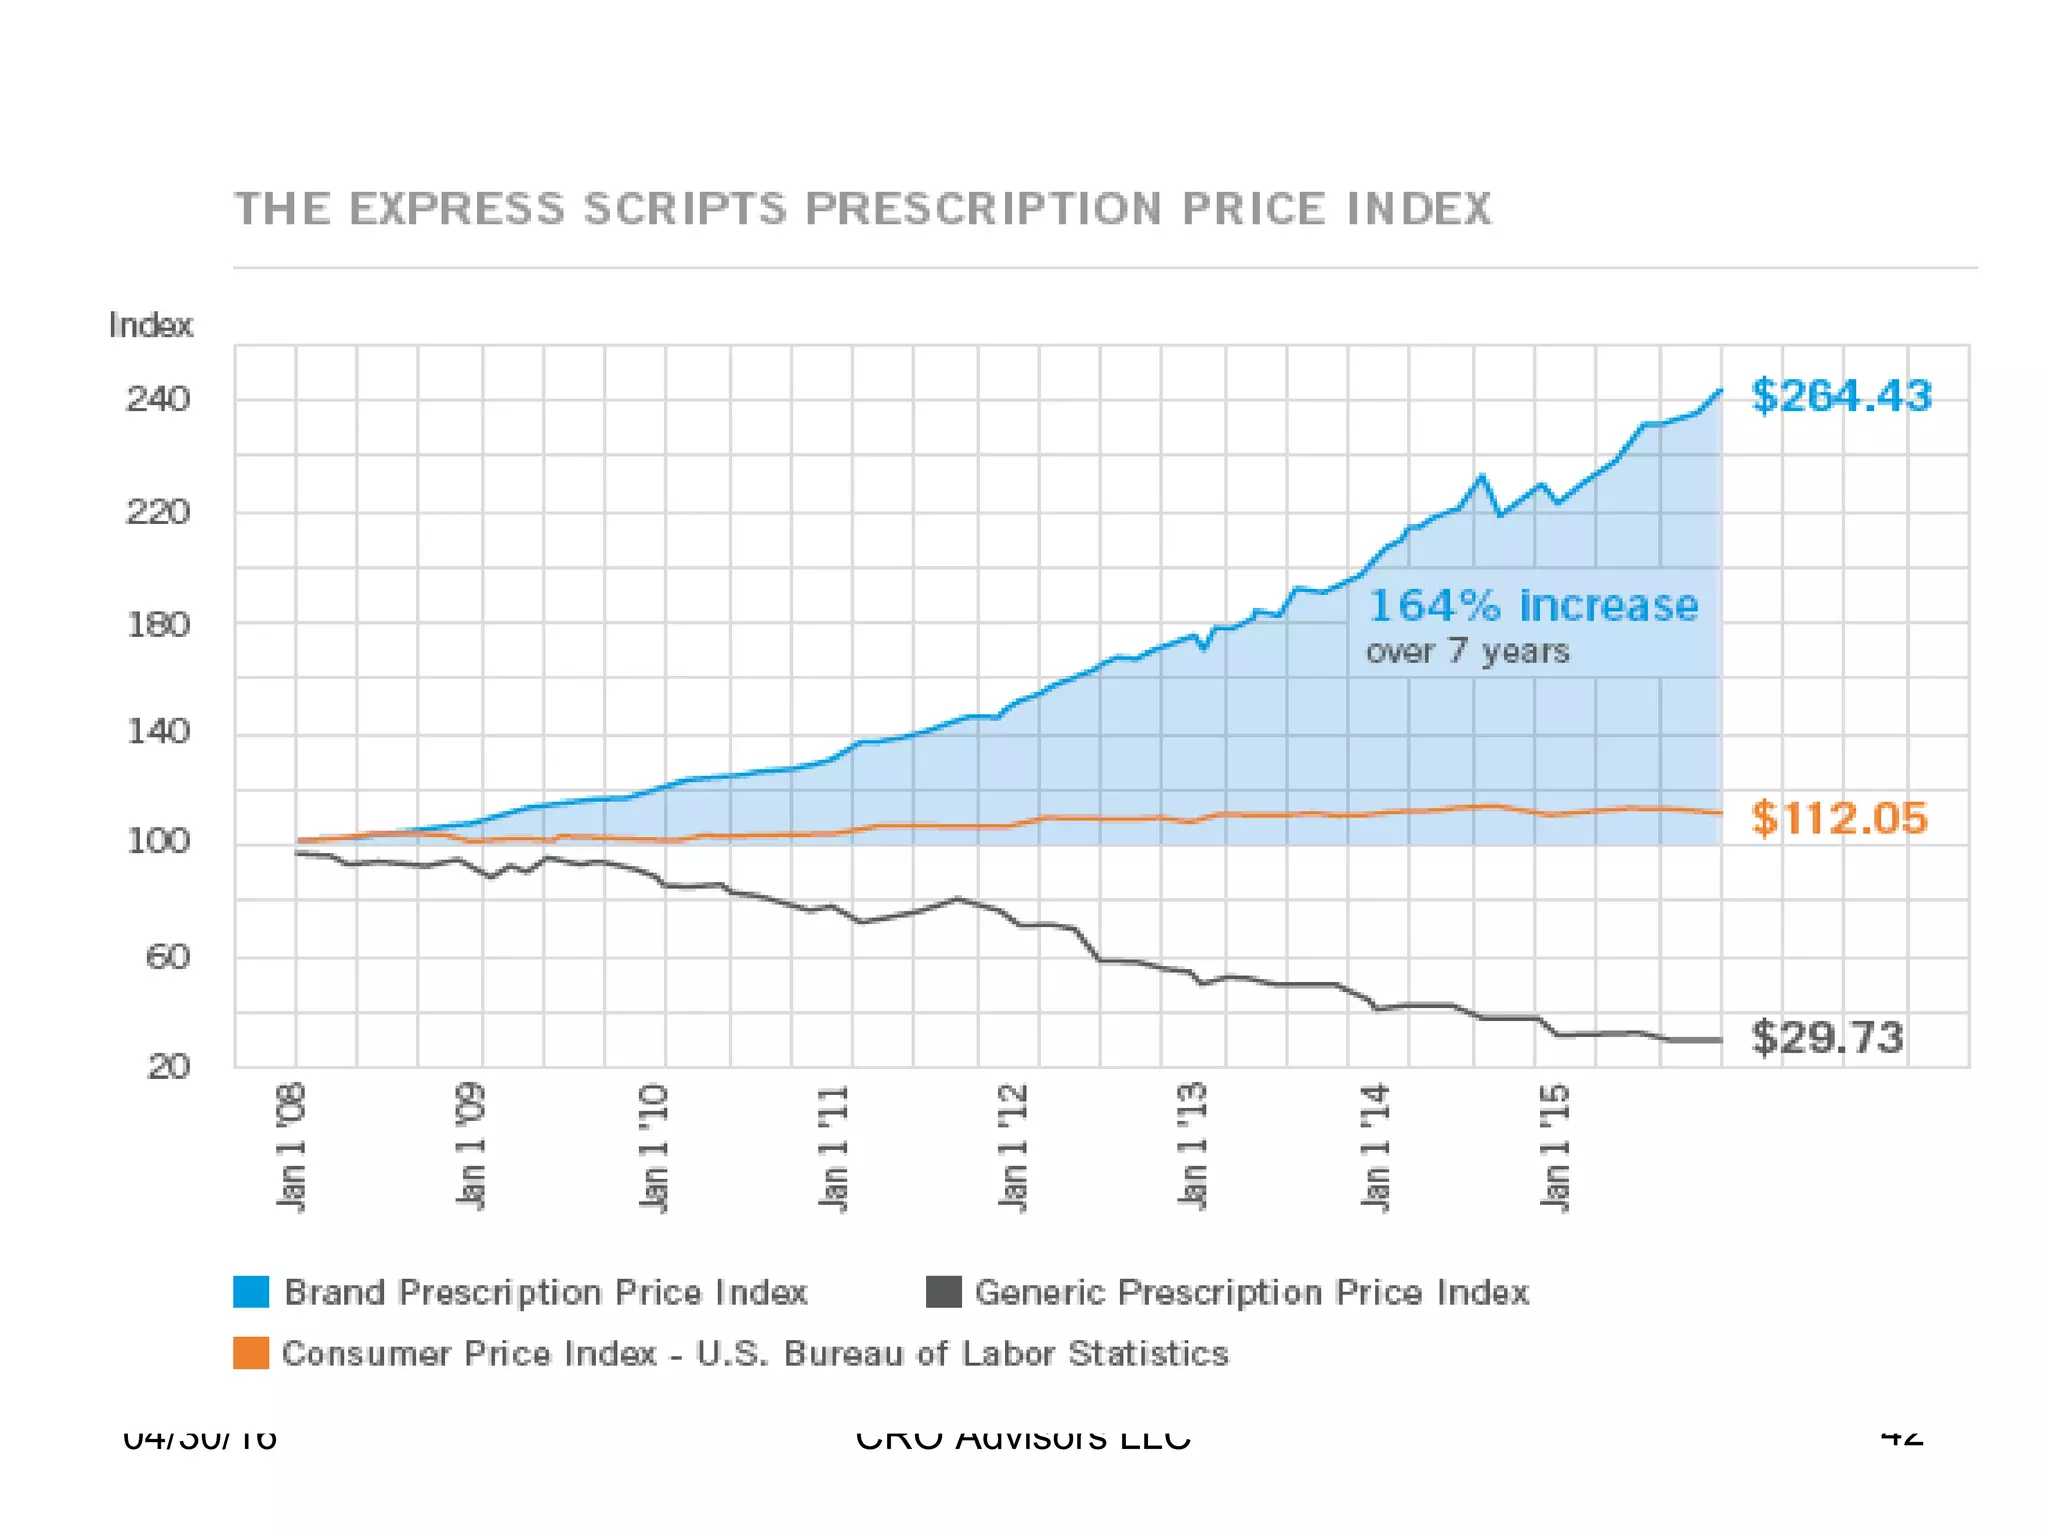
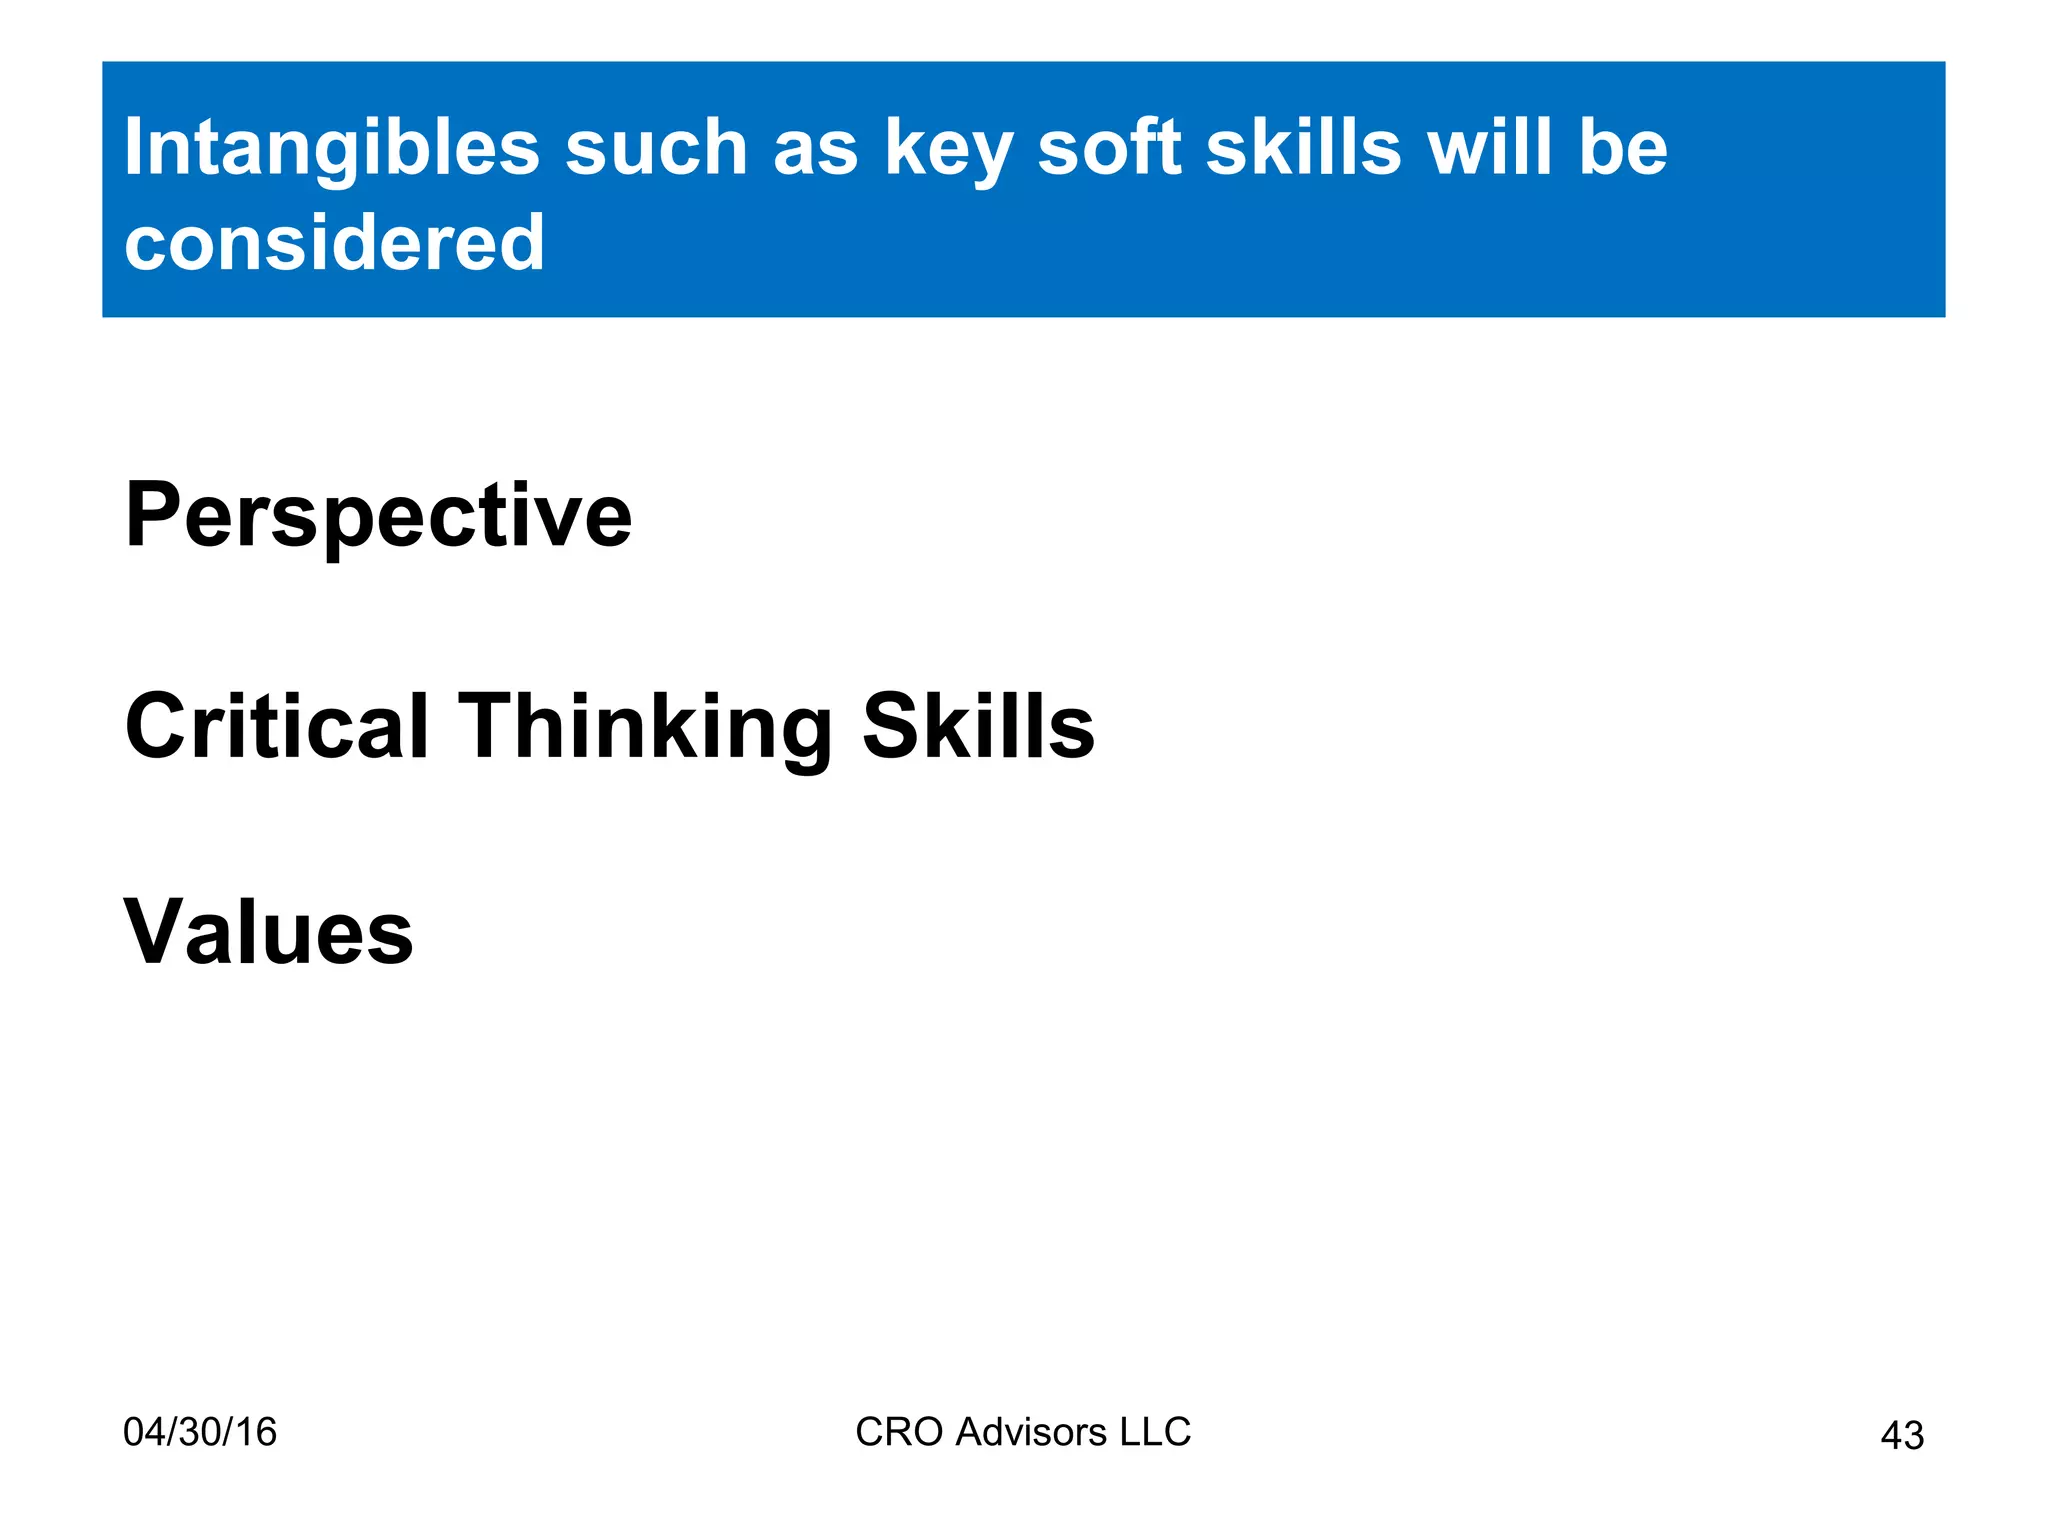
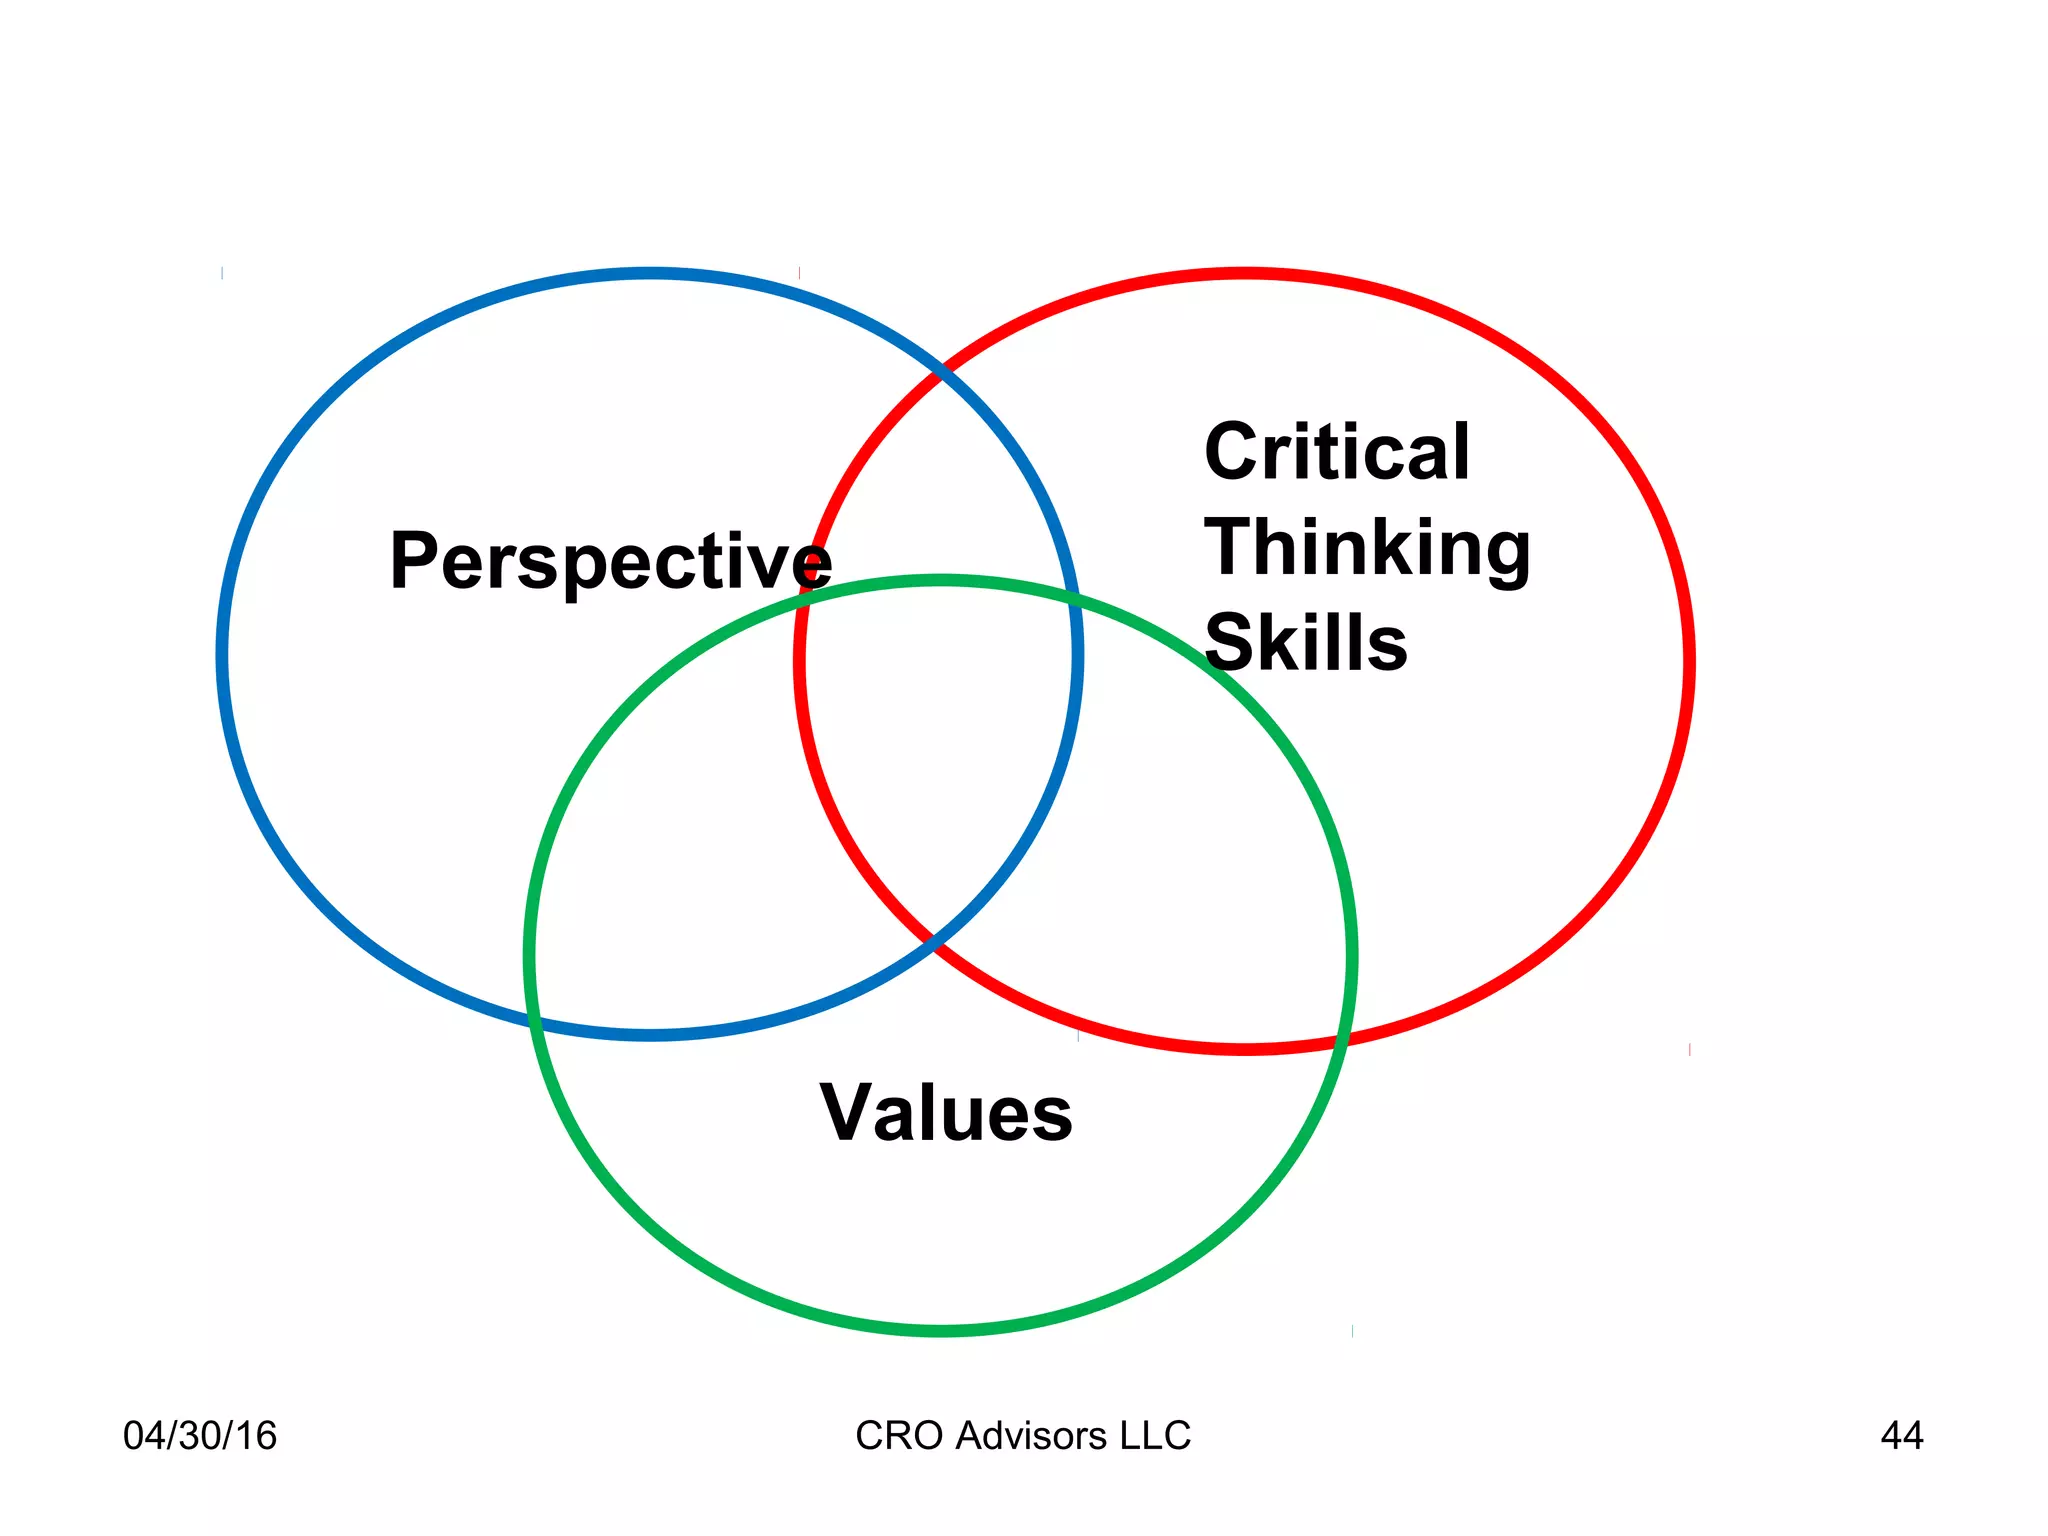
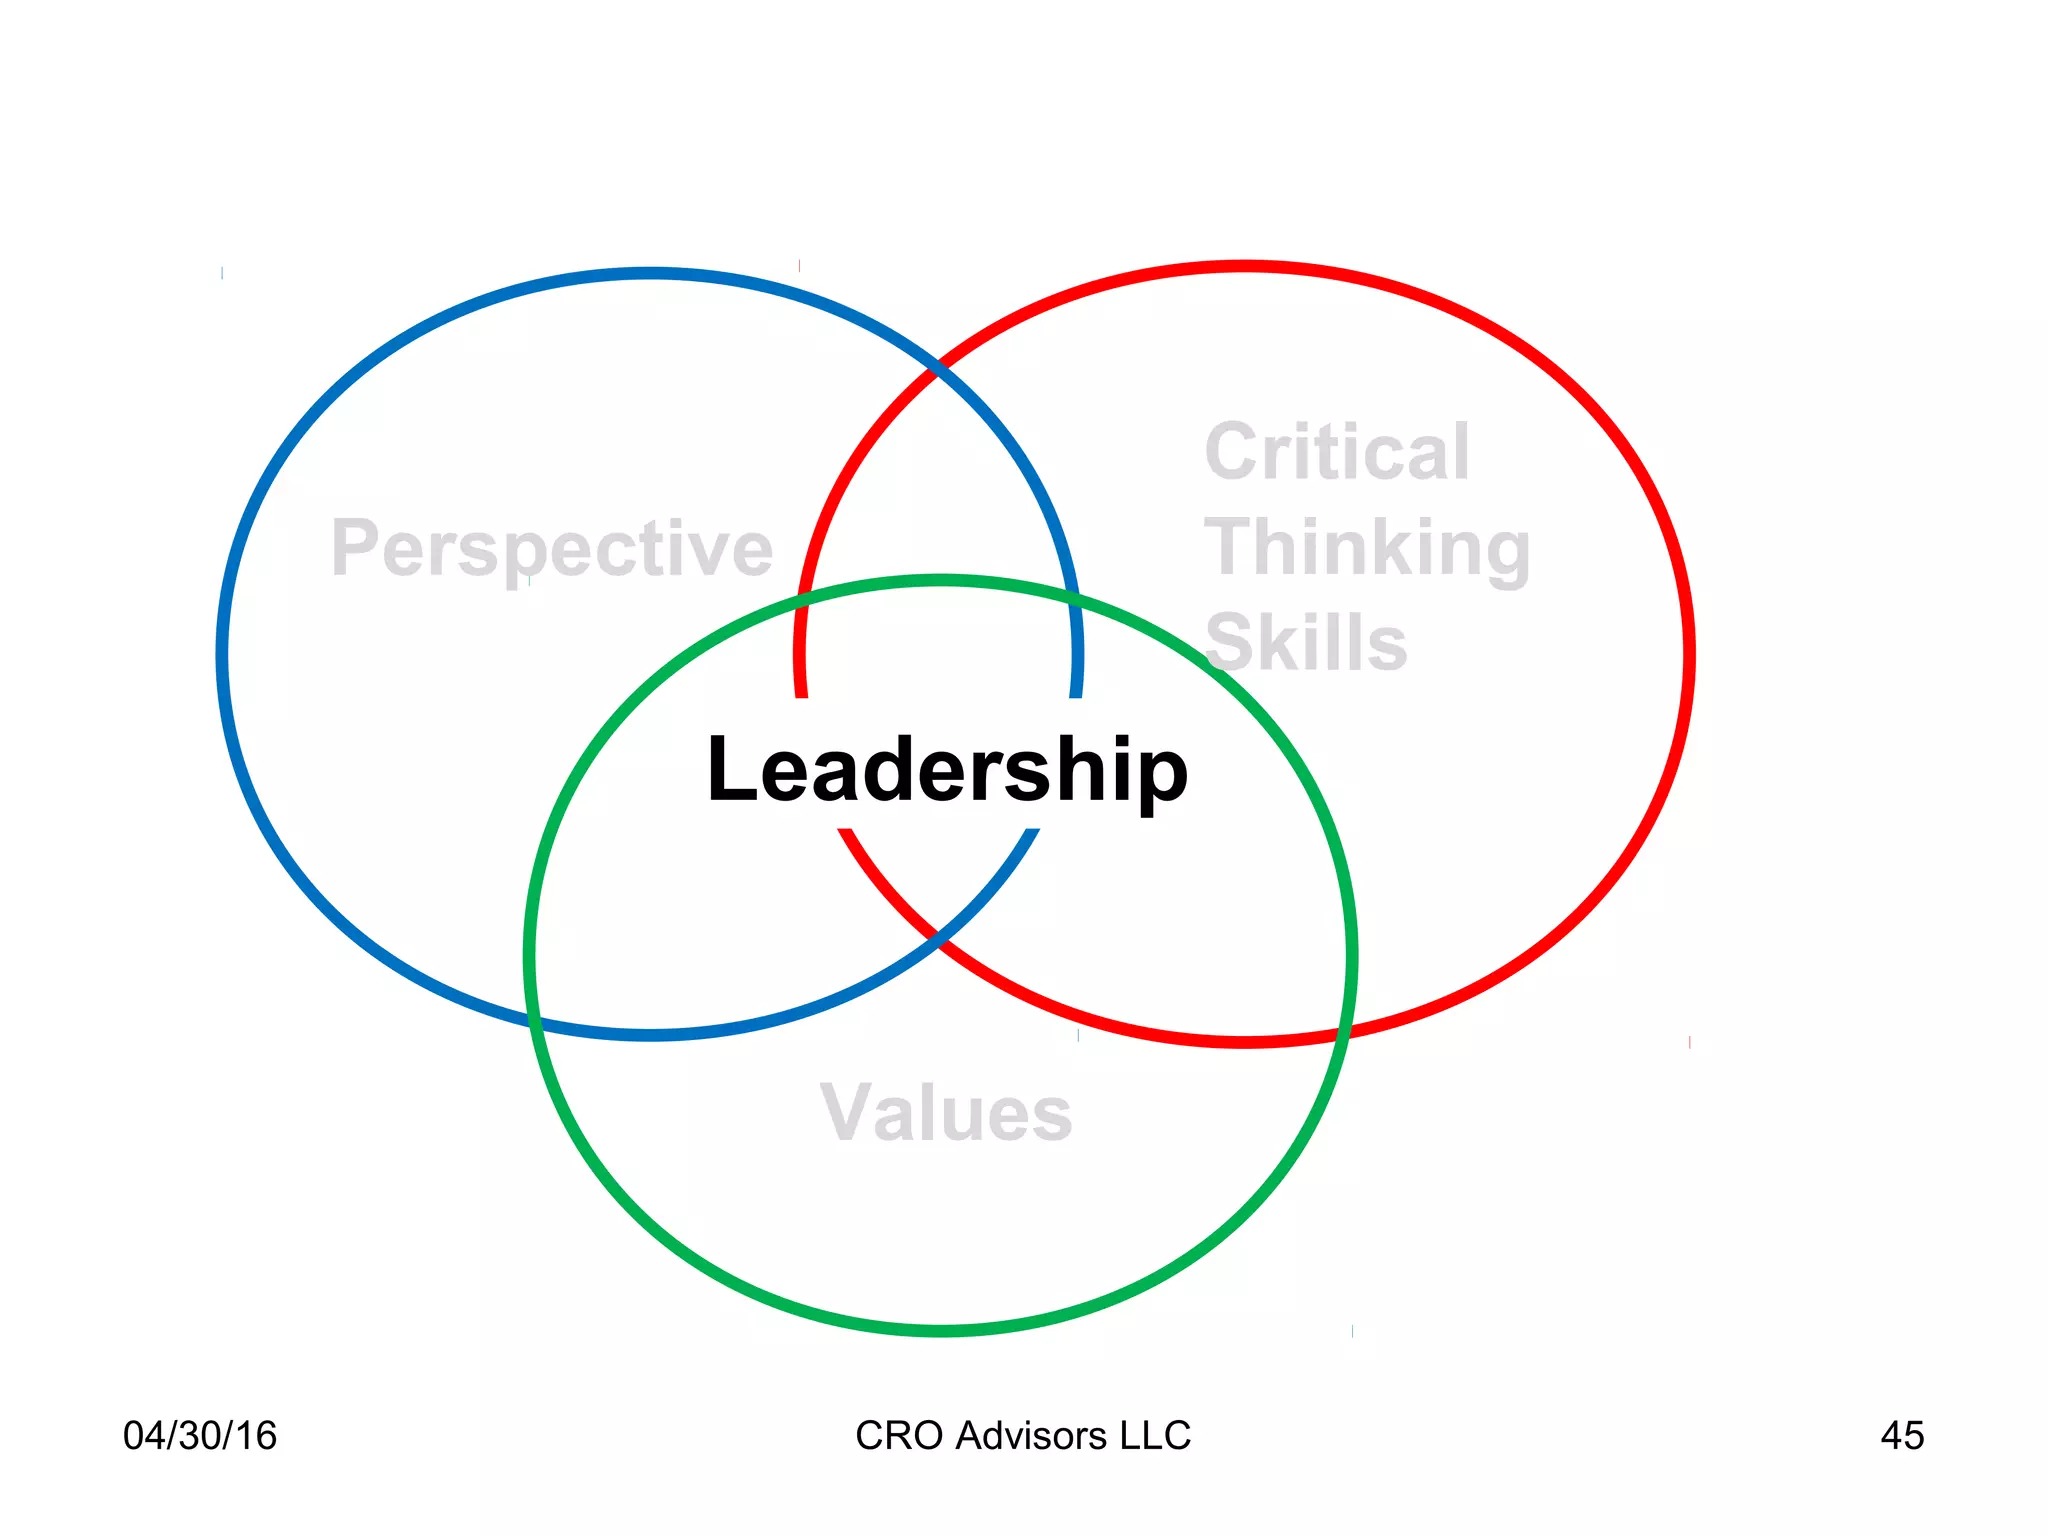
Overview of Drug Development:
Discovery to Post-Approval
Georgetown University Medical Center
BCHB 566
April 1, 2016
Stephen J. Sullivan
CRO Advisors LLC
04/30/16 CRO Advisors LLC 2
Course Objectives
 Understand the complete process to help you: make good
career choices, know how to contribute, relate to co-workers in
adjacent functions, maximize your contribution to the firm
 Develop the perspective needed to serve the drug industry as a
service provider, financier, consultant or board member
 Develop the insight required to help improve the process
 Understand the terms, nomenclature, and demarcation lines for
this complex process
 Develop a working knowledge of current issues in drug dev
 Help you become an informed investor
Course Outline
 Section 1- Overview and key issues, Today
 Section 2- Drug Discovery. Today
 Section 3- Pre-clinical, Safety, Mfg.- Sat. 4/2
 Section 4- Clinical Development- Sat. 4/2
 Section 5- The Regulatory Process- Fri. 4/8
 Section 6- Commercialization, Post-approval- Fri. 4/8
 Section 7- What lies ahead? –Sat. 4/9
04/30/16 CRO Advisors LLC 3
04/30/16 CRO Advisors LLC 4
Course Requirements
Participation – requires being here – 15%
Case assignment – 35%
Final Exam: 50%
We are in good company!
04/30/16 CRO Advisors LLC 5
Developed by Eli Lilly & Co.
Available 4/2016
Developed by Terrapin offered 9/2015
Why this course?
10,000’ deep, 2’ wide
Perspective
Need for fresh eyes
Massive industry
Infinite choices
Lots of issues
04/30/16 CRO Advisors LLC 6
What is a biotechnology company?
04/30/16 CRO Advisors LLC 7
Traditional
Biotech
Evolving
Biotech
Medium &
Large Pharma
Amgen
Genentech
Large Molecules
Small Biopharma
SM and LM
Combinations
Top 50
Pharma
R&D spending growth
8
04/30/16
YOY
% 
15
10
5
0
Total Pharma
2.5%
Top 10 Biotech
15%
Small-Medium
Pharma / Biotech
9%
2009 2010 2011 2012 2013 2014 2015
9
04/30/16 CRO Advisors LLC 10
My perspective………….
 Founder of CRO Advisors LLC, consulting firm to outsourced
pharma service providers across the DD continuum
 CEO of a large private equity owned CRO
 CEO of a NASDAQ early gene expression company
 CCO of a NASDAQ generic pharma
 Group President NYSE company (several divisions)
 VP / GM of a billion dollar unit of a Fortune 50
 20 years as Adjunct in top MBA program (Kellogg)
 US Marine Officer
04/30/16 CRO Advisors LLC 11
CRO Advisors LLC perspective
Discovery Pre-Clinical Phase I Phase II Phase III Phase IV
Clinical
Support
Services
Logistics / Packaging / Related
2 Boards 2 Boards
1 Board
Clients:
45% Private equity
45% Pharma Services
10% other investors
50 M&A projects
5 M&A projects
3 M&A projects
Negotiating with
Powerful Buyers
Workshops
6 M&A projects
04/30/16 CRO Advisors LLC 12
“All generalizations are false,
including this one.”
Mark Twain
04/30/16 CRO Advisors LLC 13
All generalizations are false……
R & D spending growth 0% or 15%
Revenue growth 0% or 15%
Therapeutic areas (5)% or 17%
Drugs in development 1% or 8%
Employees (1)% or 13%
04/30/16 CRO Advisors LLC 14
04/30/16 CRO Advisors LLC 15
Source: Pharmaceutical Industry Profile 2008 (PhRMA, March 2008, p.4)
$31 billion 12 billion $71 billion $26 billion
$141 Billion
Year 0 5 7 9 11 13
04/30/16 CRO Advisors LLC 16
04/30/16 CRO Advisors LLC 17
18
04/30/16
BioPharma Income Statement
19
Revenue 100
Cost of Goods 15
Gross Profit 85
Operating Expenses:
R&D 20
S&M 30
G&A 5
Operating Income 30
Revenue 100
Cost of Goods
Gross Profit 99
Operating Expenses:
R&D &D 27
S&M
34
G&A
Operating Income 39
Revenue 5
Cost of Goods 1
Gross Profit 4
Operating Expenses:
R&D 160
S&M 15
G&A
Operating Income (141)
Top 10 Pharma Commercial Biotech Development Biotech
04/30/16 CRO Advisors LLC 20
04/30/16 CRO Advisors LLC 21
Pharma / Biotech in context
Healthcare approaching 20% of GDP in the US
Drugs are about 10% of healthcare
88% of prescriptions are generic drugs— 28% of
revenue
Ethical / specialty drugs continue to be the lion’s
share of the market
BioPharma Research is 20% of US industry research
04/30/16 CRO Advisors LLC 22
Critical challenges for the drug industry
R&D Productivity
ROIC for the industry declining
Prices of specialty drugs rising rapidly
US prices are often 2-3x the ROW
Payers and reimbursement
The image of the industry is low………….
04/30/16 CRO Advisors LLC 23
40 years of prosperity
1970 1975 1980 1985 1990 1995 2000 2005 2010 2012 2013
800
700
600
500
400
300
200
1982-83
DRGs
1994- Clintons
attempt to
nationalize HC
Revenue Billions
R & D
Spending
150
120
100
70
50
04/30/16 CRO Advisors LLC 24
Drug Classifications
 Traditional or “ethical” drugs chemically derived
otherwise called Small Molecule drugs
 Biologics from living organisms (often called Large
Molecules)
 Generics
 Specialty Drugs
 Orphan Drugs
 Biosimilars
R&D Productivity: Is it really improving?
The case for:
 FDA approvals
 # of blockbusters
 Targeted therapies
 Robust biotech market
 Huge profits
The case against:
Cost per new $2.6 BN
62% of Big pharma
launches from
elsewhere
Corporate Integrity
Agreements (CIAs)
Inexplicably high prices
04/30/16 CRO Advisors LLC 25
04/30/16 CRO Advisors LLC 26
Source: Pharmaceutical Industry Profile 2008 (PhRMA, March 2008, p.4)
$31 billion 12 billion $71 billion $26 billion
$141 Billion
Year 0 5 7 9 11 13
Industry Benchmarks - 2015
Average Benchmarks R&D cost allocation R&D Cycle times
Discovery to 1st
tox dose 26% 34%
Preclincal to Phase II 29% 39%
Phase III and submission 46% 27%
04/30/16 CRO Advisors LLC 27
Source: Deloitte LLP and Global Data proprietary data, Measuring the Return from Pharmaceutical
Innovation 2015. p. 28.
04/30/16 CRO Advisors LLC 28
04/30/16 CRO Advisors LLC 29
Eroom’s Law*
*Nature Reviews Drug Discovery, “Diagnosing the decline in pharmaceutical R&D efficiency” pp191-200, March 2012
The number
of new drugs
approved per
billion of R&D
spending has
halved every
9 years since
1950.
04/30/16 CRO Advisors LLC 31
Quantifying the damage:
Oliver Wyman*
The Age of
Abundance
$275M
The Age of
Scarcity
$75M
*Source: “Beyond the Shadow of a Drought: The need for a new mindset in Pharma R&D,
Oliver Wyman Point of View, November,2011
04/30/16 Confidential CRO Advisors LLC 32
Era of abundance----Era of scarcity-----Era of superabund.
35
43
35
2011 2012 2013 2014 2015
50
DEMOCRATS REPUBLICANS DEMOCRATS
57
Clinton Bush Obama
40 per yr. 23 per yr. 42 per yr.
04/30/16 CRO Advisors LLC 33
04/30/16 CRO Advisors LLC 34
Non--Responders Common and Costly
Source: George Poste
GAvastin Rituxan Herceptin Revlimid Gleevec
Taxotere Alimta Gemzar Tarceva Femara
Erbitux Velcade Xeloda Arimidex Leuplin
R
$3.059B $2.466B $1.526B $1.373B $1.285B
$1.042B $975M $723M $661M $650M
$646M $598M $508M $393M $483M
Responder
Non-responder
Sources: Individual drug labels, FDA
Market and Product Forecast, Top 20 Oncology Therapy Brands, DataMonitor 2011
Personalized Medicine Improving Efficacy in
Oncology and other TAs
ALK gene
Cells expressing CD 304
BRAF Mutation 5%
HER-2 HER-2
37
Trend
Time
38
Jobs Created
2000 2003 2006 2009 2012 2015
Biotech
CROs, CMO
Big Pharma
39
Productivity
2000 2003 2006 2009 2012 2015
Cost per
New Drug
10 year IRR
40
Source of innovation
2000 2003 2006 2009 2012 2015
External
62%
Internal
04/30/16 CRO Advisors LLC 41
Critical challenges for the drug industry
R&D Productivity
ROIC for the industry declining
Prices of specialty drugs rising rapidly
US prices are often 2-3x the ROW
Payers and reimbursement
The image of the industry is low………….
04/30/16 CRO Advisors LLC 42
04/30/16 CRO Advisors LLC 43
Intangibles such as key soft skills will be
considered
Perspective
Critical Thinking Skills
Values
04/30/16 CRO Advisors LLC 44
Perspective
Critical
Thinking
Skills
Values
04/30/16 CRO Advisors LLC 45
Perspective
Critical
Thinking
Skills
Values
Leadership

Bchb 566 class1 overview 040116

  • 1.
    Overview of DrugDevelopment: Discovery to Post-Approval Georgetown University Medical Center BCHB 566 April 1, 2016 Stephen J. Sullivan CRO Advisors LLC
  • 2.
    04/30/16 CRO AdvisorsLLC 2 Course Objectives  Understand the complete process to help you: make good career choices, know how to contribute, relate to co-workers in adjacent functions, maximize your contribution to the firm  Develop the perspective needed to serve the drug industry as a service provider, financier, consultant or board member  Develop the insight required to help improve the process  Understand the terms, nomenclature, and demarcation lines for this complex process  Develop a working knowledge of current issues in drug dev  Help you become an informed investor
  • 3.
    Course Outline  Section1- Overview and key issues, Today  Section 2- Drug Discovery. Today  Section 3- Pre-clinical, Safety, Mfg.- Sat. 4/2  Section 4- Clinical Development- Sat. 4/2  Section 5- The Regulatory Process- Fri. 4/8  Section 6- Commercialization, Post-approval- Fri. 4/8  Section 7- What lies ahead? –Sat. 4/9 04/30/16 CRO Advisors LLC 3
  • 4.
    04/30/16 CRO AdvisorsLLC 4 Course Requirements Participation – requires being here – 15% Case assignment – 35% Final Exam: 50%
  • 5.
    We are ingood company! 04/30/16 CRO Advisors LLC 5 Developed by Eli Lilly & Co. Available 4/2016 Developed by Terrapin offered 9/2015
  • 6.
    Why this course? 10,000’deep, 2’ wide Perspective Need for fresh eyes Massive industry Infinite choices Lots of issues 04/30/16 CRO Advisors LLC 6
  • 7.
    What is abiotechnology company? 04/30/16 CRO Advisors LLC 7 Traditional Biotech Evolving Biotech Medium & Large Pharma Amgen Genentech Large Molecules Small Biopharma SM and LM Combinations Top 50 Pharma
  • 8.
    R&D spending growth 8 04/30/16 YOY % 15 10 5 0 Total Pharma 2.5% Top 10 Biotech 15% Small-Medium Pharma / Biotech 9% 2009 2010 2011 2012 2013 2014 2015
  • 9.
  • 10.
    04/30/16 CRO AdvisorsLLC 10 My perspective………….  Founder of CRO Advisors LLC, consulting firm to outsourced pharma service providers across the DD continuum  CEO of a large private equity owned CRO  CEO of a NASDAQ early gene expression company  CCO of a NASDAQ generic pharma  Group President NYSE company (several divisions)  VP / GM of a billion dollar unit of a Fortune 50  20 years as Adjunct in top MBA program (Kellogg)  US Marine Officer
  • 11.
    04/30/16 CRO AdvisorsLLC 11 CRO Advisors LLC perspective Discovery Pre-Clinical Phase I Phase II Phase III Phase IV Clinical Support Services Logistics / Packaging / Related 2 Boards 2 Boards 1 Board Clients: 45% Private equity 45% Pharma Services 10% other investors 50 M&A projects 5 M&A projects 3 M&A projects Negotiating with Powerful Buyers Workshops 6 M&A projects
  • 12.
    04/30/16 CRO AdvisorsLLC 12 “All generalizations are false, including this one.” Mark Twain
  • 13.
    04/30/16 CRO AdvisorsLLC 13 All generalizations are false…… R & D spending growth 0% or 15% Revenue growth 0% or 15% Therapeutic areas (5)% or 17% Drugs in development 1% or 8% Employees (1)% or 13%
  • 14.
  • 15.
    04/30/16 CRO AdvisorsLLC 15 Source: Pharmaceutical Industry Profile 2008 (PhRMA, March 2008, p.4) $31 billion 12 billion $71 billion $26 billion $141 Billion Year 0 5 7 9 11 13
  • 16.
  • 17.
  • 18.
  • 19.
    BioPharma Income Statement 19 Revenue100 Cost of Goods 15 Gross Profit 85 Operating Expenses: R&D 20 S&M 30 G&A 5 Operating Income 30 Revenue 100 Cost of Goods Gross Profit 99 Operating Expenses: R&D &D 27 S&M 34 G&A Operating Income 39 Revenue 5 Cost of Goods 1 Gross Profit 4 Operating Expenses: R&D 160 S&M 15 G&A Operating Income (141) Top 10 Pharma Commercial Biotech Development Biotech
  • 20.
  • 21.
    04/30/16 CRO AdvisorsLLC 21 Pharma / Biotech in context Healthcare approaching 20% of GDP in the US Drugs are about 10% of healthcare 88% of prescriptions are generic drugs— 28% of revenue Ethical / specialty drugs continue to be the lion’s share of the market BioPharma Research is 20% of US industry research
  • 22.
    04/30/16 CRO AdvisorsLLC 22 Critical challenges for the drug industry R&D Productivity ROIC for the industry declining Prices of specialty drugs rising rapidly US prices are often 2-3x the ROW Payers and reimbursement The image of the industry is low………….
  • 23.
    04/30/16 CRO AdvisorsLLC 23 40 years of prosperity 1970 1975 1980 1985 1990 1995 2000 2005 2010 2012 2013 800 700 600 500 400 300 200 1982-83 DRGs 1994- Clintons attempt to nationalize HC Revenue Billions R & D Spending 150 120 100 70 50
  • 24.
    04/30/16 CRO AdvisorsLLC 24 Drug Classifications  Traditional or “ethical” drugs chemically derived otherwise called Small Molecule drugs  Biologics from living organisms (often called Large Molecules)  Generics  Specialty Drugs  Orphan Drugs  Biosimilars
  • 25.
    R&D Productivity: Isit really improving? The case for:  FDA approvals  # of blockbusters  Targeted therapies  Robust biotech market  Huge profits The case against: Cost per new $2.6 BN 62% of Big pharma launches from elsewhere Corporate Integrity Agreements (CIAs) Inexplicably high prices 04/30/16 CRO Advisors LLC 25
  • 26.
    04/30/16 CRO AdvisorsLLC 26 Source: Pharmaceutical Industry Profile 2008 (PhRMA, March 2008, p.4) $31 billion 12 billion $71 billion $26 billion $141 Billion Year 0 5 7 9 11 13
  • 27.
    Industry Benchmarks -2015 Average Benchmarks R&D cost allocation R&D Cycle times Discovery to 1st tox dose 26% 34% Preclincal to Phase II 29% 39% Phase III and submission 46% 27% 04/30/16 CRO Advisors LLC 27 Source: Deloitte LLP and Global Data proprietary data, Measuring the Return from Pharmaceutical Innovation 2015. p. 28.
  • 28.
  • 29.
  • 30.
    Eroom’s Law* *Nature ReviewsDrug Discovery, “Diagnosing the decline in pharmaceutical R&D efficiency” pp191-200, March 2012 The number of new drugs approved per billion of R&D spending has halved every 9 years since 1950.
  • 31.
    04/30/16 CRO AdvisorsLLC 31 Quantifying the damage: Oliver Wyman* The Age of Abundance $275M The Age of Scarcity $75M *Source: “Beyond the Shadow of a Drought: The need for a new mindset in Pharma R&D, Oliver Wyman Point of View, November,2011
  • 32.
    04/30/16 Confidential CROAdvisors LLC 32 Era of abundance----Era of scarcity-----Era of superabund. 35 43 35 2011 2012 2013 2014 2015 50 DEMOCRATS REPUBLICANS DEMOCRATS 57 Clinton Bush Obama 40 per yr. 23 per yr. 42 per yr.
  • 33.
  • 34.
  • 35.
    Non--Responders Common andCostly Source: George Poste GAvastin Rituxan Herceptin Revlimid Gleevec Taxotere Alimta Gemzar Tarceva Femara Erbitux Velcade Xeloda Arimidex Leuplin R $3.059B $2.466B $1.526B $1.373B $1.285B $1.042B $975M $723M $661M $650M $646M $598M $508M $393M $483M Responder Non-responder Sources: Individual drug labels, FDA Market and Product Forecast, Top 20 Oncology Therapy Brands, DataMonitor 2011
  • 36.
    Personalized Medicine ImprovingEfficacy in Oncology and other TAs ALK gene Cells expressing CD 304 BRAF Mutation 5% HER-2 HER-2
  • 37.
  • 38.
    38 Jobs Created 2000 20032006 2009 2012 2015 Biotech CROs, CMO Big Pharma
  • 39.
    39 Productivity 2000 2003 20062009 2012 2015 Cost per New Drug 10 year IRR
  • 40.
    40 Source of innovation 20002003 2006 2009 2012 2015 External 62% Internal
  • 41.
    04/30/16 CRO AdvisorsLLC 41 Critical challenges for the drug industry R&D Productivity ROIC for the industry declining Prices of specialty drugs rising rapidly US prices are often 2-3x the ROW Payers and reimbursement The image of the industry is low………….
  • 42.
  • 43.
    04/30/16 CRO AdvisorsLLC 43 Intangibles such as key soft skills will be considered Perspective Critical Thinking Skills Values
  • 44.
    04/30/16 CRO AdvisorsLLC 44 Perspective Critical Thinking Skills Values
  • 45.
    04/30/16 CRO AdvisorsLLC 45 Perspective Critical Thinking Skills Values Leadership