SlideShare a Scribd company logo
1 of 6
FACTORY PERFECT ATTENDANCE
Percentage of Factory Employees With Perfect Attendance
              160

                    140
              140


              120


              100                                                           92
    Percent


               80


               60
                                                                                 49

               40


               20
                          7
                              5%                                                  53%
                0
                     Row 2         Row 3   Row 4    Row 5   Row 6   Row 7   Row 8
                                                   Year
Accidents
                      140


                            120
                      120


                      100
Number of Accidents


                       80


                       60


                       40


                       20

                                                2
                        0
                            1992               2009
                                       Year
Work Comp Lost Work Days
                 600
                       562


                 500


                 400
Number of Days


                 300


                 200


                 100


                   0
                       1992                              2009
                                         Year
Factory - Total Days Absent
                            2500

                                   2213


                            2000
        Total Days Absent


                            1500


                            1000


                             500


                                                                             123

                               0
                                   1992                                      2009
                                                                    Year


Note: 34% decrease in employment but a 94% decrease in totals days absent.
                                                                       .
Year          Percent     Year          Days
       1992          5%          1992          2213


       2009        53%           2009          123
Accidents                                    Work Comp

     1992                        120               1992   562


     2009                          2               2009     0


                                        Accidents                                             Work Comp Lost Work Days
                           140                                                          600   562
                                 120
                           120                                                          500
     Number of Accidents


                           100


                                                                       Number of Days
                                                                                        400
                           80
                                                                                        300
                           60
                                                                                        200
                           40

                           20                                                           100
                                                                 2
                            0                                                            0
                                 1992                           2009                          1992                       2009
                                            Year                                                         Year

More Related Content

Similar to Hr Achievement Gaphs Thru 2009 Rev

slide
slideslide
slidekoh-t
 
[Study] google+ brand adoption and engagement trends 2
[Study] google+ brand adoption and engagement trends 2[Study] google+ brand adoption and engagement trends 2
[Study] google+ brand adoption and engagement trends 2Digitaluxe
 
Deutsche EuroShop | Company Presentation | 01/12
Deutsche EuroShop | Company Presentation | 01/12Deutsche EuroShop | Company Presentation | 01/12
Deutsche EuroShop | Company Presentation | 01/12Deutsche EuroShop AG
 
UCB pharma
UCB pharmaUCB pharma
UCB pharmaJorgarys
 
Deutsche EuroShop | Company Presentation | 12/11
Deutsche EuroShop | Company Presentation | 12/11Deutsche EuroShop | Company Presentation | 12/11
Deutsche EuroShop | Company Presentation | 12/11Deutsche EuroShop AG
 
Deutsche EuroShop | Annual Earnings Conference Call | FY 2010 Results
Deutsche EuroShop | Annual Earnings Conference Call | FY 2010 ResultsDeutsche EuroShop | Annual Earnings Conference Call | FY 2010 Results
Deutsche EuroShop | Annual Earnings Conference Call | FY 2010 ResultsDeutsche EuroShop AG
 
Jmart JMT Oppday Q355
Jmart JMT Oppday Q355 Jmart JMT Oppday Q355
Jmart JMT Oppday Q355 Shaen PD
 
Jmart : Opp day Dec 12, 2012
Jmart : Opp day  Dec 12, 2012Jmart : Opp day  Dec 12, 2012
Jmart : Opp day Dec 12, 2012TonHor Hor
 
Kevin richardson geography level 3 2011
Kevin richardson geography level 3 2011Kevin richardson geography level 3 2011
Kevin richardson geography level 3 201130088
 
Biscari safe 11 maggio 2012
Biscari safe   11 maggio 2012Biscari safe   11 maggio 2012
Biscari safe 11 maggio 2012canaleenergia
 
【東北大学】平成19年環境報告書
【東北大学】平成19年環境報告書【東北大学】平成19年環境報告書
【東北大学】平成19年環境報告書env63
 
Deutsche EuroShop | Bilanzpressekonferenz | Geschäftsjahr 2010
Deutsche EuroShop | Bilanzpressekonferenz | Geschäftsjahr 2010Deutsche EuroShop | Bilanzpressekonferenz | Geschäftsjahr 2010
Deutsche EuroShop | Bilanzpressekonferenz | Geschäftsjahr 2010Deutsche EuroShop AG
 
Financial analysis of Volvo
Financial analysis of VolvoFinancial analysis of Volvo
Financial analysis of VolvoSteffi DeVilder
 
Embraer projeção da demanda
Embraer   projeção da demandaEmbraer   projeção da demanda
Embraer projeção da demandaEmbraer RI
 
Embraer Market Forecast
Embraer Market ForecastEmbraer Market Forecast
Embraer Market ForecastEmbraer RI
 
Embraer projeção da demanda
Embraer   projeção da demandaEmbraer   projeção da demanda
Embraer projeção da demandaEmbraer RI
 
2001* Embraer ProjeçãO Da Demanda
2001*  Embraer   ProjeçãO Da Demanda2001*  Embraer   ProjeçãO Da Demanda
2001* Embraer ProjeçãO Da DemandaEmbraer RI
 

Similar to Hr Achievement Gaphs Thru 2009 Rev (20)

slide
slideslide
slide
 
Q3 Earning report of Daimler AG
Q3 Earning report of Daimler AGQ3 Earning report of Daimler AG
Q3 Earning report of Daimler AG
 
[Study] google+ brand adoption and engagement trends 2
[Study] google+ brand adoption and engagement trends 2[Study] google+ brand adoption and engagement trends 2
[Study] google+ brand adoption and engagement trends 2
 
Deutsche EuroShop | Company Presentation | 01/12
Deutsche EuroShop | Company Presentation | 01/12Deutsche EuroShop | Company Presentation | 01/12
Deutsche EuroShop | Company Presentation | 01/12
 
UCB pharma
UCB pharmaUCB pharma
UCB pharma
 
Deutsche EuroShop | Company Presentation | 12/11
Deutsche EuroShop | Company Presentation | 12/11Deutsche EuroShop | Company Presentation | 12/11
Deutsche EuroShop | Company Presentation | 12/11
 
Deutsche EuroShop | Annual Earnings Conference Call | FY 2010 Results
Deutsche EuroShop | Annual Earnings Conference Call | FY 2010 ResultsDeutsche EuroShop | Annual Earnings Conference Call | FY 2010 Results
Deutsche EuroShop | Annual Earnings Conference Call | FY 2010 Results
 
Jmart JMT Oppday Q355
Jmart JMT Oppday Q355 Jmart JMT Oppday Q355
Jmart JMT Oppday Q355
 
Jmart : Opp day Dec 12, 2012
Jmart : Opp day  Dec 12, 2012Jmart : Opp day  Dec 12, 2012
Jmart : Opp day Dec 12, 2012
 
Kevin richardson geography level 3 2011
Kevin richardson geography level 3 2011Kevin richardson geography level 3 2011
Kevin richardson geography level 3 2011
 
Biscari safe 11 maggio 2012
Biscari safe   11 maggio 2012Biscari safe   11 maggio 2012
Biscari safe 11 maggio 2012
 
Tinker global energy transition feb 2012
Tinker global energy transition feb 2012Tinker global energy transition feb 2012
Tinker global energy transition feb 2012
 
【東北大学】平成19年環境報告書
【東北大学】平成19年環境報告書【東北大学】平成19年環境報告書
【東北大学】平成19年環境報告書
 
Economy report
Economy reportEconomy report
Economy report
 
Deutsche EuroShop | Bilanzpressekonferenz | Geschäftsjahr 2010
Deutsche EuroShop | Bilanzpressekonferenz | Geschäftsjahr 2010Deutsche EuroShop | Bilanzpressekonferenz | Geschäftsjahr 2010
Deutsche EuroShop | Bilanzpressekonferenz | Geschäftsjahr 2010
 
Financial analysis of Volvo
Financial analysis of VolvoFinancial analysis of Volvo
Financial analysis of Volvo
 
Embraer projeção da demanda
Embraer   projeção da demandaEmbraer   projeção da demanda
Embraer projeção da demanda
 
Embraer Market Forecast
Embraer Market ForecastEmbraer Market Forecast
Embraer Market Forecast
 
Embraer projeção da demanda
Embraer   projeção da demandaEmbraer   projeção da demanda
Embraer projeção da demanda
 
2001* Embraer ProjeçãO Da Demanda
2001*  Embraer   ProjeçãO Da Demanda2001*  Embraer   ProjeçãO Da Demanda
2001* Embraer ProjeçãO Da Demanda
 

Hr Achievement Gaphs Thru 2009 Rev

  • 1. FACTORY PERFECT ATTENDANCE Percentage of Factory Employees With Perfect Attendance 160 140 140 120 100 92 Percent 80 60 49 40 20 7 5% 53% 0 Row 2 Row 3 Row 4 Row 5 Row 6 Row 7 Row 8 Year
  • 2. Accidents 140 120 120 100 Number of Accidents 80 60 40 20 2 0 1992 2009 Year
  • 3. Work Comp Lost Work Days 600 562 500 400 Number of Days 300 200 100 0 1992 2009 Year
  • 4. Factory - Total Days Absent 2500 2213 2000 Total Days Absent 1500 1000 500 123 0 1992 2009 Year Note: 34% decrease in employment but a 94% decrease in totals days absent. .
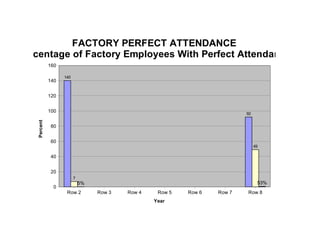
  • 5. Year Percent Year Days 1992 5% 1992 2213 2009 53% 2009 123
  • 6. Accidents Work Comp 1992 120 1992 562 2009 2 2009 0 Accidents Work Comp Lost Work Days 140 600 562 120 120 500 Number of Accidents 100 Number of Days 400 80 300 60 200 40 20 100 2 0 0 1992 2009 1992 2009 Year Year