
Recommended
Recommended
More Related Content
What's hot
What's hot (16)
Similar to Assessment of Groundwater Quality in Ilorin, North Central Nigeria
Similar to Assessment of Groundwater Quality in Ilorin, North Central Nigeria (20)
More from AZOJETE UNIMAID
More from AZOJETE UNIMAID (20)
Recently uploaded
Recently uploaded (20)
Assessment of Groundwater Quality in Ilorin, North Central Nigeria
- 1. Arid Zone Journal of Engineering, Technology and Environment, February, 2017; Vol 13(1):111-126 Copyright © Faculty of Engineering, University of Maiduguri, Maiduguri, Nigeria. Print ISSN: 1596-2490, Electronic ISSN: 2545-5818, www.azojete.com.ng 111 ASSESSMENT OF GROUNDWATER QUALITY IN ILORIN, NORTH CENTRAL NIGERIA O.M. Kolawole* and O. Afolayan (Department of Microbiology, University of Ilorin, Ilorin, Nigeria. Infectious Diseases and Environmental Health Research Group, Department of Microbiology, University of Ilorin, Ilorin. Nigeria.) * Corresponding author’s e-mail address: omk@unilorin.edu.ng & tomak7475@gmail.com Abstracts Growth in human population and anthropogenic activities has increased the rate of groundwater pollution in the world. This study assessed the quality of water samples collected from open wells from eight different locations in Ilorin, North Central, Nigeria between December 2014 and June 2015. The physicochemical parameters of water samples were analyzed using standard methods. Total bacterial count and total coliform count were determined by standard plate method and membrane filtration technique respectively. Identification of isolated bacteria was done using Bergey’s Manual of Determinative Bacteriology and confirmed by sequencing the DNA of the isolates. The physicochemical values of the water samples ranged as follows: temperature (28.20±0.440 C to 27.50±0.370 C), pH (7.22±0.06 and 6.80±0.04), conductivity (577.80±41.28 µS/cm), turbidity (6.31±0.21 to 2.69±0.40NTU), total suspended solids (6.20±2.60 to 47.50±1.70mg/l), total dissolved solids (295.40±37.12 to 208.40±31.19 mg/l), dissolved oxygen (9.81±0.37 to 7.04±0.40mg/l), biochemical oxygen demand (6.25±1.31 to 4.38±0.28mg/l), total hardness (294.20±3.81 to 278.10±7.14mg/l), nitrate concentration (23.80±1.61 to 17.47±3.58mg/l) and sulfate concentration (30.58±2.43 to 25.35±1.16mg/l). The water sources were found to have a total bacterial count and total coliform counts above the recommended national and international guidelines. The contamination of the water sources by E. coli and other pathogenic bacteria implies that they are not fit for human consumption. Keywords: Groundwater, physicochemical, Coliform, pollution, E. coli 1. Introduction One of the most essential and abundant resources in the world is water (UNDP, 2006). All life on earth depends on the availability of water for their survival, growth and development (Simpi et al., 2011). Well water has been considered as one of the purest form of water in nature and meets the overall demand of rural and semi-urban people. However, increase in industrial activities has raised serious concern regarding the susceptibility of well water contamination due to industrial wastes (Tyagi et al., 2002). The high rate at which cities are growing across the world is frightening; this implies that human population with its associated sanitation problems are growing faster than supply of qualitative water (Jackson et al., 2001). This situation has led to a reduction in the per capita availability of quality water in the coming century Ajayi and Adejumo, 2011). A large percentage of the population in developing countries lack adequate potable water supply thus they are compelled to use marginally qualitative water from other sources like springs, streams, shallow wells and boreholes for domestic and drinking purposes (Jamielson et al., 2004; Welch et al., 2000). The increase in human population and anthropogenic activities which has led to the demand for water for domestic and industrial activities have continuously threatened this valued resource
- 2. Arid Zone Journal of Engineering, Technology and Environment, February, 2017; Vol 13(1):111-126 ISSN 1596-2490; e-ISSN 2545-5818; www.azojete.com.ng 112 (Umeh, 2005). Water quality is a function of both natural and anthropogenic activities (Kolawole et al., 2013). Today groundwater reservoirs are constantly being polluted at a high rate through the addition of industrial, domestic and agricultural wastes (Aremu et al., 2011). In most developing countries, many communities suffer scarcity of qualitative water. Only little percentage of total urban population has direct access to treated pipe-borne water. The larger percentage has other water sources of questionable quality to contain with (Gerald, 2011). According to WHO (2000), about 1 billion people in developing countries lack access to safe drinking water with a greater percentage found in developing countries. This increasing deficiency of potable water has necessitated the use of water from other sources that are prone to contamination. Consequently, developing countries are particularly plagued with water-borne diseases (Aderibigbe et al., 2008). Therefore, it is essential to routinely examine the sources and quality of drinking water to safeguard public health. The analyses of some water sources have revealed a considerable degree of water contamination by total and fecal coliforms (Opisa et al., 2012). The presence of fecal coliforms in drinking water is an indication of contamination of such water with fecal matters. These indicators of water quality were found to be more prevalent in unprotected water sources (Zamxaka et al., 2004). The provision of clean drinking water, especially in developing countries like Nigeria, has always been a major challenge (Raji and Ibrahim, 2011). In Nigeria, many rural dwellers rely on well, stream and river water for their domestic use due to lack of access to potable water (Shittu et al., 2008). Almost all groundwater sources (wells) which are not used during the rainy season when water is adequately available are major sources of water in homes during the dry season when the resource is scarce in Ilorin. These water sources are contaminated by various pathogenic microorganisms – bacteria, fungi, and viruses; these pathogenic agents have been implicated in various diseases that affect human health. Almost every community in Ilorin has several wells (open and closed) which serve as water sources for the inhabitants. Within these communities there are various improperly managed sanitation systems; wastes are disposed indiscriminately on major roads, market places, inadequate toilet facilities and in water bodies. These practices potentially pollute the groundwater. In this study, the extent of water pollution of open well located within Ilorin municipality is assessed. 2. Materials and Methods 2.1 Description of the study area The study was conducted in Ilorin, the capital of Kwara State, Nigeria situated 306km inland from the coastal city of Lagos and 500km from the Federal Capital Territory (FCT), Abuja. The area is located between Latitude 80 33’N and Longitude 40 55’E. As of 2007, Ilorin had a population of 847,582 making it the 13th largest city in Nigeria by population (The World Gazetteer, 2013).
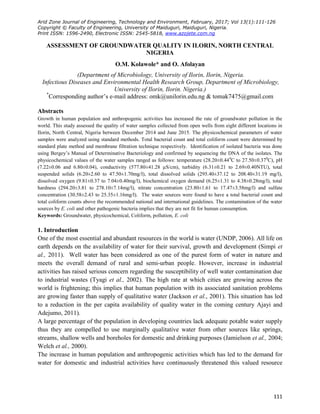
- 3. Kolawole and Afolayan: Assessment of Groundwater quality in Ilorin, North Central Nigeria AZOJETE, 13(1):111-126 ISSN 1596-2490; e-ISSN 2545-5818, www.azojete.com.ng 113 Figure 1: Geographical map of the study area showing the sampling sites KEY: = Sampling sites; A=Airport; B=Asa dam; C = Tanke; D= Agbo Oba; E= Gaa Akanbi; F=Maraba; G=Opo Malu; H=Oja Oba 2.2 Water sampling A total of forty water samples were collected from open wells in eight locations namely Airport road, Asa dam, Tanke, Agbo Oba, Opo Malu, Gaa Akanbi, Maraba and Oja Oba located within Ilorin, North Central, Nigeria between December 2014 and June 2015 for physicochemical and bacteriological analysis. Water samples were collected using standard method as described by Aminu and Amadi (2014). The water samples were transported in an ice pack to the laboratory and analyzed. Each sample was collected in two sterile sample bottles for five different days from each of the eight open wells. The duplicate samples were used for physicochemical and bacteriological analyses separately. For bacteriological analysis, the water samples were collected between 7:30am and 9:00am with sterile plastic containers; transported to the laboratory in an ice box and analyzed immediately. The open wells were situated in proximity to septic tank, uncompleted building used as refuse dump site, abattoir, drainage, car washing centre. H EA B C D F G
- 4. Arid Zone Journal of Engineering, Technology and Environment, February, 2017; Vol 13(1):111-126 ISSN 1596-2490; e-ISSN 2545-5818; www.azojete.com.ng 114 2.3 Physicochemical Analysis The physicochemical properties of the water samples were analyzed using standard methods as stated by APHA (2002). The temperature of the water samples was determined using thermometer, pH was measured using a digital electrode pH meter (met rohm 632), the electrical conductivities and turbidity of the water samples were determined using conductivity kit Wag WT 3020 (Hach model no: 5798A) by WAGTECH international. The Dissolved oxygen (DO), Biological Oxygen Demand (BOD) and chemical Oxygen Demand (COD) were determined using the Winkler’s titration method as described by APHA (2002). Total hardness and sulfate concentrations were determined by the titrimetric method, total solids, total dissolved solids, and total suspended solids were determined by the gravimetric method, and the concentration of nitrate was determined calorimetrically by Spectronic-20 (Gallenkamp, United Kingdom) as described by APHA (2002). 2.4 Bacteriological Analysis The total bacterial count was determined by standard pour plate methods using Nutrient Agar (oxoid) (Fawole and Osho 2001). The number of total coliforms was determined with membrane filtration techniques using Eosin Methylene Blue Agar (oxoid) as described by APHA (2002). For the determination of total bacterial counts and total coliform count, the water samples were incubated at 370 C. Generally bacteria including coliforms grow optimally at 37 C while fecal coliforms thrive at a higher temperature of 44 C. 2.5 Identification of bacterial isolates The bacterial isolates were identified by morphological characterization and genotypic characterization - DNA extraction using QIAamp DNA Mini Kit (250) cat number 51306, DNA amplification using 16S forward primer (27F: AGAGTTTGATCMTGGCTCAG), 16S reverse primer (1525R: AAGGAGGTGWTCCARCCGCA) (Weisburg et al., 1991). The products of the PCR were purified, processed and sequencing reaction were carried on an Applied Biosystems (Model 3130) automated sequencer. The sequences were submitted to the National Center for Biotechnology Information (NCBI) Dublin, Ireland, gene bank for identification. 2.6 Statistical Analysis Relationships between variables of physicochemical parameters and biological parameters were determined by Pearson correlation. Analyzes were carried out with the aid of Statistical Package for Social Science (Version 21). 3.0 Results and discussions The physicochemical properties of the water samples from the open wells from the eight different locations within the Ilorin Metropolis are presented in Table 1 and 2. The physicochemical analysis results indicate that the temperature of the water samples falls within recommended values for groundwater (0-300 C). The results indicated that the temperature of the water samples as at the time of the analysis ranged from 28.20±0.440 C to 27.50±0.370 C with water sample D recording the highest temperature while water sample H recorded the lowest
- 5. Kolawole and Afolayan: Assessment of Groundwater quality in Ilorin, North Central Nigeria AZOJETE, 13(1):111-126 ISSN 1596-2490; e-ISSN 2545-5818, www.azojete.com.ng 115 temperature. Factors such as climate or temperature of the geographical area, direct sunlight and depth of the open wells could be responsible for the relatively constant temperature of water samples (Ekhaise and Anyansi, 2005). This may affect the biochemical and physiological activities of organisms found in the water sources. The temperature range is in consonance with Ajayi and Adejumo, (2011) who reported 28.30 C for well water in Akungba Akoko in Ondo State. The pH values of the water samples recorded generally varied between 7.22±0.06 and 6.80±0.04 with sample D and E having the highest and lowest pH values respectively. The pH of the water samples also complied with the values (6.5-8.5) recommended by WHO and agreed with the results of Ogbonna et al., (2010) for various groundwater samples. The pH of water samples could be determined by type of soil and free carbon (IV) oxide level in the water samples. The fluctuations in optimum pH ranges may result in increase or decrease in the toxicity of poisons in water bodies (Okonko et al., 2008). The importance of the hydrogen ion concentration (pH) of water is evident in the manner it affects the chemical reactions and biological systems (Kolawole et al., 2013). The electrical conductivity ranged from 577.80±41.28 µS/cm in sample F to 476.50±48.72 µS/cm from sample A. Turbidity of the water samples generally varied between 6.31±0.21NTU and 2.69±0.40NTU; sample H had the highest turbidity while sample C had the lowest turbidity (Table 1).The turbidity of the water sample G and H did not comply with standard requirements. Their values exceeded the 5NTU recommended by WHO, (2006). This may be due to parental rock activities and surface run off. However, the result agreed with Ezeribe et al. (2012) who reported 6.30±1.00NTU turbidity for well water in Plateau State, Nigeria. Excessive turbidity, in drinking water, may represent a health concern. Furthermore, turbidity renders drinking water aesthetically unappealing. If not removed, turbidity shields pathogens from the bactericidal effect of treatment chemicals, hence promoting the regrowth of pathogens in the distribution channels, resulting in an outbreak of water-related diseases, which have caused significant cases of gastroenteritis throughout the world (Okpokwasili et al., 2013). The highest total solid (348.80±41.58mg/l) was recorded from sample H while the lowest value (258.50±28.48mg/l) was from sample C. Total suspended solids recorded were observed to vary between 56.20±2.60mg/l and 47.50±1.70mg/l. Sample H recorded the highest TDS of 295.40±37.12mg/l while sample C had the lowest TDS of 208.40±31.19 mg/l. The Total Dissolved Solids (TDS) represents the percentage of inorganic substances available in water which reveals the nature of water quality (Olajire and Imeokparia, 2001). Sewage runoff natural sources, industrial and agricultural waste water and chemicals used in the water treatment processes can influence TDS in drinking water. The total solids and total dissolved solids of the water samples from the eight locations fall below the recommended value of 500mg/l (EPA, 2003; WHO, 2001). High total dissolved solids gives objectionable odour or offensive taste in water (Aydin, 2007). This result was also in consonance with an earlier study by Ogbonna et al. (2010) and Shittu et al. (2008) on well water.
- 6. Arid Zone Journal of Engineering, Technology and Environment, February, 2017; Vol 13(1):111-126 ISSN 1596-2490; e-ISSN 2545-5818; www.azojete.com.ng 116 A narrow range of dissolved oxygen of the water samples was observed with 9.81±0.31mg/l being the highest and 7.04±0.40mg/l the lowest. All the water samples had dissolved oxygen exceeding the recommended 5mg/l by WHO (2006). Dissolved oxygen is one of the most important parameters of water. Direct and indirect information such as nutrient availability, the level of pollution, metabolic activities of microorganisms, stratification, and photosynthesis can be deduced from its correlation with water body (Premlata, 2009). Dissolved Oxygen is of great significance to all living organisms; its presence in water bodies can result from direct diffusion from air or production by autotrophs through photosynthesis. Dissolved oxygen concentration is one of the most important parameters that can be employed to determine the distribution and abundance of several algal groups and indicate water purity (Bhatt et al., 1999). Sample F recorded the highest BOD of 6.25±1.31mg/l while sample D recorded the lowest BOD of 4.38±0.28. The result of the BOD of the water samples did not comply with the recommended standard value (<3mg/l) for drinking water. They all showed high values. The COD of the water samples also exceed the maximum permissible limit for drinking water. This could be as a result of the heavy contamination the water sources are exposed to. The values recorded for the chemical oxygen demand generally ranged from 12.72±0.39mg/l to 8.15±0.32mg/l. Biochemical Oxygen Demand and Chemical Oxygen Demand are used to measure oxygen used and equate it to the amount of organic matter available in the water sample (Clarke et al., 2004). BOD measures the amount of oxygen utilized by microorganisms, in this case, bacterium, to oxidize organic matter available within the water sample (Parihar et al., 2012). The highest total hardness of 294.20±3.81mg/l was found in sample F while sample C recorded the lowest total hardness of 278.10±7.14mg/l. From the results in Table 1, the total hardness of the samples was less than 500mg/l which falls within the maximum permissible limit for drinking water by WHO (2006). The result of this study contradicts 336.80±15.20mg/l reported by Ezeribe et al. (2012) but it is in consonance with the findings of Bello et al. (2013). Hardness is an important parameter in reducing the harmful effect of poisonous elements. The deposition of calcium and magnesium salts in water increases the hardness of such water hence the pollution of the waters (Bhatt et al., 1999). The soil composition of the sampling sites and lack of casting of the wall of open well may have contributed to the high total hardness of the water sample F and G. Hard water is not useful for domestic as well as agriculture purpose and this is predominantly caused by calcium and magnesium cations. Also people with kidney diseases should avoid high content of calcium and magnesium in water. The nitrate concentration recorded for the water samples ranged between 23.80±1.61mg/l and 17.47±3.58mg/l where samples G and B were found to have the highest and the lowest nitrate concentrations respectively. According to WHO (2007), the antibacterial properties of nitrate may play a key role in protecting the gastrointestinal tract against a variety of gastrointestinal pathogens. However, excessive nitrate concentration in drinking water constitutes a significant risk factor for bottle-fed babies. This could result in an increase in methemoglobinemia and possible cyanosis (Greer and Shannon, 2005). Factors such as agricultural activity (excessive organic and inorganic manure application), wastewater disposal, human and animal excreta,
- 7. Kolawole and Afolayan: Assessment of Groundwater quality in Ilorin, North Central Nigeria AZOJETE, 13(1):111-126 ISSN 1596-2490; e-ISSN 2545-5818, www.azojete.com.ng 117 including septic tanks that were situated very close to the open wells may have contributed to the elevated nitrate levels observed in this study (Bello et al., 2013; Shittu et al., 2008). Sulfate concentration of the water samples generally ranged from 30.58±2.43mg/l and 25.35±1.16mg/l; the highest sulfate concentration was recorded with sample B and lowest was recorded with sample D (Table 2). Sulfates are a compound containing sulfur and oxygen ions and are a part of naturally occurring minerals in some formations of soil and rock that contain groundwater. The minerals dissolve over a period and are released into groundwater (Okpokwasili et al., 2013). The sulfate levels of the water samples were below the 200mg/l recommended value by WHO (2006).
- 8. Arid Zone Journal of Engineering, Technology and Environment, February, 2017; Vol 13(1):111-126 ISSN 1596-2490; e-ISSN 2545-5818; www.azojete.com.ng 118 Table 1: Physicochemical Characteristics of Open Well Water Samples taken at different location in Ilorin Parameter A B C D E F G H WHO Temperature(0 C) 27.60±0.51a 27.60±0.18a 27.90±0.29a 28.20±0.44a 28.00±0.42a 27.40±0.33a 28.00±0.16 a 27.50±0.37 a 0-30 pH 6.83±0.07a 476.50±48.72c 6.90±0.07a 7.06±0.14 a 7.22±0.06 a 6.80±0.04 a 6.99±0.12 a 6.84±0.07 a 6.99±0.14 a 6.5- 8.5 Conductivity (µS/cm) 526.90±53.12b 458.50±60.62c 542.90±52.79b 518.80±51.64b 577.80±41.28a 546.60±45.12b 575.30±61.92a Turbidity (NTU) 3.21±0.87b 4.10±1.10b 2.69±0.40c 3.87±0.64b 4.44±1.21b 4.53±1.11b 5.88±1.08a 6.31±0.21a 6.0 TS (mg/l) 274.70±31.26b 322.00±48.98a 258.50±28.48b 307.10±31.69b 295.30±17.33b 347.20±20.88a 325.60±32.65a 348.80±41.58a 500 TSS (mg/l) 47.50±1.70b 56.10±4.66a 52.10±4.24a 47.60±3.59b 56.20±2.60a 56.00±8.55a 52.70±2.68a 53.40±5.94a NS Values represent the mean and standard error of mean (n=5). Values with the same superscripts across a row are not significantly different but those with different superscripts are significantly different at p < 0.05. KEY: TS=Total Solids; TSS=Total Suspended Solids . A=Airport; B=Asa dam; C = Tanke; D= Agbo Oba; E= Gaa Akanbi; F=Maraba; G=Opo malu; H=Oja Oba.
- 9. Kolawole and Afolayan: Assessment of Groundwater quality in Ilorin, North Central Nigeria AZOJETE, 13(1):111-126 ISSN 1596-2490; e-ISSN 2545-5818, www.azojete.com.ng 119 Table 2: Physicochemical Characteristics of Open Well Water Samples taken at different sites in Ilorin Parameter A B C D E F G H WHO TDS(mg/l) 227.20±31.33b 267.80±46.94a 208.40±31.19b 259.60±33.17a 239.00±19.49b 279.90±21.06a 273.00±30.51a 295.40±37.12a 500 DO (mg/l) 8.88±0.64b 8.55±0.60b 9.69±0.80b 7.04±0.40c 8.03±0.50b 9.07±1.17b 9.81±0.37a 8.27±0.65 b 7.5 BOD (mg/l) 4.82±0.37 a 4.99±0.58a 5.53±0.43a 4.38±0.28b 5.10±0.82a 6.25±1.31a 5.99±0.58a 5.57±0.71a 10 COD (mg/l) 8.27±1.20b 9.89±0.78b 9.09±0.65b 8.15±0.32b 9.62±0.37b 8.56±0.81b 12.72±0.39a 10.80±0.80b <50 Total Hardness (mg/l) 290.60±10.78a 287.30±11.46a 278.10±7.14b 292.10±3.29a 281.20±4.08b 294.20±3.81a 291.00±7.11a 293.80±11.63a 500 Nitrate (mg/l) 18.19±2.87b 17.47±3.58b 17.77±1.91b 22.50±1.97a 21.20±1.65a 22.01±2.34a 23.80±1.61a 21.05±1.99a 50 Sulfate (mg/l) 28.61±0.96a 30.58±2.43a 28.61±0.62a 25.35±1.16b 28.28±0.43a 29.60±0.61a 28.82±0.70a 29.44±1.57a 500 Values represent the mean and standard error of mean (n=5). Values with the same superscripts across a row are not significantly different but those with different superscripts are significantly different at p < 0.05. KEY: TDS=Total Dissolved Solids; DO=Dissolved Oxygen; BOD=Biochemical Oxygen Demand; COD=Chemical Oxygen Demand. A=Airport; B=Asa dam; C = Tanke; D= Agbo Oba; E= Gaa Akanbi; F=Maraba; G=Opo malu; H=Oja Oba.
- 10. Arid Zone Journal of Engineering, Technology and Environment, February, 2017; Vol 13(1):111-126 ISSN 1596-2490; e-ISSN 2545-5818; www.azojete.com.ng 120 The results of the bacteriological analyzes of the water samples are presented in Table 3. The total bacterial count of the water samples within the eight (8) different sampling sites range from 5.60x10⁶ to 5.30×10⁴ cfu/ml. Sample B and E had the highest counts of 2.24×10⁶ and 5.60x10⁶ cfu/ml respectively while sample C and H had the lowest counts of 5.30×10⁴ and 6.90×10⁴ cfu/ml respectively. The highest coliform count of 72 cfu/100ml was recorded from sample E while sample C had the lowest coliform counts of 25 cfu/100ml. The different strains of bacteria isolated from water samples from open wells in this study after their DNA sequence include Enterobacter cloacae strain GGT036, Citrobacter rodentium ICC168, Acinetobacter baumannii PKAB07, Klebsiella pneumoniae strain PMK1, Kocuria flava strain GN110, Pseudomonas aeruginosa strain VRFPA04, Escherichia coli strain ST2747, Shigella sonnei 53G and Salmonella enterica subsp. enterica serovar Typhimurium strain 08-1736. The occurrence of these bacterial isolates in water samples from the eight different locations used for this study is presented in Table 4. It is established that water supplies contaminated with human and animal feces are capable of transmitting a large number of infectious diseases (Anyanwu and Okoli, 2012). The bacteriological analysis results showed that all water samples were not fit for human consumption (drinking) as they fail to meet WHO (2006) standards. The coliforms, the primary bacterial indicator for fecal pollution in water were detected in all the water samples. Coliforms are the most abundant bacteria in water responsible for water-borne diseases such as typhoid, dysentery, diarrhea and have also been implicated in mortality across the world (WHO, 2000). The extremely high bacterial load and coliform count of all the open water were far above the values recommended by the WHO for drinking water; (1×10² cfu/ml) for the total heterotrophic count and zero coliform count); therefore drinking from any of the open wells used for this study will lead to serious health conditions. These results comply with other studies across Nigeria which showed the presence of coliforms in most potable water sources (Aminu and Amadi, 2014; Anyanwu and Okoli, 2012; Odediran and Olajide, 2011; Odeyemi and Agunbiade, 2012). There were negative correlations between all the physicochemical parameters (except temperature, total suspended solids and sulfate concentration) and total heterotrophic count of the water samples (Table 5). All the physicochemical parameters except temperature, turbidity and nitrate concentration also showed significant negative correlations with total coliform counts of the water samples. The physicochemical parameters had no significant effect on the total heterotrophic and total coliform counts of the water sample (p > 0.05) (Table 5).
- 11. Kolawole and Afolayan: Assessment of Groundwater quality in Ilorin, North Central Nigeria AZOJETE, 13(1):111-126 ISSN 1596-2490; e-ISSN 2545-5818, www.azojete.com.ng 121 Table 3: Total bacterial count and Total Coliform Count of water samples from open wells within Ilorin Municipality Site Total bacterial count (cfu/ml) Total Coliform Count (cfu/100ml) A 2.09x 10⁶ 59 B 2.24x10⁶ 35 C 5.30x10⁴ 25 D 3.60x10⁵ 44 E 5.60x10⁶ 72 F 1.04x10⁵ 32 G 2.48x10⁵ 34 H 6.90x10⁴ 54 WHO Guidelines 1.0x10² /100ml 0 KEY: A=Airport; B=Asa dam; C = Tanke; D= Agbo Oba; E= Gaa Akanbi; F=Maraba; G=Opo malu; H=Oja Oba. Table 4: Occurrence of bacterial isolates in open wells in Ilorin, North Central, Nigeria. Bacterial isolates A B C D E F G H Enterobacter cloacae strain GGT036 + + - - + + - + Citrobacter rodentium ICC168 + + + - - + - - Kocuria flava strain GN110 + - - + - - + - Acinetobacter baumannii PKAB07 - + + + + + - + Klebsiella pneumonia PMK1 + + + - + - + + Escherichia coli strain ST2747 + + + + + + + + Shigella sonnei 53G + - - + + - + + Salmonella enterica - + + - - + + - Pseudomonas aeruginosa VRFPA04 - + + + + - + - KEY: + = Present; - = Absent; A=Airport; B=Asa dam; C = Tanke; D= Agbo Oba; E= Gaa Akanbi; F=Maraba; G=Opo malu; H=Oja Oba
- 12. Arid Zone Journal of Engineering, Technology and Environment, February, 2017; Vol 13(1):111-126 ISSN 1596-2490; e-ISSN 2545-5818; www.azojete.com.ng 122 Table 5: Correlations between physicochemical quality and bacteriological quality of open wells within Ilorin municipality. S/N Physicochemical Parameter Total Heterotrophic Count Total Coliform Count 1 Temperature Pearson Correlation Sig. (2-tailed) 0.169 0.689 0.074 0.862 2 pH Pearson Correlation Sig. (2-tailed) -0.604 0.113 -0.419 0.301 3 Conductivity Pearson Correlation Sig. (2-tailed) 0.250 0.550 -0.002 0.996 4 Turbidity Pearson Correlation Sig. (2-tailed) -0.148 0.727 0.154 0.715 5 Total Solids Pearson Correlation Sig. (2-tailed) -0.275 0.511 -0.078 0.854 6 Total Suspended Solids Pearson Correlation Sig. (2-tailed) 0.307 0.460 -0.080 0.851 7 Total Dissolved Solids Pearson Correlation Sig. (2-tailed) -0.312 0.452 -0.053 0.901 8 Dissolved Oxygen Pearson Correlation Sig. (2-tailed) -0.293 0.482 -0.052 0.184 9 Biochemical Oxygen Demands Pearson Correlation Sig. (2-tailed) -0.373 0.363 -0.431 0.286 10 Chemical Oxygen Demand Pearson Correlation Sig. (2-tailed) -0.106 0.802 -0.111 0.730 11 Total Hardness Pearson Correlation Sig. (2-tailed) -0.461 0.256 -0.008 0.986 12 Nitrate Concentration Pearson Correlation Sig. (2-tailed) -0.187 0.657 0.069 0.871 13 Sulfate concentration Pearson Correlation Sig. (2-tailed) 0.051 0.905 -0.192 0.649 4.0 Conclusion and recommendations The analysis of the water samples from open wells within Ilorin, North Central, Nigeria revealed that samples from the eight different locations contain one form of contaminant or the other. The study also revealed high bacterial contaminants in excess of the recommended limit by WHO which makes the water unsuitable for drinking. Proper treatment or disinfection of the water sources should be carried out to reduce the level of contaminants; sanitary conditions around the
- 13. Kolawole and Afolayan: Assessment of Groundwater quality in Ilorin, North Central Nigeria AZOJETE, 13(1):111-126 ISSN 1596-2490; e-ISSN 2545-5818, www.azojete.com.ng 123 open wells should also be improved to eliminate the possible sources of contamination. Potable water should be made accessible and affordable to the citizens by the government. References Aderibigbe, SA. Awoyemi, AO. and Osagbami, GK. 2008. Availability, adequacy and quality of water supply in Ilorin Metropolis Nigeria. European Journal of Scientific Research, 23(4): 528- 536. Ajayi, AO. and Adejumo, TO. 2011. Microbiological assessment and some physicochemical properties of water sources in Akungba-Akoko, Nigeria. Journal of Toxicology and Environmental Health Sciences, 3(13), pp. 342-346. Aminu, T. and Amadi, AN. 2014. Bacteriological contaminations of ground water from Zango Local Government Area, Katsina State, North Western Nigeria. Journal of Geoscience and Geomatics, 2(5): 186-195 APHA, 2002. Standard Methods for the Examination of Water and Wastewater. American Public Health Association, Washington DC (20). Anyanwu, CU. and Okoli, EN. 2012. Evaluation of the bacteriological and physicochemical quality of water supplies in Nsukka, Southeast, Nigeria. African Journal of Biotechnology, 11(48): 10868-10873. Aremu, MO. Olaofe, O. Ikokoh, PP. and Yakubu, MM. 2011. Physiochemical characteristics of stream, well and borehole water sources in Egg on, Nasarawa State, Nigeria. Journal of Chemical Society of Nigeria, 36(1): 131-136 Aydin, A. 2007. The microbiological and physiological quality of ground water in West Thrace, Turkey. Polish Journal of Environmental Studies, 16 (3): 377-383 Bello, OO. Osho, A. Bankole, SA. and Bello, TK. 2013. Bacteriological and Physicochemical analyzes of Borehole and Well Water Sources in Ijebu-Ode, South Western Nigeria. Journal of Pharmaceutical and Biological Research, 8(2): 18-25 Bhatt, LR. Lacoul, HD. Lekhak, H. 1999. Physicochemical characteristics and phytoplankton of Taudaha Lake, Kathmandu, Poll Res. 18(4): 353-358 Clarke, EO. Anetekhai, MA. Akin-Oriola, GA. Onanuga, A.I.S. Olaninmoye, O.M. Adaboyejo, OA. and Agboola, I. 2004. The Diatom (Bacillariophyta) Diversity of an Open Access Lagoon in Lagos, Nigeria. Journal of Research and Review in Science, 3:70-77 Ekhaise, FO. and Anyansi, CC. 2005. Influence of brewery effluent discharge on the Microbiological and physicochemical quality of Ikpoba River, Nigeria. African Journal of Biotechnology, 4(10):1062-1065.
- 14. Arid Zone Journal of Engineering, Technology and Environment, February, 2017; Vol 13(1):111-126 ISSN 1596-2490; e-ISSN 2545-5818; www.azojete.com.ng 124 EPA, 2003. Environmental Protection Agency, Safe Drinking Water Act. EPA 816-F-03 016. Ezeribe, AI., Oshieke, KC. and Jauro, A. 2012. Physicochemical properties of well water samples from some villages in Nigeria with cases of stained and mottled teeth. Science World Journal, 7 (No 1) Fawole, MO. and Oso, BA. 2001. Laboratory Manual of Microbiology Spectrum Books Limited, Ibadan, Nigeria. Pp 6-52. Gerald, P. 2011. Water Science. University of Washington. Available from: http://faculty.washington.edu/ghp/researcthemes/water-science. HTML (cited in February 2011) Greer, FR. and Shannon, M. 2005. Infant methemoglobinemia: The role of dietary nitrate in food and water. Pediatrics, 116(3): 784-786. Jackson, RB. Carpenter, SR. Dahm, CN. McKnight, DM. Naiman, RJ. Postel, SL. and Running, SW. 2001. Water in a Changing World. Issues in Ecology. Ecological Society of America, USA, 9, Pp14. Jamielson, R. Gordon, R. Joy, D. and Lee, H. 2004. Assessing Microbial Pollution of rural surface waters: A review of current watershed scale modeling approaches. Agricultural Water Management, 70:1-17 Kolawole, OM. Alamu, FB. Olayemi, AB. and Adetitun, DO. 2013. Bacteriological analysis and effects of water consumption on the hematological parameters in rats. International Journal of Plant, Animal and Environmental Sciences, 3(2):125 – 131 Odediran, OA. and Olajide, JA. 2011. Bacteriological examination of selected well waters in Ilorin. Nigeria. Journal of Research and Development, 3:18-23 Odeyemi, AT. and Agunbiade, O. 2012. Bacteriological and metal analyzes of water samples from Awotunde fish pond and river. Scientific Journal of Microbiology, 1(2):48-54 Ogbonna, CE., Njoku, HO., Onyeagba, RA. and Nwaugo, VO. 2010. Effects of seepage from drilling burrow Pit wastes on Orashi River, Egbema, Rivers State, Nigeria. Nigerian Journal of Microbiology, 24(1): 193-200. Okonko, IO., Adejoye, OD., Ogunnusi, TA., Fajobi, EA. and Shittu, OB. 2008. Microbiological and physicochemical analysis of different water samples used for domestic purposes in Abeokuta and Ojota, Lagos State, Nigeria. African Journal of Biotechnology, 7(5):617-621 Okpokwasili, GC., Douglas, SI. and Inengite, AK. 2013. Seasonal variations of some physicochemical parameters of groundwater in crude oil flow stations. Journal of Environment, Science and Water Resources, 2(1): 22-26.
- 15. Kolawole and Afolayan: Assessment of Groundwater quality in Ilorin, North Central Nigeria AZOJETE, 13(1):111-126 ISSN 1596-2490; e-ISSN 2545-5818, www.azojete.com.ng 125 Olajire, AA. and Imeppeoria, FE. 2001. Water quality assessment of Osun River: Studies on inorganic nutrients. Environmental Monitoring Assessment, 69: 17-28 Opisa, S., Odiere, MR., Jura WZO., Karanja, DMS. and Mwinzi, PN. 2012. Fecal contamination of public water sources in informal settlements of Kisumu City, Western Kenya. Water Science and Technology, 66: 2674-2681 Parihar, SS., Kumar, A., Gupta, RN., Pathak, M., Shrivastav, A. and Pandey, AC. 2012. Physicochemical and microbiological analysis of underground water in Gwalior city, mp, India. Research Journal of Recent Science, 1(6): 62-65 Premlata, V. 2009. Multivariant analysis of drinking water quality parameters of Lake Pichhola in Udaipur, India. Biological Forum - An International Journal, 1(2): 97-102. Raji, MIO. and Ibrahim, YKE. 2011. Prevalence of water-borne infections in North Western Nigeria: A retrospective study. Journal of Public Health and Epidemiology, 3(8): 382-385 Shittu, OB., Olaitan, JO. and Amusa, TS. 2008. Physicochemical and bacteriological analyzes of water used for drinking and swimming purposes in Abeokuta, Nigeria. African Journal of Biomedical Research, 11: 285 – 290 Simpi, SM., Hiremath, KNS., Murthy, KN., Chandrashekarappa, AN. and Patel, ET. 2011. Analysis of water quality using physicochemical parameters Hosahalli Tank in Shimoga District, Karnataka, India. Global Journal of Science Frontier Research, 1(3): 31-34. The World Gazetteer- Ilorin, Nigeria. Archived from the original on February 9, 2013. Tyagi, P., Buddhi, D., Chaudlhary, R. and Sawhney, RL. 2002. Degradation of ground water quality in industrial areas of india- A review Ind. V. Environmental protection, 20, 174-181 Umeh, CN., Okorie, OI., and Emesiani, GA. 2005. Towards the provision of safe drinking water: The bacteriological quality and safety of satchet water in Awka, Anambra State. In: the Book of Abstract of the 29th Annual conference and general meeting on microbes as agents of sustainable development organized by tNigerian Society for Microbiology (NSM), University of Agriculture, Abeokuta, 14 - 17. UNDP 2006. Human development report 2006: Beyond Scarcity: Power, Poverty and the Global Water Crisis (November 2006). Available at SSRN: https://ssrn.com/abstract=2294691 Weisburg, WG., Barns, SM., and Pelletier, DA. 1991. 16S ribosomal DNA amplification for phylogenetic study. Journal of Bacteriology, 173:697-703. Welch, P., David, J., Clarke, TAPD., Berston, S., McDougall, L. and Adesiyin, AA. 2000. Microbial Sanitation of Water in Rural Communities of Trinidad. Pan American Journal of Public Health, 8(3):172-180
- 16. Arid Zone Journal of Engineering, Technology and Environment, February, 2017; Vol 13(1):111-126 ISSN 1596-2490; e-ISSN 2545-5818; www.azojete.com.ng 126 WHO. 2000. Global Water Supply and Sanitation Assessment 2000 Report. United Nations, New York. WHO. 2001. Guidelines for Drinking Water Quality, Recommendation, Geneva. pp. 130. WHO. 2006. Guidelines for Drinking Water Quality. 3rd edition, WHO press, Geneva, Switzerland. Pp.355 - 398 WHO. 2007. Nitrate and nitrite in drinking water. Background document for preparation of guidelines for drinking water quality. Geneva, World Health Organization. Zamxaka, M., Pironcheva, G. and Muyiwa, NYO. 2004. Microbiological and physicochemical assessment of the quality of domestic water sources in selected rural communities of the Eastern Cape Province, South Africa. Water SA. 30: 333-340