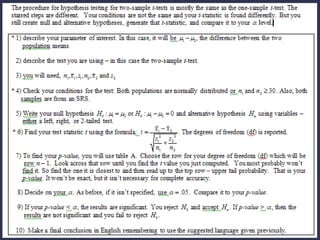
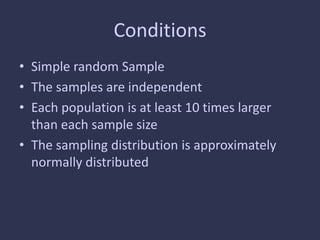
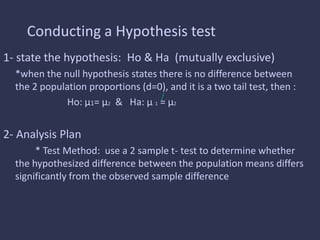
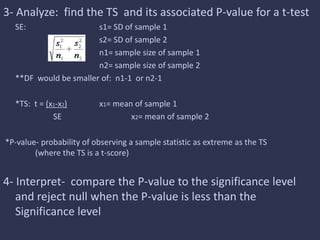
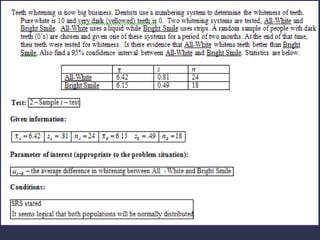
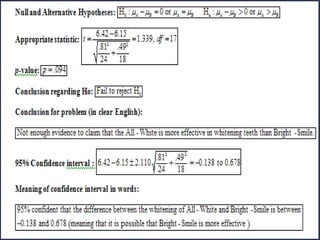
Hypothesis test for
Difference Between
Means (unpaired)
•
•
Conditions
• Simple random Sample
• The samples are independent
• Each population is at least 10 times larger
than each sample size
• The sampling distribution is approximately
normally distributed
Conducting a Hypothesis test
1- state the hypothesis: Ho & Ha (mutually exclusive)
*when the null hypothesis states there is no difference between
the 2 population proportions (d=0), and it is a two tail test, then :
Ho: μ1= μ2 & Ha: μ 1 = μ2
2- Analysis Plan
* Test Method: use a 2 sample t- test to determine whether
the hypothesized difference between the population means differs
significantly from the observed sample difference
3- Analyze: find the TS and its associated P-value for a t-test
SE: s1= SD of sample 1
s2= SD of sample 2
n1= sample size of sample 1
n2= sample size of sample 2
**DF would be smaller of: n1-1 or n2-1
*TS: t = (x1-x2) x1= mean of sample 1
SE x2= mean of sample 2
*P-value- probability of observing a sample statistic as extreme as the TS
(where the TS is a t-score)
4- Interpret- compare the P-value to the significance level
and reject null when the P-value is less than the
Significance level
B.7  diff between means

B.7 diff between means

  • 1.
    Hypothesis test for DifferenceBetween Means (unpaired)
  • 2.
  • 3.
  • 5.
    Conditions • Simple randomSample • The samples are independent • Each population is at least 10 times larger than each sample size • The sampling distribution is approximately normally distributed
  • 6.
    Conducting a Hypothesistest 1- state the hypothesis: Ho & Ha (mutually exclusive) *when the null hypothesis states there is no difference between the 2 population proportions (d=0), and it is a two tail test, then : Ho: μ1= μ2 & Ha: μ 1 = μ2 2- Analysis Plan * Test Method: use a 2 sample t- test to determine whether the hypothesized difference between the population means differs significantly from the observed sample difference
  • 7.
    3- Analyze: findthe TS and its associated P-value for a t-test SE: s1= SD of sample 1 s2= SD of sample 2 n1= sample size of sample 1 n2= sample size of sample 2 **DF would be smaller of: n1-1 or n2-1 *TS: t = (x1-x2) x1= mean of sample 1 SE x2= mean of sample 2 *P-value- probability of observing a sample statistic as extreme as the TS (where the TS is a t-score) 4- Interpret- compare the P-value to the significance level and reject null when the P-value is less than the Significance level