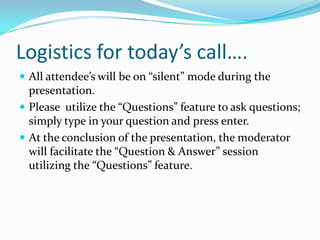
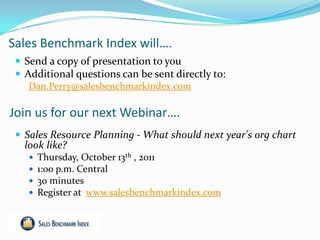
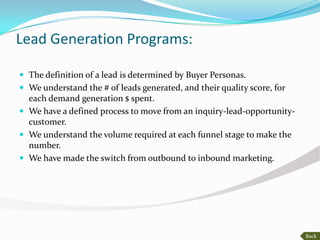
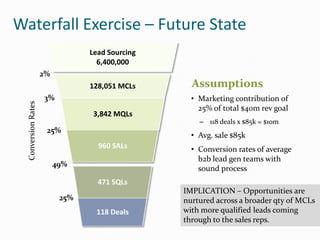
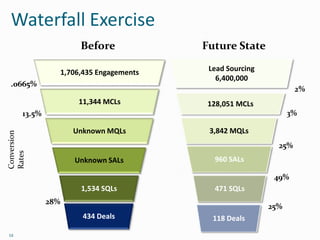
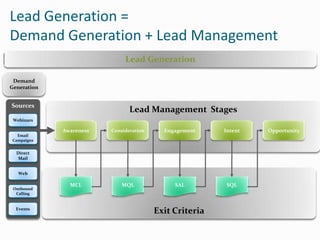
September 8, 2011
Logistics for today’s call….
 All attendee’s will be on “silent” mode during the
  presentation.
 Please utilize the “Questions” feature to ask questions;
  simply type in your question and press enter.
 At the conclusion of the presentation, the moderator
  will facilitate the “Question & Answer” session
  utilizing the “Questions” feature.
Sales Benchmark Index will….
  Send a copy of presentation to you
  Additional questions can be sent directly to:
    Dan.Perry@salesbenchmarkindex.com

Join us for our next Webinar….
  Sales Resource Planning - What should next year's org chart
   look like?
       Thursday, October 13th , 2011
       1:00 p.m. Central
       30 minutes
       Register at www.salesbenchmarkindex.com
 Today’s Guest…..
     Dan Perry
   Principal at SBI
   Prior to SBI, held Executive Sales
    Leadership positions at Aramark,
    Corporate Express, Lavi Industries
    and 3 Day Blinds
   Serves as adjunct professor at
    Pepperdine University for MBA
    program specializing in Sales
    Management
Lead Generation Programs:

 The definition of a lead is determined by Buyer Personas.
 We understand the # of leads generated, and their quality score, for
  each demand generation $ spent.
 We have a defined process to move from an inquiry-lead-opportunity-
  customer.
 We understand the volume required at each funnel stage to make the
  number.
 We have made the switch from outbound to inbound marketing.


                                                                         Back
Lead Generation =
Demand Generation + Lead Management
                              Lead Generation

 Demand
Generation


Sources
                                Lead Management Stages
 Webinars

             Awareness   Consideration     Engagement    Intent   Opportunity
  Email
Campaigns


  Direct
   Mail


   Web

               MCL           MQL              SAL         SQL
 Outbound
  Calling


  Events
                                         Exit Criteria
Persona: Company Profile and Fit                       AWARENESS                                        CONSIDERATION                                 PREFERENCE
                                                                                                                                                        PREFERENCE
Focus Verticals and Employee Count:
Manufacturing, Retail, Transportation, Professional        Buyer                                            Buyer                                      Buyer
& Financial Services (300 – 5000 employees)                •    Do I have a problem?                        •    Can I ignore this?                    •   How long will it take to get this
Indicators of high likelihood of pain, strong fit          •    How does this problem relate to             •    Is there a quick fix?                     fixed?
                                                                achieving my goals?                         •    Can I fix it myself?                  •   How much of our time do I need
• Old legacy in-house ERP and T&A systems
                                                           •    How painful is the problem?                 •    Do I need help?                           to put towards it?
• In-house manual systems and processes                    •    Who does the problem impact –               •    What are my choices if I need         •   How do I know the fix will work?
• Hourly workforce that is decentralized,                       departments, users, employees,                   help?                                 •   How disruptive will it be?
   unionized,                                                   decision makers?                            •    How should I evaluate                 •   How much will it cost?
• Growing/shrinking, leadership change,                    •    What are my peers doing?                         alternatives?                         •   What impact will it have?
   merger/acq                                                                                               •    How will others on my                 •   What happens if it doesn’t work?
• Facing heavily regulation with govt customers                                                                  purchasing committee evaluate
Buying criteria:                                                                                                 alternatives?
• Increased productivity, Compliance, User                                                              I Want…
                                                      I Cant…                                                                                         Key Messages
   experience, business case, systems integration,
   employee satisfaction
                                                       •       Receive advanced notification and        •       Ease of use solution for employees,    •   Increase employee engagement
   HR SVP/EVP (Most senior person)
                                                               visibility to compliance issues                  limited training required                  resulting in higher satisfaction
   Responsibilities: Benefits,                         •       Get visibility or access to historical   •       An early warning alert and             •   Ensure compliance with
   Payroll, recruiting,                                        data to manage compliance issues                 historical view of compliance              automated HR and pay policy
   compensation, performance                           •       Identify root cause of performance               challenges and issues                      enforcement that supports
   management                                                  and productivity issues.                 •       ALL: Access to data that helps me          workers and workplace
   Focus: HR compliance, employee
                                                       •       Maximize the productivity of my                  maximize return on employee            •   High user adoption, reduced
   engagement/culture, productivity, accountability
                                                               workforce                                        investment (Productive/Efficient)          training and fewer errors with BIC
 Role in purchase: Always a key influencer and         •       ALL: Balance staffing                    •       ALL: third party validation and            user experience
 may be drive the evaluation. Evaluates employee               requirements and employee                        proof of financial justification
 engagement, staffing levels, and compliance.                  schedule preference

 Operations COO                                        •       Get the reports I need to compare        •       Ease of use solution for employees,    •   Integrated solution resulting in
                                                               profitability of plants/stores.                  limited training required                  improved accuracy (no re-key)
Responsibilities: Delivers on
                                                       •       Identify root cause of performance       •       To reduce costs of managing my             and speed (no latency)
the promise of the organization
                                                               and productivity issues.                         workforce                              •   Decreases administrative time
(product/service)
                                                       •       Maximize workforce productivity          •       Deliver highest quality at the             Improve customer service and
 Focus: Optimal productivity and efficiency.           •       Receive advanced notification and                lowest cost in shortest time               product quality while reducing
 Seeking Quality, Cost savings and Speed. Process              visibility to labor expense leakage      •       An early warning alert and                 costs by changing the way labor is
 driven to achieve customer satisfaction.              •       Model workforce changes and see                  historical view of compliance              deployed and scheduled
                                                               how they impact KPI’s                            challenges and issues                  •   Cloud solution is scalable and
 Role in purchase: User Buyer, must work with the                                                       •       Schedule the right people, right           configurable, with an upgrade
 CFO to fund a WFM solution.                                                                                    place, right time                          path that is automated and no cost

Finance CFO (delegates to Controller)                  •       Get the reports I need to compare        •       To reduce costs of managing my         •   Self-funding investment, clear ROI
Responsibilities: Delivers bottom                              profitability of plants/stores.                  workforce                              •   Flexibility of solution to meet the
line numbers for the organization.                     •       Receive advanced notification and        •       To drive out costs and enable              current and future needs of my
Financial performance reporting,                               visibility to labor expense leakage              incremental revenue generation             evolving company
forecasting revenue, budgeting                                 and compliance issues                                                                   •   Better align corporate
and cost control                                                                                                                                           performance indicators with
Focus: Financial performance and productivity.                                                                                                             employee activities
Always looking for ways to increase profitability.                                                                                                     •   Cloud solution is scalable and
                                                                                                                                                           configurable, with an upgrade
Role in purchase: Approver/Economic Buyer                                                                                                                  path that is automated and no cost
Private Equity Firm – Top Metrics
   Marketing Sourced Pipeline:
      Percentage of Total Pipe that Marketing has created
   Marketing Influenced Pipeline:
      Percentage of Total Pipe that Marketing has touched during a set
       time period
   Investment to Pipeline Ratio:
      Dollars of Sales Pipeline sourced for every program dollar invested
       in Demand Creation
   Investment to Revenue Ratio:
      Dollars of Revenue sourced for every program dollar invested in
       Demand Generation
   Investment to Influence Ratio:
      Dollars of Sales Pipeline touched for every $1 invested in all
       marketing activities designed to influence opportunities
Lead Generation Waterfall Model
                                                               Demand
                    Demand Generation – Lead Sourcing          Generation
                              (Inquiries)

                      Marketing Captured Lead (MCL)
Marketing                  Inquiry sent to CRM

                     Marketing Qualified Lead (MQL)            Lead
                                                               Management
                     Qualified by LDRs as match to ICP

                        Sales Accepted Lead (SAL)
                       Qualified by LDRs with BANT


                         Sales Qualified Lead (SQL)
                           Opportunity Created           Opportunity
            Sales
                                                         Management
                                   Won
                              “Closed/Won”
Waterfall Exercise – Before
                     Annual Jan ‘10 – Jan ‘11

                           1,706,435 Engagements
       .0665%


             13.5%
                               11,344 MCLs               Assumptions
                                                         • All marketing “leads” were
                              Unknown MQLs                 identified at MCLs
     Conversion


                                                         • All opportunities were
                                                           identified as SQLs
     Rates


                              Unknown SALs

                                                   IMPLICATION – Many opportunities are
                                1,534 SQLs         never developed with only low hanging
                     28%
                                                   fruit freeing itself through the funnel
                                 434 Deals

10
Waterfall Exercise – Future State
                                 Lead Sourcing
                                   6,400,000
                     2%
                                 128,051 MCLs      Assumptions
                     3%                            • Marketing contribution of
  Conversion Rates


                                                     25% of total $40m rev goal
                                  3,842 MQLs
                                                     – 118 deals x $85k = $10m
                      25%
                                                   • Avg. sale $85k
                                   960 SALs        • Conversion rates of average
                                                     b2b lead gen teams with
                          49%
                                                     sound process
                                   471 SQLs
                                                 IMPLICATION – Opportunities are
                           25%                   nurtured across a broader qty of MCLs
                                  118 Deals      with more qualified leads coming
                                                 through to the sales reps.
Waterfall Exercise
                           Before             Future State

                      1,706,435 Engagements    Lead Sourcing
                                                 6,400,000
 .0665%
                                                                       2%
                          11,344 MCLs          128,051 MCLs
        13.5%                                                        3%

                         Unknown MQLs          3,842 MQLs
Conversion


                                                                 25%
Rates


                         Unknown SALs           960 SALs

                                                                49%
                           1,534 SQLs           471 SQLs
                28%
                                                               25%
                            434 Deals           118 Deals
12
Lead Generation =
Demand Generation + Lead Management
                              Lead Generation

 Demand
Generation


Sources
                                Lead Management Stages
 Webinars

             Awareness   Consideration     Engagement    Intent   Opportunity
  Email
Campaigns


  Direct
   Mail


   Web

               MCL           MQL              SAL         SQL
 Outbound
  Calling


  Events
                                         Exit Criteria
Further interest….
 Sign-up for a free lead generation consultation by:
     Going to http://www.salesbenchmarkindex.com/Lead-Generation-Webinar-Follow-Up
     Or e-mailing info@salesbenchmarkindex.com


Sales Benchmark Index will….
  Send a copy of presentation to you
  Additional questions can be sent directly to:
    Dan.Perry@salesbenchmarkindex.com


Join us for our next Webinar….
  Sales Resource Planning - What should next year's org chart look like?
     Thursday, October 13th , 2011
     1:00 p.m. Central
     30 minutes
     Register at www.salesbenchmarkindex.com


                                        Thank-You for attending…

B2b Lead Generation - Roadmap to Success

  • 1.
  • 2.
    Logistics for today’scall….  All attendee’s will be on “silent” mode during the presentation.  Please utilize the “Questions” feature to ask questions; simply type in your question and press enter.  At the conclusion of the presentation, the moderator will facilitate the “Question & Answer” session utilizing the “Questions” feature.
  • 3.
    Sales Benchmark Indexwill….  Send a copy of presentation to you  Additional questions can be sent directly to: Dan.Perry@salesbenchmarkindex.com Join us for our next Webinar….  Sales Resource Planning - What should next year's org chart look like?  Thursday, October 13th , 2011  1:00 p.m. Central  30 minutes  Register at www.salesbenchmarkindex.com
  • 4.
     Today’s Guest….. Dan Perry  Principal at SBI  Prior to SBI, held Executive Sales Leadership positions at Aramark, Corporate Express, Lavi Industries and 3 Day Blinds  Serves as adjunct professor at Pepperdine University for MBA program specializing in Sales Management
  • 5.
    Lead Generation Programs: The definition of a lead is determined by Buyer Personas.  We understand the # of leads generated, and their quality score, for each demand generation $ spent.  We have a defined process to move from an inquiry-lead-opportunity- customer.  We understand the volume required at each funnel stage to make the number.  We have made the switch from outbound to inbound marketing. Back
  • 6.
    Lead Generation = DemandGeneration + Lead Management Lead Generation Demand Generation Sources Lead Management Stages Webinars Awareness Consideration Engagement Intent Opportunity Email Campaigns Direct Mail Web MCL MQL SAL SQL Outbound Calling Events Exit Criteria
  • 7.
    Persona: Company Profileand Fit AWARENESS CONSIDERATION PREFERENCE PREFERENCE Focus Verticals and Employee Count: Manufacturing, Retail, Transportation, Professional Buyer Buyer Buyer & Financial Services (300 – 5000 employees) • Do I have a problem? • Can I ignore this? • How long will it take to get this Indicators of high likelihood of pain, strong fit • How does this problem relate to • Is there a quick fix? fixed? achieving my goals? • Can I fix it myself? • How much of our time do I need • Old legacy in-house ERP and T&A systems • How painful is the problem? • Do I need help? to put towards it? • In-house manual systems and processes • Who does the problem impact – • What are my choices if I need • How do I know the fix will work? • Hourly workforce that is decentralized, departments, users, employees, help? • How disruptive will it be? unionized, decision makers? • How should I evaluate • How much will it cost? • Growing/shrinking, leadership change, • What are my peers doing? alternatives? • What impact will it have? merger/acq • How will others on my • What happens if it doesn’t work? • Facing heavily regulation with govt customers purchasing committee evaluate Buying criteria: alternatives? • Increased productivity, Compliance, User I Want… I Cant… Key Messages experience, business case, systems integration, employee satisfaction • Receive advanced notification and • Ease of use solution for employees, • Increase employee engagement HR SVP/EVP (Most senior person) visibility to compliance issues limited training required resulting in higher satisfaction Responsibilities: Benefits, • Get visibility or access to historical • An early warning alert and • Ensure compliance with Payroll, recruiting, data to manage compliance issues historical view of compliance automated HR and pay policy compensation, performance • Identify root cause of performance challenges and issues enforcement that supports management and productivity issues. • ALL: Access to data that helps me workers and workplace Focus: HR compliance, employee • Maximize the productivity of my maximize return on employee • High user adoption, reduced engagement/culture, productivity, accountability workforce investment (Productive/Efficient) training and fewer errors with BIC Role in purchase: Always a key influencer and • ALL: Balance staffing • ALL: third party validation and user experience may be drive the evaluation. Evaluates employee requirements and employee proof of financial justification engagement, staffing levels, and compliance. schedule preference Operations COO • Get the reports I need to compare • Ease of use solution for employees, • Integrated solution resulting in profitability of plants/stores. limited training required improved accuracy (no re-key) Responsibilities: Delivers on • Identify root cause of performance • To reduce costs of managing my and speed (no latency) the promise of the organization and productivity issues. workforce • Decreases administrative time (product/service) • Maximize workforce productivity • Deliver highest quality at the Improve customer service and Focus: Optimal productivity and efficiency. • Receive advanced notification and lowest cost in shortest time product quality while reducing Seeking Quality, Cost savings and Speed. Process visibility to labor expense leakage • An early warning alert and costs by changing the way labor is driven to achieve customer satisfaction. • Model workforce changes and see historical view of compliance deployed and scheduled how they impact KPI’s challenges and issues • Cloud solution is scalable and Role in purchase: User Buyer, must work with the • Schedule the right people, right configurable, with an upgrade CFO to fund a WFM solution. place, right time path that is automated and no cost Finance CFO (delegates to Controller) • Get the reports I need to compare • To reduce costs of managing my • Self-funding investment, clear ROI Responsibilities: Delivers bottom profitability of plants/stores. workforce • Flexibility of solution to meet the line numbers for the organization. • Receive advanced notification and • To drive out costs and enable current and future needs of my Financial performance reporting, visibility to labor expense leakage incremental revenue generation evolving company forecasting revenue, budgeting and compliance issues • Better align corporate and cost control performance indicators with Focus: Financial performance and productivity. employee activities Always looking for ways to increase profitability. • Cloud solution is scalable and configurable, with an upgrade Role in purchase: Approver/Economic Buyer path that is automated and no cost
  • 8.
    Private Equity Firm– Top Metrics  Marketing Sourced Pipeline:  Percentage of Total Pipe that Marketing has created  Marketing Influenced Pipeline:  Percentage of Total Pipe that Marketing has touched during a set time period  Investment to Pipeline Ratio:  Dollars of Sales Pipeline sourced for every program dollar invested in Demand Creation  Investment to Revenue Ratio:  Dollars of Revenue sourced for every program dollar invested in Demand Generation  Investment to Influence Ratio:  Dollars of Sales Pipeline touched for every $1 invested in all marketing activities designed to influence opportunities
  • 9.
    Lead Generation WaterfallModel Demand Demand Generation – Lead Sourcing Generation (Inquiries) Marketing Captured Lead (MCL) Marketing Inquiry sent to CRM Marketing Qualified Lead (MQL) Lead Management Qualified by LDRs as match to ICP Sales Accepted Lead (SAL) Qualified by LDRs with BANT Sales Qualified Lead (SQL) Opportunity Created Opportunity Sales Management Won “Closed/Won”
  • 10.
    Waterfall Exercise –Before Annual Jan ‘10 – Jan ‘11 1,706,435 Engagements .0665% 13.5% 11,344 MCLs Assumptions • All marketing “leads” were Unknown MQLs identified at MCLs Conversion • All opportunities were identified as SQLs Rates Unknown SALs IMPLICATION – Many opportunities are 1,534 SQLs never developed with only low hanging 28% fruit freeing itself through the funnel 434 Deals 10
  • 11.
    Waterfall Exercise –Future State Lead Sourcing 6,400,000 2% 128,051 MCLs Assumptions 3% • Marketing contribution of Conversion Rates 25% of total $40m rev goal 3,842 MQLs – 118 deals x $85k = $10m 25% • Avg. sale $85k 960 SALs • Conversion rates of average b2b lead gen teams with 49% sound process 471 SQLs IMPLICATION – Opportunities are 25% nurtured across a broader qty of MCLs 118 Deals with more qualified leads coming through to the sales reps.
  • 12.
    Waterfall Exercise Before Future State 1,706,435 Engagements Lead Sourcing 6,400,000 .0665% 2% 11,344 MCLs 128,051 MCLs 13.5% 3% Unknown MQLs 3,842 MQLs Conversion 25% Rates Unknown SALs 960 SALs 49% 1,534 SQLs 471 SQLs 28% 25% 434 Deals 118 Deals 12
  • 13.
    Lead Generation = DemandGeneration + Lead Management Lead Generation Demand Generation Sources Lead Management Stages Webinars Awareness Consideration Engagement Intent Opportunity Email Campaigns Direct Mail Web MCL MQL SAL SQL Outbound Calling Events Exit Criteria
  • 15.
    Further interest…. Sign-upfor a free lead generation consultation by: Going to http://www.salesbenchmarkindex.com/Lead-Generation-Webinar-Follow-Up Or e-mailing info@salesbenchmarkindex.com Sales Benchmark Index will….  Send a copy of presentation to you  Additional questions can be sent directly to: Dan.Perry@salesbenchmarkindex.com Join us for our next Webinar….  Sales Resource Planning - What should next year's org chart look like?  Thursday, October 13th , 2011  1:00 p.m. Central  30 minutes  Register at www.salesbenchmarkindex.com Thank-You for attending…

Editor's Notes

  • #7 The slide helped Ceridian explain to Sales and Product Marketing how they were going to improve lead creation activity. First, they separated Lead Generation into its two key components -- Demand Generation and Lead Management. Each was optimized, managed and goaled differently, and measured separately. The result was the acceleration of Inquiry production, higher conversion rates, more effective lead source spending, and more Sales Qualified Leads to the sales force.
  • #8 This is an example of a Persona created for Ceridian to describe the Buying Journey of an Ideal Customer as they progress from Awareness to Consideration to PreferenceMarketing uses this document to create content matched to the appropriate stage in the Buyer’s JourneyLead Development Reps use this Persona document to nurture prospects and encourage them to move at their own pace from initial Awareness to the point where they are willing, even motivated, to speak with a Sales RepSales Reps use this Persona document to understand who their future customer is and what they care about
  • #9 Ceridian was owned by a private equity firm that established a series of performance measures for demand generation. Each metric captured a dimension of lead effectiveness (conversion rate to opportunities), lead efficiency (time/money/effort to manage leads in the pipeline), or lead production (volume of inquiries)
  • #10 In order to present the Lead Generation team with a visual metaphor on the steps to managing leads, they used this waterfall diagram. The top bucket describes the demand generation activity necessary to stimulate interest in the target population of prospects. This is where the marketing campaigns are conducted and the various forms of lead techniques (e.g. Google Adwords, e-mail, telemarketing, print media, etc..) are leveragedThe middle set of buckets describe the lead grading, scoring, nurturing, and management activity performed by a dedicated set of Lead Development Reps, who were located in one facility.The final two buckets at the bottom capture the activities of the field sales reps who were advancing sales Opportunities using the defined sales process. The end result of their activities was a new customer, a loss to the competition, or a return of a prospect to the lead nurturing since they were not ready to buy
  • #11 Ceridian had several problems with their Lead Generation function. Their marketing campaigns were not oriented to the Persona and did not measure lead source effectivenessThey measured what they called ‘Engagements’ which was similar to internet impressions, neither of which was an accurate reflection of Inquiries, which correspond more to potential Prospect interestThey used a telemarketing firm to conduct outbound direct dials that were then pushed straight to the sales force that complained, rightly, that vast majority of call leads were terribleThey had no defined Lead Management process so they were unable to know how to get from 1,534 SQLs to Inquiries
  • #12 Ceridian used this waterfall approach to determine how many Inquiries they needed to generate from the Demand Generation function to satisfy their need for new logo accounts. They accomplished this by first determining that they needed 118 net new customers in the coming fiscal year. From this the assumed their Opportunity Conversion rate would remain at 25% and so they would need 471 Sales Qualified Leads or SQLs. Then, going further up to the top of the funnel, they calculated the Conversion rate at each stage of the Lead Management process, finally arriving at the conclusion that the Marketing organization needed to generate 6.4 million Inquiries. This was over 10x what they had done up until that point. From this analysis the client set about improving their Marketing demand Generation capability
  • #13 Ceridian had several problems with their Lead Generation function. Their marketing campaigns were not oriented to the Persona and did not measure lead source effectivenessThey measured what they called ‘Engagements’ which was similar to internet impressions, neither of which was an accurate reflection of Inquiries, which correspond more to potential Prospect interestThey used a telemarketing firm to conduct outbound direct dials that were then pushed straight to the sales force that complained, rightly, that vast majority of call leads were terribleThey had no defined Lead Management process so they were unable to know how to get from 1,534 SQLs to Inquiries
  • #14 The slide helped Ceridian explain to Sales and Product Marketing how they were going to improve lead creation activity. First, they separated Lead Generation into its two key components -- Demand Generation and Lead Management. Each was optimized, managed and goaled differently, and measured separately. The result was the acceleration of Inquiry production, higher conversion rates, more effective lead source spending, and more Sales Qualified Leads to the sales force.