Major process related unknown impurity associated with the synthesis of Hydralazine hydrochloride bulk drug was detected by high performance liquid chromatography (HPLC) and was subjected to high resolution accurate liquid chromatography mass spectroscopy (HR/AM-LCMS) for identification. The proposed impurity was isolated from Hydralazine hydrochloride active pharmaceutical ingredient (API) by preparative chromatographic method and was injected on HPLC for comparison of retention time with that of the unknown process related impurity in Hydralazine hydrochloride. The molecular ion peak of preparatively isolated impurity and that of unknown process related impurity in Hydralazine hydrochloride were compared for confirmation. The postulated structure was unambiguously confirmed with the help of HR/AM- LC MS/MS, NMR and FTIR data proposed to be 1-(2-phthalazin-1-ylhydrazino)phthalazine (Hazh Dimer). This impurity of Hydralazine hydrochloride is not been previously reported. A rapid Acquity H-class gradient method with runtime of 15.0min was developed for Quantitation on Unisphere Cyno column and validated for parameters such as accuracy, precision, linearity and range, robustness. The LOD and LOQ of method were 0081% and 0.0246% respectively.
HPLC: Principle and Maintenance with Applicationijtsrd
High performance liquid chromatography (HPLC) is a significant qualitative and quantitative technique, usually used for the estimation of pharmaceutical and biological samples. The chromatography term is derived from the Greek words namely chroma (colour) and graphein (to write). The chromatography is very accepted technique and it is mostly used analytically. It is the most resourceful, safest, reliable and fastest chromatographic technique for the quality control of drug components. This technique involves 2 phases"™ stationary and mobile phases. There are different types of chromatographic techniques. The separation of constituents is based on the variation between the partition coefficients of the two phases. This article is primed with an aim to review different aspects of HPLC, such as principle, types, instrumentation and application with maintenance. Yogesh Kumar | Sayed Md Mumtaz | Mustaq Ahmad"HPLC: Principle and Maintenance with Application" Published in International Journal of Trend in Scientific Research and Development (ijtsrd), ISSN: 2456-6470, Volume-2 | Issue-5 , August 2018, URL: http://www.ijtsrd.com/papers/ijtsrd17134.pdf http://www.ijtsrd.com/pharmacy/pharmacology-/17134/hplc-principle-and-maintenance-with-application/yogesh-kumar
This Powerpoint presentation helps us to know the basic working principles, instrumentation an advantage of super critical fluid chromatography.
Contact Details:
Anbu Dinesh Jayakumar
M.Pharmacy ( Pharmaceutical Chemistry)
Sri Ramakrishna Institute of Paramedical Sciences, Coimbatore
Mobile : 8838404664 / 8608890121( Whatsapp)
Email: anbudinesh007@gmail.com
Thin-layer chromatography (TLC) is a chromatography technique used to separate non-volatile mixtures.[1] Thin-layer chromatography is performed on a sheet of glass, plastic, or aluminium foil, which is coated with a thin layer of adsorbent material, usually silica gel, aluminium oxide (alumina), or cellulose. This layer of adsorbent is known as the stationary phase.
After the sample has been applied on the plate, a solvent or solvent mixture (known as the mobile phase) is drawn up the plate via capillary action. Because different analytes ascend the TLC plate at different rates, separation is achieved.[2] The mobile phase has different properties from the stationary phase. For example, with silica gel, a very polar substance, non-polar mobile phases such as heptane are used. The mobile phase may be a mixture, allowing chemists to fine-tune the bulk properties of the mobile phase.
After the experiment, the spots are visualized. Often this can be done simply by projecting ultraviolet light onto the sheet; the sheets are treated with a phosphor, and dark spots appear on the sheet where compounds absorb the light impinging on a certain area. Chemical processes can also be used to visualize spots; anisaldehyde, for example, forms colored adducts with many compounds, and sulfuric acid will char most organic compounds, leaving a dark spot on the sheet.
To quantify the results, the distance traveled by the substance being considered is divided by the total distance traveled by the mobile phase. (The mobile phase must not be allowed to reach the end of the stationary phase.) This ratio is called the retention factor or Rf. In general,a substance whose structure resembles the stationary phase will have low Rf, while one that has a similar structure to the mobile phase will have high retention factor. Retention factors are characteristic, but will change depending on the exact condition of the mobile and stationary phase. For this reason, chemists usually apply a sample of a known compound to the sheet before running the experiment.
Thin-layer chromatography can be used to monitor the progress of a reaction, identify compounds present in a given mixture, and determine the purity of a substance. Specific examples of these applications include: analyzing ceramides and fatty acids, detection of pesticides or insecticides in food and water, analyzing the dye composition of fibers in forensics, assaying the radiochemical purity of radiopharmaceuticals, or identification of medicinal plants and their constituents [3]
A number of enhancements can be made to the original method to automate the different steps, to increase the resolution achieved with TLC and to allow more accurate quantitative analysis. This method is referred to as HPTLC, or "high-performance TLC". HPTLC typically uses thinner layers of stationary phase and smaller sample volumes, thus reducing the loss of resolution due to diffusion.
HPLC- high performance liquid chromatographyhirenthakkar4
HPLC- high performance liquid chromatography or high pressure liquid chromatography overall review
good animation & GIF for presentation
detectors in detail
basic instrumentation with detectors
HPLC- introduction, principle, types, working, instrumentation and operations of HPLC has been included with appropriate gifs and images for better understanding. What are all the things need to be known by a science student about HPLC (basics and working) is clearly given in this presentation.
Ion pair chromatography for pharmacy studentsabhishek rai
Ion-PairChromatography
A GENERALISED OVERVIEW
Chromatography
HPLC
Reverse Phase Chromatography
Ion Pair Chromatography
Ion Pair Reagent
Mechanism of Ion Pair Chromatography
Ion Pair Wash Procedure
Discussion on photolysis, Norrish rearrangement, photolysis of azo compounds, isomerization and rearrangement, Fries rearrangement, chemiluminescence and bioluminescence
HPLC
Chromatography
Mobile Phase & Stationary Phase
CLASSIFICATION OF CHROMATOGRAPHY
Characteristics of HPLC
Purpose
Superiority of HPLC
TYPES OF HPLC TECHNIQYES
Principle
PHASING SYSTEM & (normal vs reversed phase)
INSTRUMENTATION
Flow diagram of HPLC instrument
Advantages of HPLC
Counter current chromatography (CCC) is a liquid chromatography technique that
uses two immiscible liquid phases and no solid support.
2. One liquid acts as the stationary phase and the other as the mobile phase.
3. In Dual Flow CCC/CPC both liquid phases are flowing, as would be common in counter
current process extractors.
4. The liquid stationary phase(s) is held in place by gravity or by centrifugal force. The
gravity method is called droplet counter current chromatography (DCCC).
5. There are two modes of centrifugal force CCC: hydrostatic and hydrodynamic. In the
hydrostatic method.
6. The column is spun about
Effect of Poling Field and Non-linearity in Quantum Breathers in FerroelectricsIOSR Journals
Abstract : Lithium tantalate is technologically one of the most important ferroelectric materials with a low poling field that has several applications in the field of photonics and memory switching devices. In a Hamiltonian system, such as dipolar system, the polarization behavior of such ferroelectrics can be well-modeled by Klein-Gordon (K-G) equation. To probe the quantum states related to discrete breathers, the same K-G lattice is quantized to give rise to quantum breathers (QBs) that are explained by a periodic boundary condition. The gap between the localized and delocalized phonon-band is a function of impurity content that is again related to the effect of pinning of domains due to antisite tantalum defects in the system, i.e. a point of easier switching within the limited amount of data on poling field.
Fluorescence technique involves the optical detection and spectral analysis of light emitted by a substance undergoing a transition from an excited electronic state to a lower electronic state. The aim of this study is to assess the -amino levulinic acid (-ALA) uptake. Based on image processing technique, Matlab was used to analyze the fluorescence images resulted from activation of (-ALA) and follow its uptake along one week. Analyzing the RGB colours pixel profile from obtained results showed different profiles for malignant tissues, normal tissues, treated just after PDT and finally at one week post PDT. The treated tissues fluorescence profile showed changes from closer to malignant tissue profile till been closed to normal one.
Public Expenditure on Education; A Measure for Promoting Economic DevelopmentIOSR Journals
The rational utilization and allocation of public expenditure would result into an economic development of the country. It has been observed that allocation and utilization of expenditure in Pakistan have been very little towards development. The allocation of current expenditure such as debt servicing and defense has increased by a greater percentage every year as compared to education. Money borrowed by the economy over the years, if had been put to the development of projects, the economy would have seen much higher development and growth. The objective of the research lies in evaluating the public expenditure and its role in economic development by considering education as an indicator to social development in Pakistan.
Effect of Fly Ash Particles on the Mechanical Properties of Zn-22%Al Alloy vi...IOSR Journals
In the present investigation, a Zn-22%Al alloy is used as the matrix material and fly ash as the filler material. The composite is produced using powder metallurgy techniques. The fly ash is added in 2%, 4%, and 6% by wt% to the sintering metal. The composite is tested for hardness, density and tensile strength test. Microstructure examination is done using a high resolution optical microscope to obtain the distribution of fly ash in the Zn-Al matrix. Test results indicate that as fly ash content is increased, there is a considerable increase in hardness and tensile strength but decrease in density.
Determination of baseline Widal titre among apparently healthy population in ...IOSR Journals
Present study was conducted to determine the baseline widal titer of healthy population of Dehradun city. A total of 300 serum samples were collected from healthy individual with no history of fever and who had not received any vaccination for enteric fever. Tube agglutination test was done with commercially available antigens which contained the Salmonella enterica serovar typhi O and H antigens, the Salmonella enterica serovar paratyphi AH antigen and paratyphi BH antigen. In the present study an agglutination titer for TO – 1:20 is 28%, for 1:40 is 24%, followed by 1:80 and 1: 160 which is 10%, 4% respectively. The highest sample with an anti-H titre found with 1:20 (22%) followed by 1:40(17%). Based upon the results of the study it has been recommended that a single Widal can be significant in an endemic region when higher titre (1:160) is obtained.
Effect of Annealing and Time of Crystallization on Structural and Optical Pro...IOSR Journals
In this report pure poly(vinylidene fluoride) (PVDF) films were prepared by casting method using acetone solvent. The crystallization of both α and β phase from acetone solvent by varying the time of crystallization has been described. This paper also describes the enhancement of β phase at different annealing condition. β phase dominant thin films were obtained when as cast thin films were annealed at 90 ºC for 5 hours. The PVDF films with dominant α-phase were obtained, when time of crystallization is extend. From (X-ray diffraction) XRD and Fourier Transform Infrared Spectrum (FTIR) it is confirmed that the PVDF thin films, cast from acetone solution and annealed at 90 ºC for 5 hours, have maximum percentage of β-phase. Presence of the crystalline α and β phases in each sample was confirmed by X-ray Diffraction (XRD) and Fourier transform infrared spectroscopy (FTIR). We found that of PVDF when crystallized from its acetone solutions led to the formation of β phase. UV-visible optical absorption analysis revealed a change in the optical gap and shift in absorption edge with annealing temperature.
The Paper Entitle “Aisha Email System” deals with identifying the clients to send and receive mail
with the same login. This utility will allow multiple clients to login under the same login name and still have
personalized mail information, enabling them to send and receive mails. Each user willing to avail the services
offered by the mail server application should exist as a user before he can send or receive mails. This is made
possible by prompting each user to enter his user-id and password before he can send or view his mails. This
Paper has Inbox, compose and address list. E-mail is one of the most common and reliable methods of
communication for both personal and business purposes. It also plays an important role in each and every Web
site. This role will be in the type of automated e-mails from the server after posting information from a form.
The Paper has been planned to be having the view of distributed architecture, with centralized storage
of the database. The application for the storage of the data has been planned. Using the constructs of MS-SQL
Server and all the user interfaces have been designed using the ASP.Net technologies. The database connectivity
is planned using the “SQL Connection” methodology. The standards of security and data protective mechanism
have been given a big choice for proper usage. The application takes care of different modules and their
associated reports, which are produced as per the applicable strategies and standards that are put forwarded
by the administrative staff.
The entire Paper has been developed keeping in view of the distributed client server computing
technology, in mind. The specification has been normalized up to 3NF to eliminate all the anomalies that may
arise due to the database transaction that are executed by the general users and the organizational
administration. The user interfaces are browser specific to give distributed accessibility for the overall system.
The internal database has been selected as MS-SQL server 200.The basic constructs of table spaces, clusters
and indexes have been exploited to provide higher consistency and reliability for the data storage.
The MS-SQL server 200 was a choice as it provides the constructs of high-level reliability and
security. The total front end was dominated using the ASP.Net technologies. At all proper levels high care was
taken to check that the system manages the data consistency with proper business rules or validations. The
database connectivity was planned using the latest “SQL Connection” technology provided by Microsoft
Corporation. The authentication and authorization was crosschecked at all the relevant stages. The user level
accessibility has been restricted into two zones namely.
Numerical solution of heat equation through double interpolationIOSR Journals
In this article an attempt is made to find the solution of one-dimensional Heat equation with initial and boundary conditions using the techniques of numerical methods, and the finite differences. Applying Bender-Schmidt recurrence relation formula we found u(x ,t) values at lattice points. Further using the double interpolation we found the solution of Heat equation as double interpolating polynomial
Structure and transport coefficients of liquid Argon and neon using molecular...IOSR Journals
Molecular dynamics simulation was employed to deduce the dynamics property distribution function of Argon
and Neon liquid. With the use of a Lennnard-Jones pair potential model, an inter-atomic interaction function was observed
between pair of particles in a system of many particles, which indicates that the pair distribution function determines the
structures of liquid Argon. This distribution effect regarding the liquid structure of Lennard-Jones potential was strongly
affected such that its viscosity depends on density distribution of the model. The radial distribution function, g(r) agrees well
with the experimental data used. Our results regarding Argon and Neon show that their signatures are quite different at
each temperature, such that their corresponding viscosity is not consistent. Two sharps turning points are more
prominent in Argon, one at temperature of 83.88 Kelvin (K) with viscosity of -0.548 Pascal second (Pa-s) and the
other at temperature of 215.64 K with viscosity of -0.228 Pa-s.
In Argon and Neon liquid, temperature and density are inversely and directly proportional to diffusion
coefficient, in that order. This characteristic suggests that the observed non linearity could result from the non
uniform thermal expansion in liquid Argon and Neon, which are between the temperature range of 21.98 K and
239.52 K.
Micellar Effect On Dephosphorylation Of Bis-4-Chloro-3,5-Dimethylphenylphosph...IOSR Journals
The rate enhancement depends on the hydrophobicity of the nucleophile. The micellar catalyzed reaction between bis-4-chloro-3,5-dimethylphenylphosphate ester and hydroxide or hydroperoxide anions has been examined in buffered medium (pH 8-10). First order rate constant (Kψ) for the reaction of hydroxide ion with bis-4-CDMPP go through maxima with the increasing concentration of cetyltrimethylammoniumbromide (CTABr). Micelles of CTABr very effective catalyst to the reactions of phosphate diesters. Rate constants measured with OH2- ions are approximately twice and thrice than that of OH- ions in presence of CTABr.
AM Fungal Status in Ketaka: Pandanus fascicularis From Coastal Region of Konk...IOSR Journals
Present paper deals with assessment of Arbuscular mycorrhizal fungi (AM) associated with different populations of Pandanus fascicularis found in coastal region of Konkan Maharashtra. All samples of P. fascicularis roots were colonized by AM fungi. The mean percentage of root length colonization ranged from 39% to 74%. Amongst the thirteen AM fungal morphospecies Kuklospora colombiana was the most widely distributed species. Species richness of AM fungi ranged from 3 to 6. Based on spore density and relative abundance, three species were dominant viz., Acaulospora bireticulata, A. scrobiculata, and K. colombiana. Details of AM fungal status in P. fascicularis are discussed in present paper.
Similar to Structural elucidation, Identification, quantization of process related impurity in Hydralazine Hydrochloride HR/AM- LC MS/MS, NMR and FTIR technique
International Journal of Pharmaceutical Science Invention (IJPSI) is an international journal intended for professionals and researchers in all fields of Pahrmaceutical Science. IJPSI publishes research articles and reviews within the whole field Pharmacy and Pharmaceutical Science, new teaching methods, assessment, validation and the impact of new technologies and it will continue to provide information on the latest trends and developments in this ever-expanding subject. The publications of papers are selected through double peer reviewed to ensure originality, relevance, and readability. The articles published in our journal can be accessed online.
Quality-by-design-based development and validation of a stability-indicating ...Ratnakaram Venkata Nadh
A systematic design-of-experiments was performed by applying quality-by-design concepts to determine
design space for rapid quantification of teriflunomide by the ultraperformance liquid chromatography
(UPLC) method in the presence of degradation products. Response surface and central composite
quadratic were used for statistical evaluation of experimental data using a Design-Expert software. The
response variables such as resolution, retention time, and peak tailing were analyzed statistically for the
screening of suitable chromatographic conditions. During this process, various plots such as perturbation,
contour, 3D, and design space were studied. The method was developed through UPLC BEH C18
2.1 � 100 mm, 1.7-μ column, mobile phase comprised of buffer (5 mM K2HPO4 containing 0.1%
triethylamine, pH 6.8), and acetonitrile (40:60 v/v), the flow rate of 0.5 mL min 1 and UV detection at
250 nm. The method was developed with a short run time of 1 min. Forced degradation studies revealed
that the method was stability-indicating, suitable for both assay and in-vitro dissolution of a drug product.
The method was found to be linear in the range of 28–84 μg mL 1, 2.8–22.7 μg mL 1 with a correlation
coefficient of 0.9999 and 1.000 for assay and dissolution, respectively. The recovery values were found in
the range of 100.1–101.7%. The method was validated according to ICH guidelines.
The IOSR Journal of Pharmacy (IOSRPHR) is an open access online & offline peer reviewed international journal, which publishes innovative research papers, reviews, mini-reviews, short communications and notes dealing with Pharmaceutical Sciences( Pharmaceutical Technology, Pharmaceutics, Biopharmaceutics, Pharmacokinetics, Pharmaceutical/Medicinal Chemistry, Computational Chemistry and Molecular Drug Design, Pharmacognosy & Phytochemistry, Pharmacology, Pharmaceutical Analysis, Pharmacy Practice, Clinical and Hospital Pharmacy, Cell Biology, Genomics and Proteomics, Pharmacogenomics, Bioinformatics and Biotechnology of Pharmaceutical Interest........more details on Aim & Scope).
Application of Validated High-performance Liquid Chromatography Method for De...BRNSS Publication Hub
A novel and simple reversed-phase liquid chromatographic method has been established for the determination of saxagliptin and metformin HCl Saxagliptin and metformin HCl is used to control Type 2 diabetes. The proposed work was performed on Young Lin (S.K) isocratic System UV Detector. Saxagliptin and metformin HCl is used to control Type 2 diabetes. The proposed work was performed on Young Lin (S.K) isocratic System UV Detector C18 column (150 mm × 4.6 mm). A mixture of potassium phosphate, mobile phase in this method with flow rate of 0.7 mL/min (UV detection at 203 nm) and the method was validated as per the ICH guidelines. Forced degradation studies were performed by exposing the drug saxagliptin and metformin HCl to acidic, alkaline, oxidation, and thermal stress degradations. The proposed reversed-phase-high-performance liquid chromatography method was found to be robust and specific, and this method is suitable for the assay of pharmaceutical dosage forms as well as kinetic studies.
Similar to Structural elucidation, Identification, quantization of process related impurity in Hydralazine Hydrochloride HR/AM- LC MS/MS, NMR and FTIR technique (20)
Comparing Evolved Extractive Text Summary Scores of Bidirectional Encoder Rep...University of Maribor
Slides from:
11th International Conference on Electrical, Electronics and Computer Engineering (IcETRAN), Niš, 3-6 June 2024
Track: Artificial Intelligence
https://www.etran.rs/2024/en/home-english/
Toxic effects of heavy metals : Lead and Arsenicsanjana502982
Heavy metals are naturally occuring metallic chemical elements that have relatively high density, and are toxic at even low concentrations. All toxic metals are termed as heavy metals irrespective of their atomic mass and density, eg. arsenic, lead, mercury, cadmium, thallium, chromium, etc.
Nutraceutical market, scope and growth: Herbal drug technologyLokesh Patil
As consumer awareness of health and wellness rises, the nutraceutical market—which includes goods like functional meals, drinks, and dietary supplements that provide health advantages beyond basic nutrition—is growing significantly. As healthcare expenses rise, the population ages, and people want natural and preventative health solutions more and more, this industry is increasing quickly. Further driving market expansion are product formulation innovations and the use of cutting-edge technology for customized nutrition. With its worldwide reach, the nutraceutical industry is expected to keep growing and provide significant chances for research and investment in a number of categories, including vitamins, minerals, probiotics, and herbal supplements.
This presentation explores a brief idea about the structural and functional attributes of nucleotides, the structure and function of genetic materials along with the impact of UV rays and pH upon them.
Observation of Io’s Resurfacing via Plume Deposition Using Ground-based Adapt...Sérgio Sacani
Since volcanic activity was first discovered on Io from Voyager images in 1979, changes
on Io’s surface have been monitored from both spacecraft and ground-based telescopes.
Here, we present the highest spatial resolution images of Io ever obtained from a groundbased telescope. These images, acquired by the SHARK-VIS instrument on the Large
Binocular Telescope, show evidence of a major resurfacing event on Io’s trailing hemisphere. When compared to the most recent spacecraft images, the SHARK-VIS images
show that a plume deposit from a powerful eruption at Pillan Patera has covered part
of the long-lived Pele plume deposit. Although this type of resurfacing event may be common on Io, few have been detected due to the rarity of spacecraft visits and the previously low spatial resolution available from Earth-based telescopes. The SHARK-VIS instrument ushers in a new era of high resolution imaging of Io’s surface using adaptive
optics at visible wavelengths.
The ability to recreate computational results with minimal effort and actionable metrics provides a solid foundation for scientific research and software development. When people can replicate an analysis at the touch of a button using open-source software, open data, and methods to assess and compare proposals, it significantly eases verification of results, engagement with a diverse range of contributors, and progress. However, we have yet to fully achieve this; there are still many sociotechnical frictions.
Inspired by David Donoho's vision, this talk aims to revisit the three crucial pillars of frictionless reproducibility (data sharing, code sharing, and competitive challenges) with the perspective of deep software variability.
Our observation is that multiple layers — hardware, operating systems, third-party libraries, software versions, input data, compile-time options, and parameters — are subject to variability that exacerbates frictions but is also essential for achieving robust, generalizable results and fostering innovation. I will first review the literature, providing evidence of how the complex variability interactions across these layers affect qualitative and quantitative software properties, thereby complicating the reproduction and replication of scientific studies in various fields.
I will then present some software engineering and AI techniques that can support the strategic exploration of variability spaces. These include the use of abstractions and models (e.g., feature models), sampling strategies (e.g., uniform, random), cost-effective measurements (e.g., incremental build of software configurations), and dimensionality reduction methods (e.g., transfer learning, feature selection, software debloating).
I will finally argue that deep variability is both the problem and solution of frictionless reproducibility, calling the software science community to develop new methods and tools to manage variability and foster reproducibility in software systems.
Exposé invité Journées Nationales du GDR GPL 2024
What is greenhouse gasses and how many gasses are there to affect the Earth.moosaasad1975
What are greenhouse gasses how they affect the earth and its environment what is the future of the environment and earth how the weather and the climate effects.
What is greenhouse gasses and how many gasses are there to affect the Earth.
Structural elucidation, Identification, quantization of process related impurity in Hydralazine Hydrochloride HR/AM- LC MS/MS, NMR and FTIR technique
1. IOSR Journal of Applied Chemistry (IOSR-JAC)
e-ISSN: 2278-5736.Volume 6, Issue 2 (Nov. – Dec. 2013), PP 05-15
www.iosrjournals.org
www.iosrjournals.org 5 | Page
Structural elucidation, Identification, quantization of process
related impurity in Hydralazine Hydrochloride HR/AM- LC
MS/MS, NMR and FTIR technique
Manohar V. Lokhande 1,
Nitin G. Rathod 2,3
Mukesh Kumar Gupta2,3
1
Department of Chemistry, Sathaye College, Vileparle (E), Mumbai-400057, Maharashtra, India
2
Department of Chemistry, Shri Jagdish Prasad Jhabarmal Tibrewala University, Vidya Nagari, Jhunjhunu,
Chudela-333001, India
3
IPCA Laboratories Ltd., Chemical Research Division, Kandivli Industrial Estate, Kandivli (W), Mumbai-
400102, Maharashtra India
Corresponding authors Email:manohar2210@gmail.com
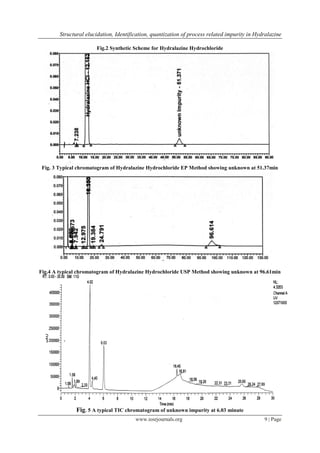
Abstract: Major process related unknown impurity associated with the synthesis of Hydralazine hydrochloride
bulk drug was detected by high performance liquid chromatography (HPLC) and was subjected to high
resolution accurate liquid chromatography mass spectroscopy (HR/AM-LCMS) for identification. The proposed
impurity was isolated from Hydralazine hydrochloride active pharmaceutical ingredient (API) by preparative
chromatographic method and was injected on HPLC for comparison of retention time with that of the unknown
process related impurity in Hydralazine hydrochloride. The molecular ion peak of preparatively isolated
impurity and that of unknown process related impurity in Hydralazine hydrochloride were compared for
confirmation. The postulated structure was unambiguously confirmed with the help of HR/AM- LC MS/MS,
NMR and FTIR data proposed to be 1-(2-phthalazin-1-ylhydrazino)phthalazine (Hazh Dimer). This impurity of
Hydralazine hydrochloride is not been previously reported. A rapid Acquity H-class gradient method with
runtime of 15.0min was developed for Quantitation on Unisphere Cyno column and validated for parameters
such as accuracy, precision, linearity and range, robustness. The LOD and LOQ of method were 0081% and
0.0246% respectively.
Keywords: Acquity UPLC H-class, FTIR, Hydralazine hydrochloride, , HPLC, , HR/AM-LCMS, NMR, ,
structural elucidation
I. Introduction
Hydralazine hydrochloride (1(2H)-phthalazinone:1-Hydrazinophthalazine hydrochloride) [1] (fig.1), is
a direct acting vasodilator which reduces blood pressure and peripheral resistance. It is used in the management
of hypertension, usually in doses below 100mg daily by mouth, since higher doses are associated with an
increased incidence of lupus erythematosus. It has also been given intravenously in the treatment of
hypersensitive crises [2]. Hydralazine is usually used in combination with other drugs. In recent years, it has
been found to be especially useful when used with beta-adrenergic blocking agents and diuretics [3].
The analytical methods on impurity detection and identification are reported in some literatures and these
literatures were screened for the presence of impurities in Hydralazine hydrochloride drug. Hydralazine
hydrochloride is a Pharmacopoeia product [4-7], synthetically prepared (fig.2) and was injected on HPLC
method from EP and USP, a late eluting unknown impurity peak at retention time 51.0min (fig.3) and 96.6min
(fig.4) in chromatogram was observed during analysis respectively [4][5]. We have screened the literatures for
impurities, which were produced form different synthetic process and found that this unknown impurity was not
reported in any of the synthetic process related to Hydralazine hydrochloride active pharmaceutical ingredient
(API) [8][9][10].
The impurity profile of the drug substance is critical for its safety assessment and manufacturing
process. It is mandatory to identify and characterize the impurities in pharmaceutical product, if present above
the accepted limit of 0.10% [11]. In this present article complete characterization of this unknown impurity was
done using HR/AM-LCMS/MS, NMR, IR and rapid Acquity UPLC H-class instrument method is developed for
Quantitation of this unknown impurity. However, so far there is no published report, describing the complete
characterization and Quantitation of this unknown process related impurity in Hydralazine hydrochloride API.
During process development studies, impurities were detected in both crude and pure samples of
Hydralazine hydrochloride using a newly developed gradient reversed phase Acquity UPLC H-class method
developed for rapid analysis for Quantitation of process related unknown impurity. A comprehensive study was
undertaken for the identification of this impurity using HR/AM-LCMS/MS followed by isolation and further
2. Structural elucidation, Identification, quantization of process related impurity in Hydralazine
www.iosrjournals.org 6 | Page
characterization by NMR and FTIR technique. This article also describes the analytical method validation by
using Acquity H-class for quantitative determination of this unknown impurity.
II. Experimental
2.1 Materials and reagents: Samples of Hydralazine hydrochloride API were obtained from Ipca Laboratories
Ltd., HPLC grade acetonitrile, Methanol and Sulphuric acid were purchased from Merck India, Sodium lauryl
Sulphate was purchased from Sigma Aldrich life science USA and tetra butyl ammonium bromide was
purchased from Loba Chemie Mumbai India. HPLC grade water was taken from Millipore India. Dimethyl
sulphoxide—d6 (for NMR) were purchased from Aldrich Chemical Co., USA.
2.2 Liquid chromatography: Samples were analyzed on Acquity H-class (Waters, Milford, MA, USA) LC
system equipped with Photo diode array (PDA) detector. A Cayno Unisphere column (50 mm x 2.1 mm i.d. 2.5
μm) was used for chromatographic separation. The mobile phase consisting of A: 1.4gm of sodium lauryl
sulphate and 0.75gm of tetra butyl ammonium bromide was dissolved in 1000mL of water and pH was adjusted
with 0.10N Sulphuric acid and mobile phase B: acetonitrile, with timed gradient programme Tmin/A:B: T0/80:20;
T4/80:20; T7/60:40; T8/60:40; T12/80:20 and T15/80:20 with flow rate of 0.6 ml per minute was used. The column
oven temperature was maintained at 35°C. The injection volume was 3.0µL and the detector wavelength was
fixed at 230 nm.
2.3 Liquid chromatography-high resolution accurate mass spectroscopy (LC-HR/AM-MS): The HR/AM-
LCMS/MS and MS/MS studies were performed on Q-Exactive Orbit trap mass spectrometer (Thermo Fisher
Scientific Inc. Waltham, Massachusetts United States). HESI (Heated electron spray ionization) source was used
for ionization. The spray voltage was maintained at 4.0 kV, Auxiliary gas flow rate was kept at 10 and capillary
temperature at 320°C. Nitrogen was used as both sheath and auxiliary gas. Heater temperature was kept at
350°C and S-lens RF level at 55. The mass to charge ratio (m/z) was scanned across the range from 50 to 750
amu at a resolution of 70,000 with positive ion polarity. MS/MS studies were carried out by keeping normalized
collision energy of (Higher-energy collision dissociation) HCD at 40eV and an isolation width of 6amu. The
HPLC consisted of an Agilent-1100 series quaternary gradient pump with a degasser, an auto sampler and
column oven. A C18 column (Kromasil C18 column 150 mm x 4.6 mm i.d. 5 μm) was used for separation. The
mobile phase consisting of A: Water and B: acetonitrile, with timed gradient programme Tmin/A:B: T0/50:50;
T10/50:50; T15/5:95; T25/5:95; T30/50:50;T35/50:50 with flow rate of 1.0 ml per minute was used.
2.4 NMR spectroscopy:1
H, 13
C NMR and DEPT measurement of the isolated impurities were performed on
AVANCE 400 (Bruker, Fallanden, Switzerland) instrument. The 1
H and 13
C chemical shift values were reported
on the δ scale (ppm) relative to DMSO.
2.5 FTIR spectroscopy: The FTIR spectrum of isolated impurity was recorded in the solid state as KBr powder
dispersion using (Perkin-Elmer, Beaconsfield, UK) spectrum one FT-IR spectrometer.
2.6 Preparative liquid chromatography: Impurity was isolated from the crude sample using Waters Auto
purification system consisting of 2525 binary gradient pump, a 2487UV detector and 2767sample manager
(Waters, Milford MA, USA). A Kromasil C18 column (150mm × 21mm i.d., particle size 5μm) was used for the
separation. The mobile phase was consisted of a mixture of water and acetonitrile in the ratio of 50:50 and was
pumped at flow rate 25 ml/min. The detection was monitored at 230 nm.
2.7 Preparation of solutions for validation of Acquity UPLC H-class method: A test preparation of
1000ppm of Hydralazine hydrochloride bulk drug sample was prepared using diluents (mobile phase A 80:
mobile phase B 20). A stock solution of Hazh Dimer was prepared by dissolving 0.05mg/mL (50ppm). From
this stock solution a standard solution containing 0.001mg/mL (1.0ppm) was prepared. System suitability
solution was prepared by mixing Hydralazine hydrochloride and Hazh Dimer to give concentration of 10ppm
each. For LOD LOQ and linearity study concentrations ranging from 1.50ppm to 0.050ppm of nine levels were
prepared. For precision study 1.0ppm of Hazh Dimer solution was used. For accuracy study LOQ to 120% Hazh
Dimer was spiked in 1000ppm Hydralazine hydrochloride.
III. Results And Discussion
3.1 Detection of impurity by HPLC: During the analysis of Hydralazine hydrochloride API using
Pharmacopeia chromatographic purity method / related substances method a late eluting impurity was found,
when chromatographic run time was increased to, approximately five fold to principal peak retention time. This
method was not suitable to quantify this late eluting impurity since the peak area, sensitivity of 1000ppm
3. Structural elucidation, Identification, quantization of process related impurity in Hydralazine
www.iosrjournals.org 7 | Page
solution of Hydralazine hydrochloride containing unknown impurity was too low to quantitative and also the
runtime was high.
Further detection and confirmation was done to trace the impurity by HPLC, by injecting the crude
Hydralazine Hydrochloride to check if this impurity was coming from crude Hydralazine hydrochloride. It was
observed that this unknown impurity is process related impurity and was present in crude sample and even after
purification it remains in pure Hydralazine Hydrochloride API (fig. 3 and 4).
3.2 Identification of impurities by HR/AM-LCMS/MS: HR/AM-LCMS and MS/MS were performed as per
the method described in the section 2.3 to generate the mass data for the impurity. The impurity of interest was
eluted at retention time 6.0min (fig. 5) which exhibits a protonated molecular ion peak [M+H]+
289.
The impurity was isolated as described in section 2.6 and this impurity was analyzed by High
resolution accurate mass spectrometry giving [M+H]+
289.11963 and MS/MS of 272.09298 (fig.6). The
theoretical atomic formula probability was shown by Xcalibur software for 289.11963 were C16H13N6. PPM
error was calculated using formula [12]:
Error in ppm for Molecular ion = Theoretical value – Actual Value x 106
Theoretical Value
=289.12017-289.11963 x 10⁶
289.12017
=1.87ppm
1.87ppm error is highly acceptable for characterization of [M+H]+
of unknown structure using HR/AM- LCMS.
Error in ppm for MS/MS = Theoretical value – Actual Value x 106
Theoretical Value
=272.09307-272.09298 x 10⁶
272.09307
=3.3ppm
3.3 ppm error is highly acceptable for characterization of unknown structure using HR/AM- LCMS/MS.
Though the mass error was low it was mandatory to confirm the structure by NMR. Hence NMR of
impurity and the product was carried out for comparison and further confirmation of structure.
3.3 Brief synthetic preparation of Hydralazine Hydrochloride:Phthalazin-1(2H)-one when treated with
POCl3 at 75°C-85°C in the presence of 2-ethoxy ethanol and toluene gives rise to 1-chlorophtalazine, this
reaction takes place by intramolecular chlorination by Vilsmeir Hack reaction [13]. The solvent is distilled
under vacuum and the product containing 1-chlorophtalazine is reacted with hydrazine hydrate and 2-ethoxy
ethanol at 65°C to 70°C for 2hrs, 15% HCl is added to give wet crude Hydralazine hydrochloride. This crude
Hydralazine hydrochloride is purified with charcoal, EDTA and methanol to give Hydralazine hydrochloride
pure API refer (fig 2.).
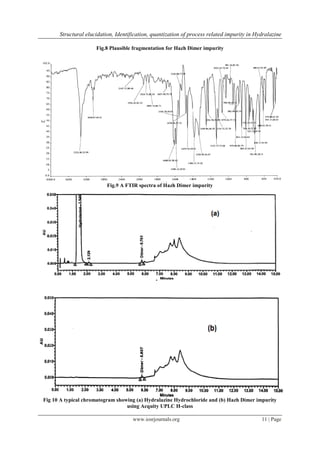
3.4 Isolation and structural confirmation of unknown impurity by NMR and FTIR : During the synthesis
of Hydralazine hydrochloride the unknown impurity formed was isolated using preparative chromatography
described in section 2.6. The chromatographic purity was checked and found to be 99% (fig.7). 1
H and 13
C
NMR spectral data (refer table no.1) confirmed the proposed structure. The MS/MS spectrum obtained for
isolated compound of impurity using direct infusion mode was exactly same as MS/MS spectrum of 1-(2-
phthalazin-1-ylhydrazino) phthalazine the plausible mass fragmentation is given in (fig.8). The infrared
spectrum of Hazh Dimer was scanned from 400 to 4000cm-1
some of the absorption bands assigned are 3332
cm-
1for N-H stretch secondary amine, 1590 for C=C stretch and CH-N for aromatic tertiary amine (fig.9).
3.5 Analytical Method Validation by HPLC: The validation study allowed the evaluation of the method for its
suitability for regular analysis. The newly developed method for Hydralazine hydrochloride and Hazh Dimer
impurity was validated according to ICH guidelines [14]. A typical chromatogram showing Hydralazine
Hydrochloride and Hazh Dimer impurity (fig. 10)
3.5.1 Specificity: Specificity is the ability of analytical method to measure the analyte response in the presence
of its potential impurities and degradants. The specificity of the Acquity UPLC H-class liquid method was
determined by injecting individual impurity samples, wherein no interference was observed for any of the
components.
The chromatograms were checked for the appearance of any extra peak. Peak purity of these was
verified using a PDA detector. The peak purity of the principle and other chromatographic peaks was found to
be satisfactory (fig. 11).
4. Structural elucidation, Identification, quantization of process related impurity in Hydralazine
www.iosrjournals.org 8 | Page
3.5.2 Precision: The precision of the method was examined using six replicate injections of a standard solution.
The relative standard deviation (RSD) was calculated for response (area) of Hazh Dimer impurity. The RSD for
Hazh Dimer impurity was found to be 2.37% (refer Table no.2). The method precision was established by
analyzing using six different preparations. The calculated RSD of these results was found to be within
acceptable limit (fig.12).
3.5.3 Accuracy: The accuracy of the method was determined for the related substances by spiking of known
amounts of a Hazh Dimer impurity in Hydralazine hydrochloride at levels, LOQ, 80%, 100% and 120% of the
specified limit. The recoveries of impurities were calculated and are given in Table no. 3 (fig.13).
3.6 Limit of detection and limit of quantification: Detection limit (DL) and quantization limit (QL) was
estimated as per ICH Q2 (R1). The limit of detection established for Hazh Dimer impurity was found to be
0.0081% and limit of quantification was found to be 0.0246%.
3.6.1 Linearity: Linear calibration curve were obtained over the calibration range i.e. LOQ, 50%, 80%, 100%,
120% and 150% at six concentration levels in triplicate. The results showed excellent correlation between the
peak area and concentration of Hazh Dimer impurity of about 0.9989 Table no. 4 (fig. 14).
3.6.2 Robustness: In all the deliberately varied chromatographic conditions (column temperature and flow
rate), no significant changes in results were observed
3.6.3 Solution stability: The solution stability of Hydralazine sample and Hazh Dimer impurity was carried out
by keeping both solutions in tightly capped HPLC vials at 25°C for 8 hrs in an Acquity UPLC H-class auto
sampler no significant changes were observed in the peak area.
IV. Figures And Tables
N
N
HN
NH2.HCl
Fig.1 Structure of Hydralazine Hydrochloride
1.Toluene
2.POCl3,75-800
C
3. 2-Ethoxy ethanol
1.NH2NH2.H2O + 2-Ethoxy ethanol
2.Heated 2 hr at 65-700
C
3.pH 3 - 4.5 by 15 % HCl
N
N
HN
NH2.HCl
Phthalazin-1(2H)-one 1-chlorophthalazine
Crude Hydralazine Hydrochloride
1. D. M H2O
2. Heated to 75-800
C
3. Charcoal (N) + EDTA
4. MeOH
N
N
HN
NH2.HCl
Pure Hydralazine Hydrochloride
N
N
Cl
NH
N
O
5. Structural elucidation, Identification, quantization of process related impurity in Hydralazine
www.iosrjournals.org 9 | Page
Fig.2 Synthetic Scheme for Hydralazine Hydrochloride
Fig. 3 Typical chromatogram of Hydralazine Hydrochloride EP Method showing unknown at 51.37min
Fig.4 A typical chromatogram of Hydralazine Hydrochloride USP Method showing unknown at 96.61min
Fig. 5 A typical TIC chromatogram of unknown impurity at 6.03 minute
6. Structural elucidation, Identification, quantization of process related impurity in Hydralazine
www.iosrjournals.org 10 | Page
140 160 180 200 220 240 260 280 300 320 340 360 380 400
m/z
0
10
20
30
40
50
60
70
80
90
100
0
10
20
30
40
50
60
70
80
90
100
RelativeAbundance
289.11963
289.11963
131.06057
272.09298
NL: 3.59E8
290512_08#43 RT: 0.29 AV:
1 SB: 139 0.00-0.26 ,
0.33-1.45 T: FTMS + p ESI Full
ms [50.00-600.00]
NL: 3.13E8
290512_08#46 RT: 0.31 AV:
1 SB: 139 0.00-0.26 ,
0.33-1.45 T: FTMS + p ESI Full
ms2 289.10@hcd28.00
[50.00-528.20]
Fig.6 HR/AM- LC MS/ and MS/MS of Hazh Dimer impurity
Fig.7 A typical chromatogram of preparative isolated Hazh Dimer impurity
N N
HN
NH
N N
N N
HN
NH2
N N
N N
HN
N
N
C16H13N6
+
Exact Mass: 289.11962
C16H10N5
+
Exact Mass: 272.09307
C16H12N6
Exact Mass: 288.11234
7. Structural elucidation, Identification, quantization of process related impurity in Hydralazine
www.iosrjournals.org 11 | Page
Fig.8 Plausible fragmentation for Hazh Dimer impurity
Fig.9 A FTIR spectra of Hazh Dimer impurity
Fig 10 A typical chromatogram showing (a) Hydralazine Hydrochloride and (b) Hazh Dimer impurity
using Acquity UPLC H-class
8. Structural elucidation, Identification, quantization of process related impurity in Hydralazine
www.iosrjournals.org 12 | Page
Fig.11 A typical chromatogram showing Peak purity (purity angle less than purity threshold) of Hazh
Dimer
Fig.12 A typical chromatogram showing RSD for six replicate injections of Hazh Dimer
Fig.13 A overlay chromatogram showing spike of Hazh Dimer at LOQ, 80%, 100%, 120% in
Hydralazine Hydrochloride
9. Structural elucidation, Identification, quantization of process related impurity in Hydralazine
www.iosrjournals.org 13 | Page
Linearity of HAZH Dimer
0.00
2000.00
4000.00
6000.00
8000.00
10000.00
12000.00
0.000 0.200 0.400 0.600 0.800 1.000 1.200 1.400 1.600
Concentration (ppm )
Area
Fig.14 Linearity of Hazh Dimer
Table no.1: 1
H NMR and C-13 assignment for Hazh Dimer
N
N
HN
NH
N
N
1
2
3
4 5
6
7
8
9
10
11
Position a
Integration δ (ppm) Multiplicity, J (Hz)a
13C δ (ppm)
1 - - - 144.3
2 - - - -
3 - - - -
4 2H 7.86 s 136.9
5 2H 7.57-7.66 m 127.1
6 2H 7.57-7.66 m 131.7
7 2H 7.57-7.66 m 131.6
8 2H 8.64-8.66 m 126.3
9 - - - 124.8
10 - - - 128.1
11 2H 11.59 s -
a
Refer the structural formula in Figure. b 1
H-1
H coupling constants.
Table no. 2 Precision Study (Hazh Dimer Precision study)
No of Injection Retention time (min) Area Tailing factor Theoretical Plates
1 5.727 7884 1.04 22363
2 5.722 7741 1.01 23803
3 5.733 7593 1.08 24885
4 5.738 7604 1.04 25233
5 5.728 7678 0.99 21613
6 5.729 7341 1.07 25102
Mean 5.730 7640.17 1.04 23833
Std Dev 0.0055 181.1556 0.0343 1534.0968
RSD 0.10 2.37 3.30 6.44
Min 5.722 7593 0.99 21613
Max 5.738 7884 1.08 25233
10. Structural elucidation, Identification, quantization of process related impurity in Hydralazine
www.iosrjournals.org 14 | Page
Table no. 3 Accuracy for Hazh Dimer
Mean area of HAZH Dimer in standard solution (n=6) (S) 7588.67
% RSD 1.27
Concentration in ppm of HAZH Dimer (Cs) 1.0000
Area of HAZH Dimer in Parent test 0
level Solution
no.
Conc. in
ppm(C)
Area counts
in test added
in ppm
Corrected
area (A)
Recovery
in ppm
%
recovery
Mean %
recovery
SD %RS
D
LOQ Test-1 0.2500 1929 1929 0.2542 101.68 97.88 3.743 3.82
Test-2 1787 1787 0.2355 94.19
Test-3 1855 1855 0.2444 97.78
80% Test-1 0.8000 7179 7179 0.9460 118.25 117.09 1.494 1.28
Test-2 7006 7006 0.9232 115.40
Test-3 7140 7140 0.9409 117.61
100% Test-1 1.0000 8986 8986 1.1841 118.41 117.41 1.050 0.89
Test-2 8827 8827 1.1632 116.32
Test-3 8916 8916 1.1749 117.49
120% Test-1 1.2000 10631 10631 1.4009 116.74 116.60 1.105 0.95
Test-2 10511 10511 1.3851 115.42
Test-3 10711 10711 1.4114 117.62
Mean % Recovery (n=12) 112.24
% RSD of % Recovery 7.89
Min 97.88
Max 117.41
Table no. 4 Linearity of Hazh Dimer
Linearity of HAZH Dimer
Level Conc.(ppm) Area Regression area
Near LOQ Level 0.200 975.33 820
50% 0.500 2909.33 3032
80% 0.800 4994.00 5244
100% 1.000 6864.67 6718
120% 1.200 8266.33 8193
150% 1.500 10402.00 10405
Correlation coefficient 0.9989
Slope 7373.14
Intercept -654.77
V. Conclusion
A major process related unknown impurity of Hydralazine hydrochloride was Isolation by using semi-
preparative method. The structural characterization of the isolated impurity was carried out by using HR/AM-
LC MS/MS and other modern spectroscopic (NMR and FTIR) techniques. The combined result of HR/AM- LC
MS/MS, NMR and FTIR confirmed the structure of unknown impurity as1-(2-phthalazin-1-ylhydrazino)
phthalazine. A rapid Acquity UPLC H-class liquid chromatographic method developed was successfully
validated for control of 1-(2-phthalazin-1-ylhydrazino) phthalazine in Hydralazine Hydrochloride API.
Acknowledgement
The authors wish to thank, the manager, IPCA Laboratories limited, for providing necessary facilities
for research work. Special Thanks to Dharmendra Singh, Kishor More, Usha Bhosle, Prathamesh Deshpandey,
Lalita, Mayuri , Vishant for their cooperation and help.
11. Structural elucidation, Identification, quantization of process related impurity in Hydralazine
www.iosrjournals.org 15 | Page
References
[1]. Merck Index, an encyclopedia of chemicals, drugs and biological, Fourteenth edition, Whitehouse Station,( Merck & Co., New
Jersey USA,2006) 824.
[2]. James E F Reynold, Kathleen Barfitt Martindale, the extra pharmacopoeia 31st
edition.( Published by the council of royal
pharmaceutical society of Great Britain. , 1996 ) 885
[3]. Analytical profiles of drug substances Volume 8 Klaus Florey publication by Academic press. 283-314.
[4]. European pharmacopoeia. 2011, 2: 2191.
[5]. United States pharmacopoeia 36 National formulary Volume 2 pp 3818.
[6]. The Japanese pharmacopoeia sixteenth edition published by pharmaceutical and medical device regulatory science society of Japan.
(Shibuya, Tokyo 150-0002 Japan,2012) 924.
[7]. Pharmacopoeia of the people’s republic of China , volume II. Chinese pharmacopoeia commission. Published by China medical
science press (A-22, Northern Wenhuiyan road, Haidian district Bejing China, 2010) 100082.
[8]. United States patent application publication number US2007/0129546A1, 2007.
[9]. United States patent publication number US7531653B2 , 2009.
[10]. United States patent publication number US 2009187018 A1 , 2009.
[11]. ICH International conference on harmonization, Impurities in New Drug Substances Q3A (R2),2006.
[12]. A. Gareth Brenton and A. Ruth Godfrey Accurate Mass Measurement: Terminology and Treatment of Data.,Institute of Mass
Spectrometry, Grove Building, School of Medicine, Swansea University, Swansea, Wales, )United Kingdom Published by Elsevier
Inc. on behalf of American Society for Mass Spectrometry,2010).
[13]. Bradford P Mundy, Michael G Ellerd and Frank G Favaloro Jr., Name reaction and reagents in organic synthesis.( A Jhon Wiley
and sons, Inc., second edition,2005) 668-669.
[14]. ICH , International conference on harmonization, validation of analytical procedures; text and methodology Q2 (R1),2005