Downloaded 13 times
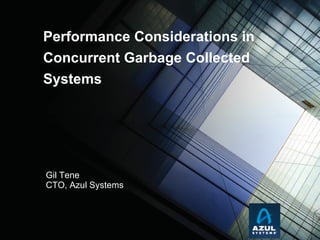
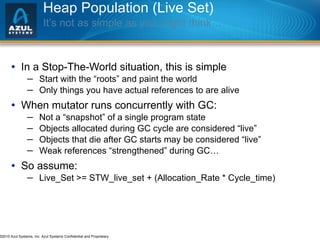
![Agenda Background Memory stagnation Java & Virtualization [Concurrent] Garbage Collection deep-dive Some [more] Azul Zing Platform details Talk-Talk / Q & A](https://image.slidesharecdn.com/azulyandexjune010-100702062210-phpapp02/85/Azul-yandexjune010-2-320.jpg)


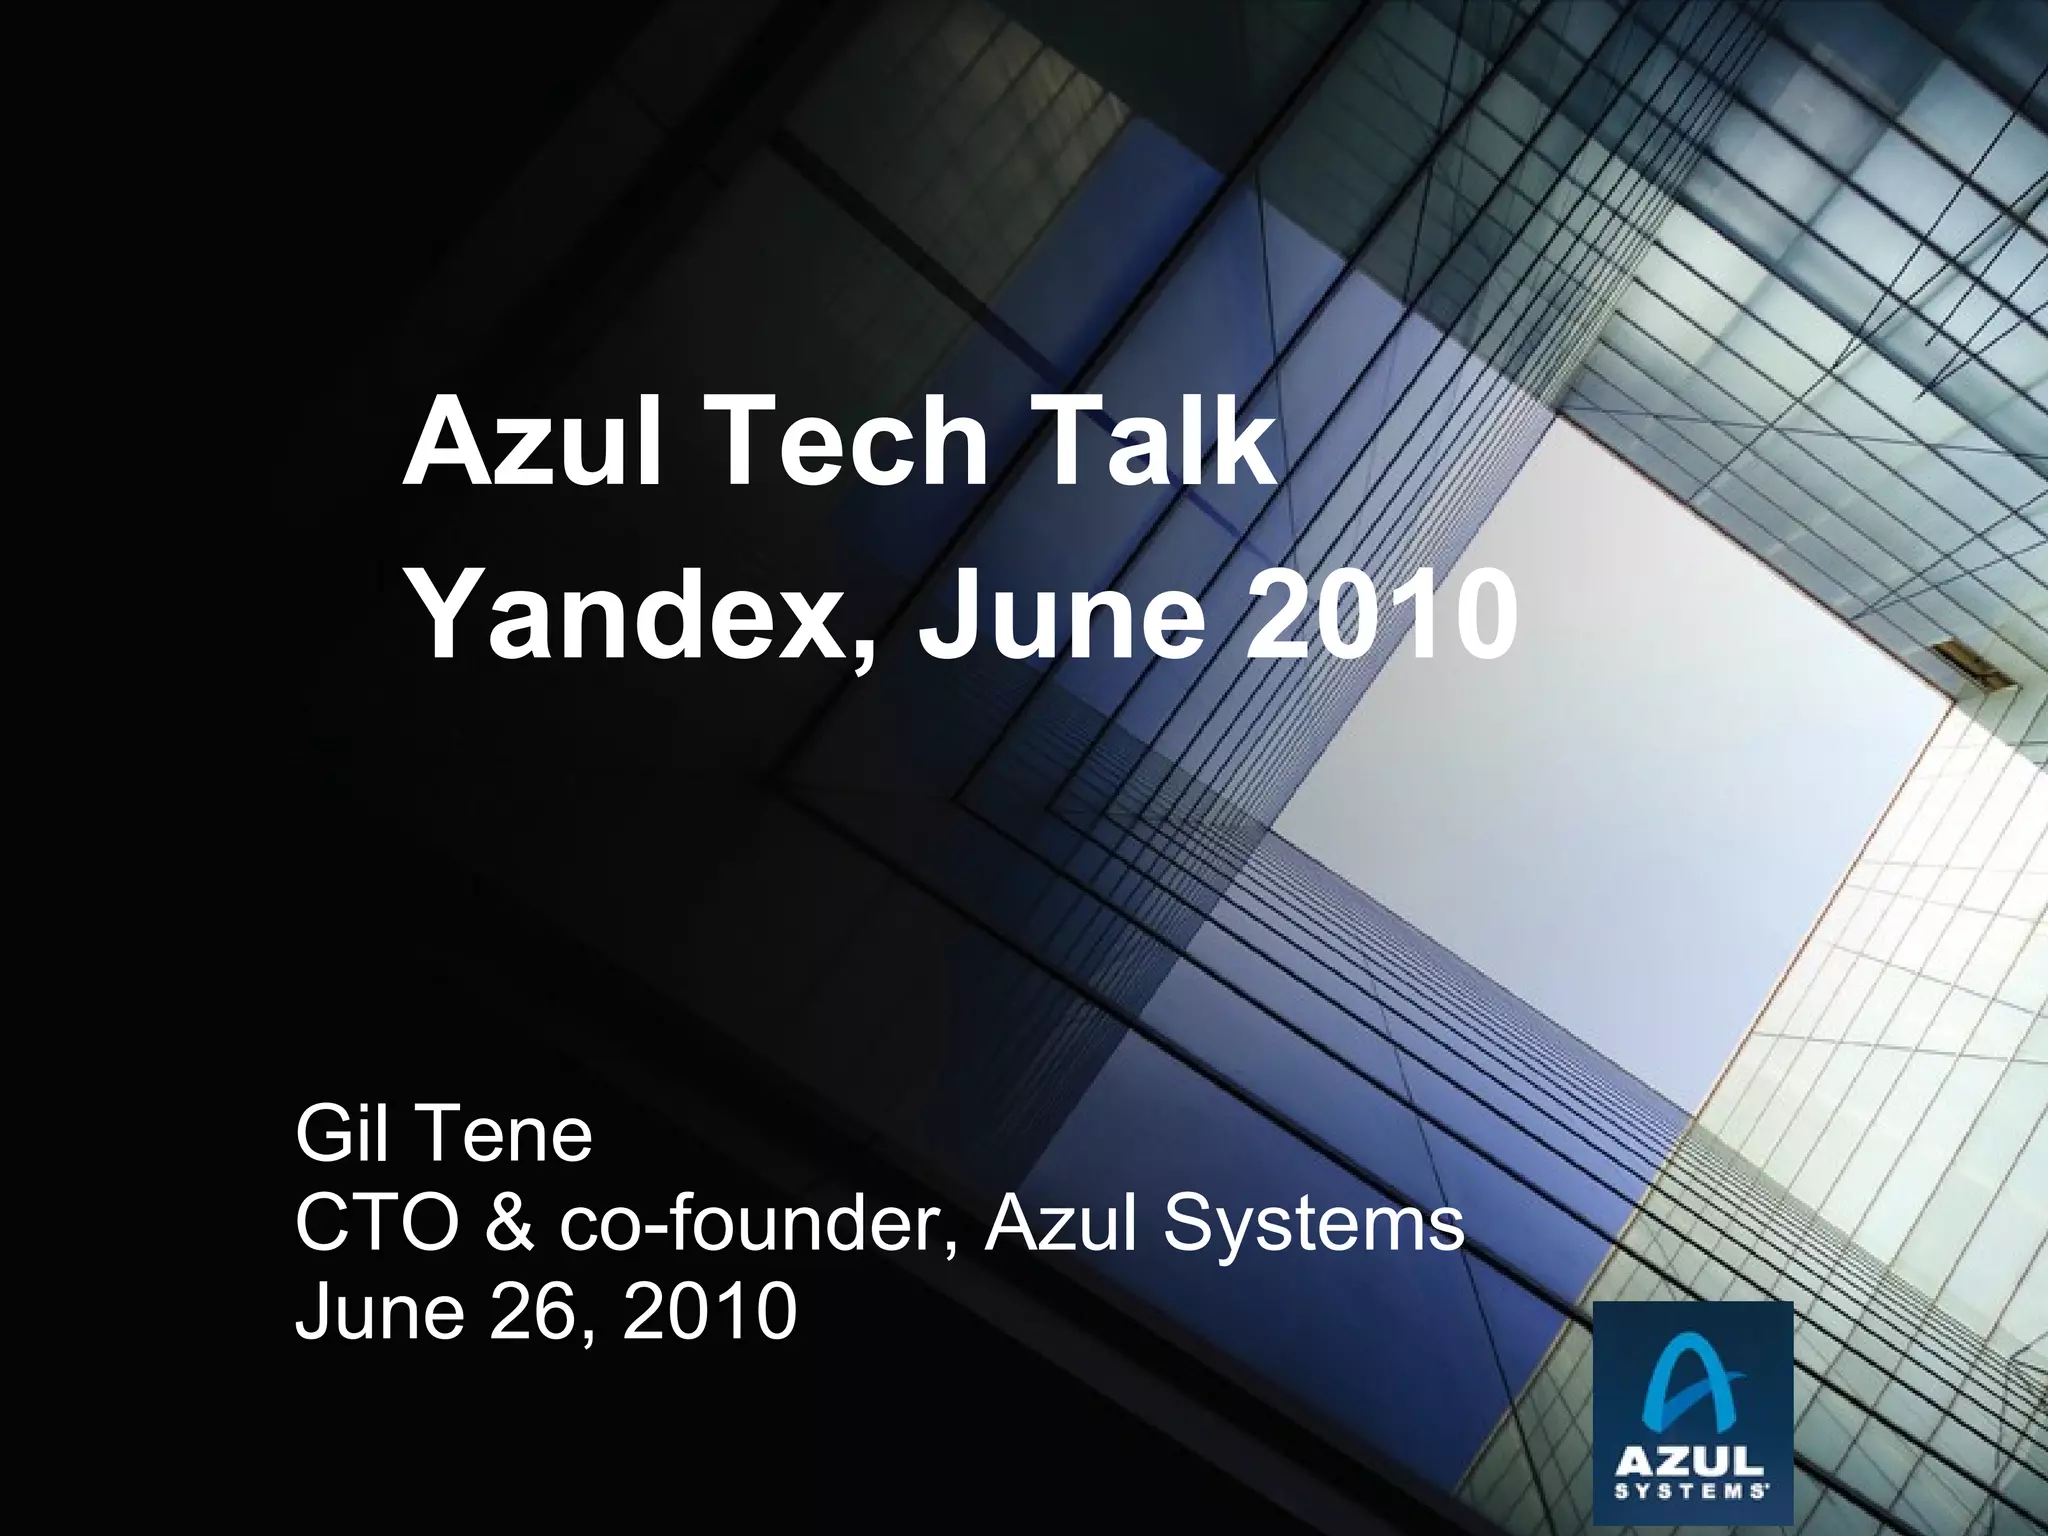
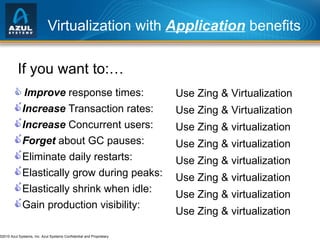
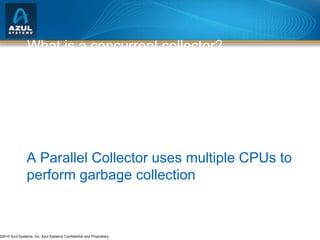
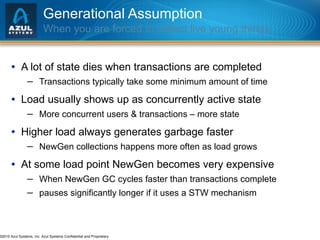
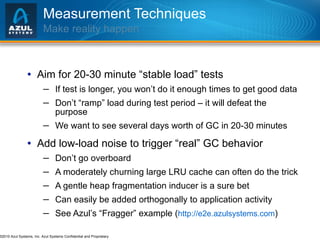
![Why ~2GB? – It’s all about GC (and only GC) Seems to be the practical limit for responsive applications A 100GB heap won’t crash. It just periodically “pauses” for many minutes at a time. [Virtually] All current commercial JVMs will exhibit a periodic multi-second pause on a normally utilized 2GB heap. It’s a question of “When”, not “If”. GC Tuning only moves the “when” and the “how often” around “ Compaction is done with the application paused. However, it is a necessary evil, because without it, the heap will be useless… ” (JRockit RT tuning guide).](https://image.slidesharecdn.com/azulyandexjune010-100702062210-phpapp02/85/Azul-yandexjune010-7-320.jpg)

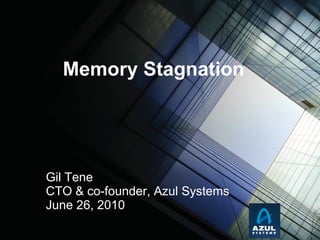
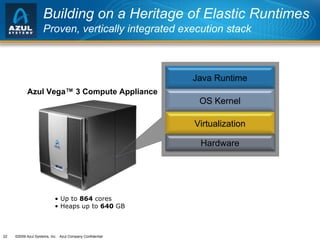
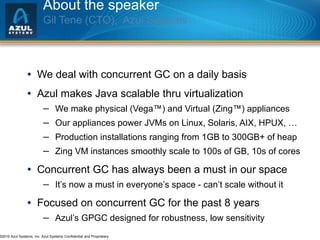
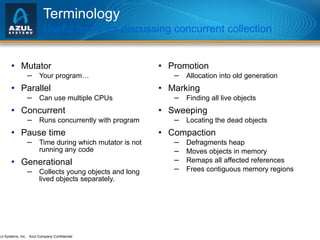
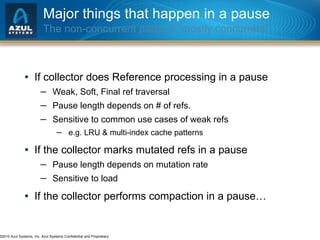
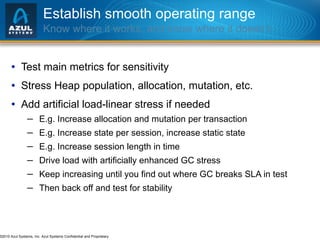
![Will distributed solutions “solve” the problem? Distributed data solutions are [only] used to solve problems that can’t be solved without distribution Extra complexity & loss of efficiency only justified by necessity It’s always because something doesn’t fit in one simple symmetric UMA process model When we need more compute power than one node has When we need more memory state than one node can hold Distributed solutions are not used to solve tiny problems “ Tiny” is not a matter of opinion, it’s a matter of time “ Tiny” gets ~100x bigger every decade](https://image.slidesharecdn.com/azulyandexjune010-100702062210-phpapp02/85/Azul-yandexjune010-9-320.jpg)


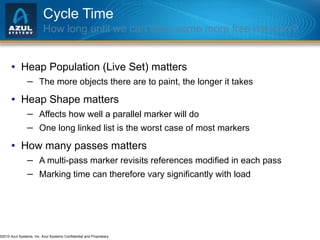
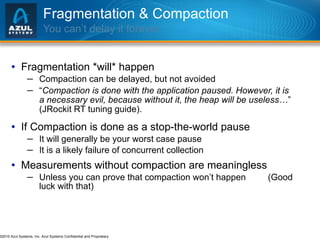
![1. Understand why concurrent garbage collection is a necessity 2. Gain an understanding of performance considerations specific to concurrent garbage collection 3. Understand what concurrent collectors are sensitive to, and what can cause them to fail 4. Learn how [not] to measure GC in a lab](https://image.slidesharecdn.com/azulyandexjune010-100702062210-phpapp02/85/Azul-yandexjune010-27-320.jpg)
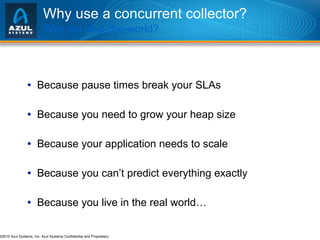


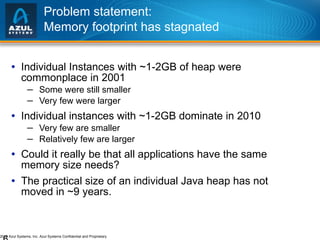
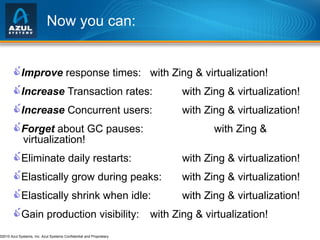
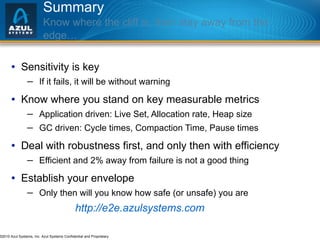
![What constitutes “failure” for a collector? It’s not just about correctness any more A Stop-The-World collector fails if it gets it wrong… A concurrent collector [also] fails if it stops the application for longer than requirements permit “ Occasional pauses” longer than SLA allows are real failures Even if the Application Instance or JVM didn’t crash Otherwise, you would have used a STW collector to begin with Simple example: Clustering Node failover must occur in X seconds or less A GC pause longer than X will trigger failover. It’s a fault. ( If you don’t think so, ask the guy whose pager just went off… )](https://image.slidesharecdn.com/azulyandexjune010-100702062210-phpapp02/85/Azul-yandexjune010-34-320.jpg)
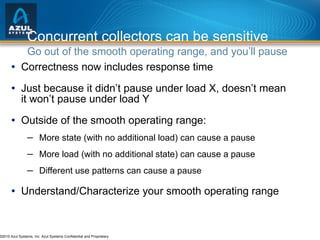


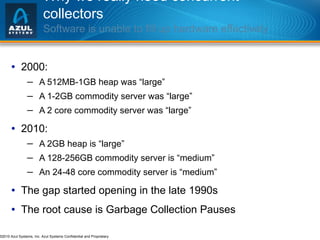
The document discusses issues with memory and garbage collection in Java applications. It notes that the practical heap size for most Java applications has stagnated at around 2GB for the past decade, due to garbage collection pauses above this size. The document introduces Azul Systems and their Zing virtualization platform, which aims to eliminate garbage collection as a limiting factor through techniques like concurrent and parallel garbage collection that can support heaps up to 100GB without long pauses. It discusses various performance aspects of concurrent garbage collection like sensitivity to workload, heap population, and mutation rate.