Download as PDF, PPTX
![©2011 Azul Systems, Inc.
What is keeping Java platforms from
making full use of current servers?
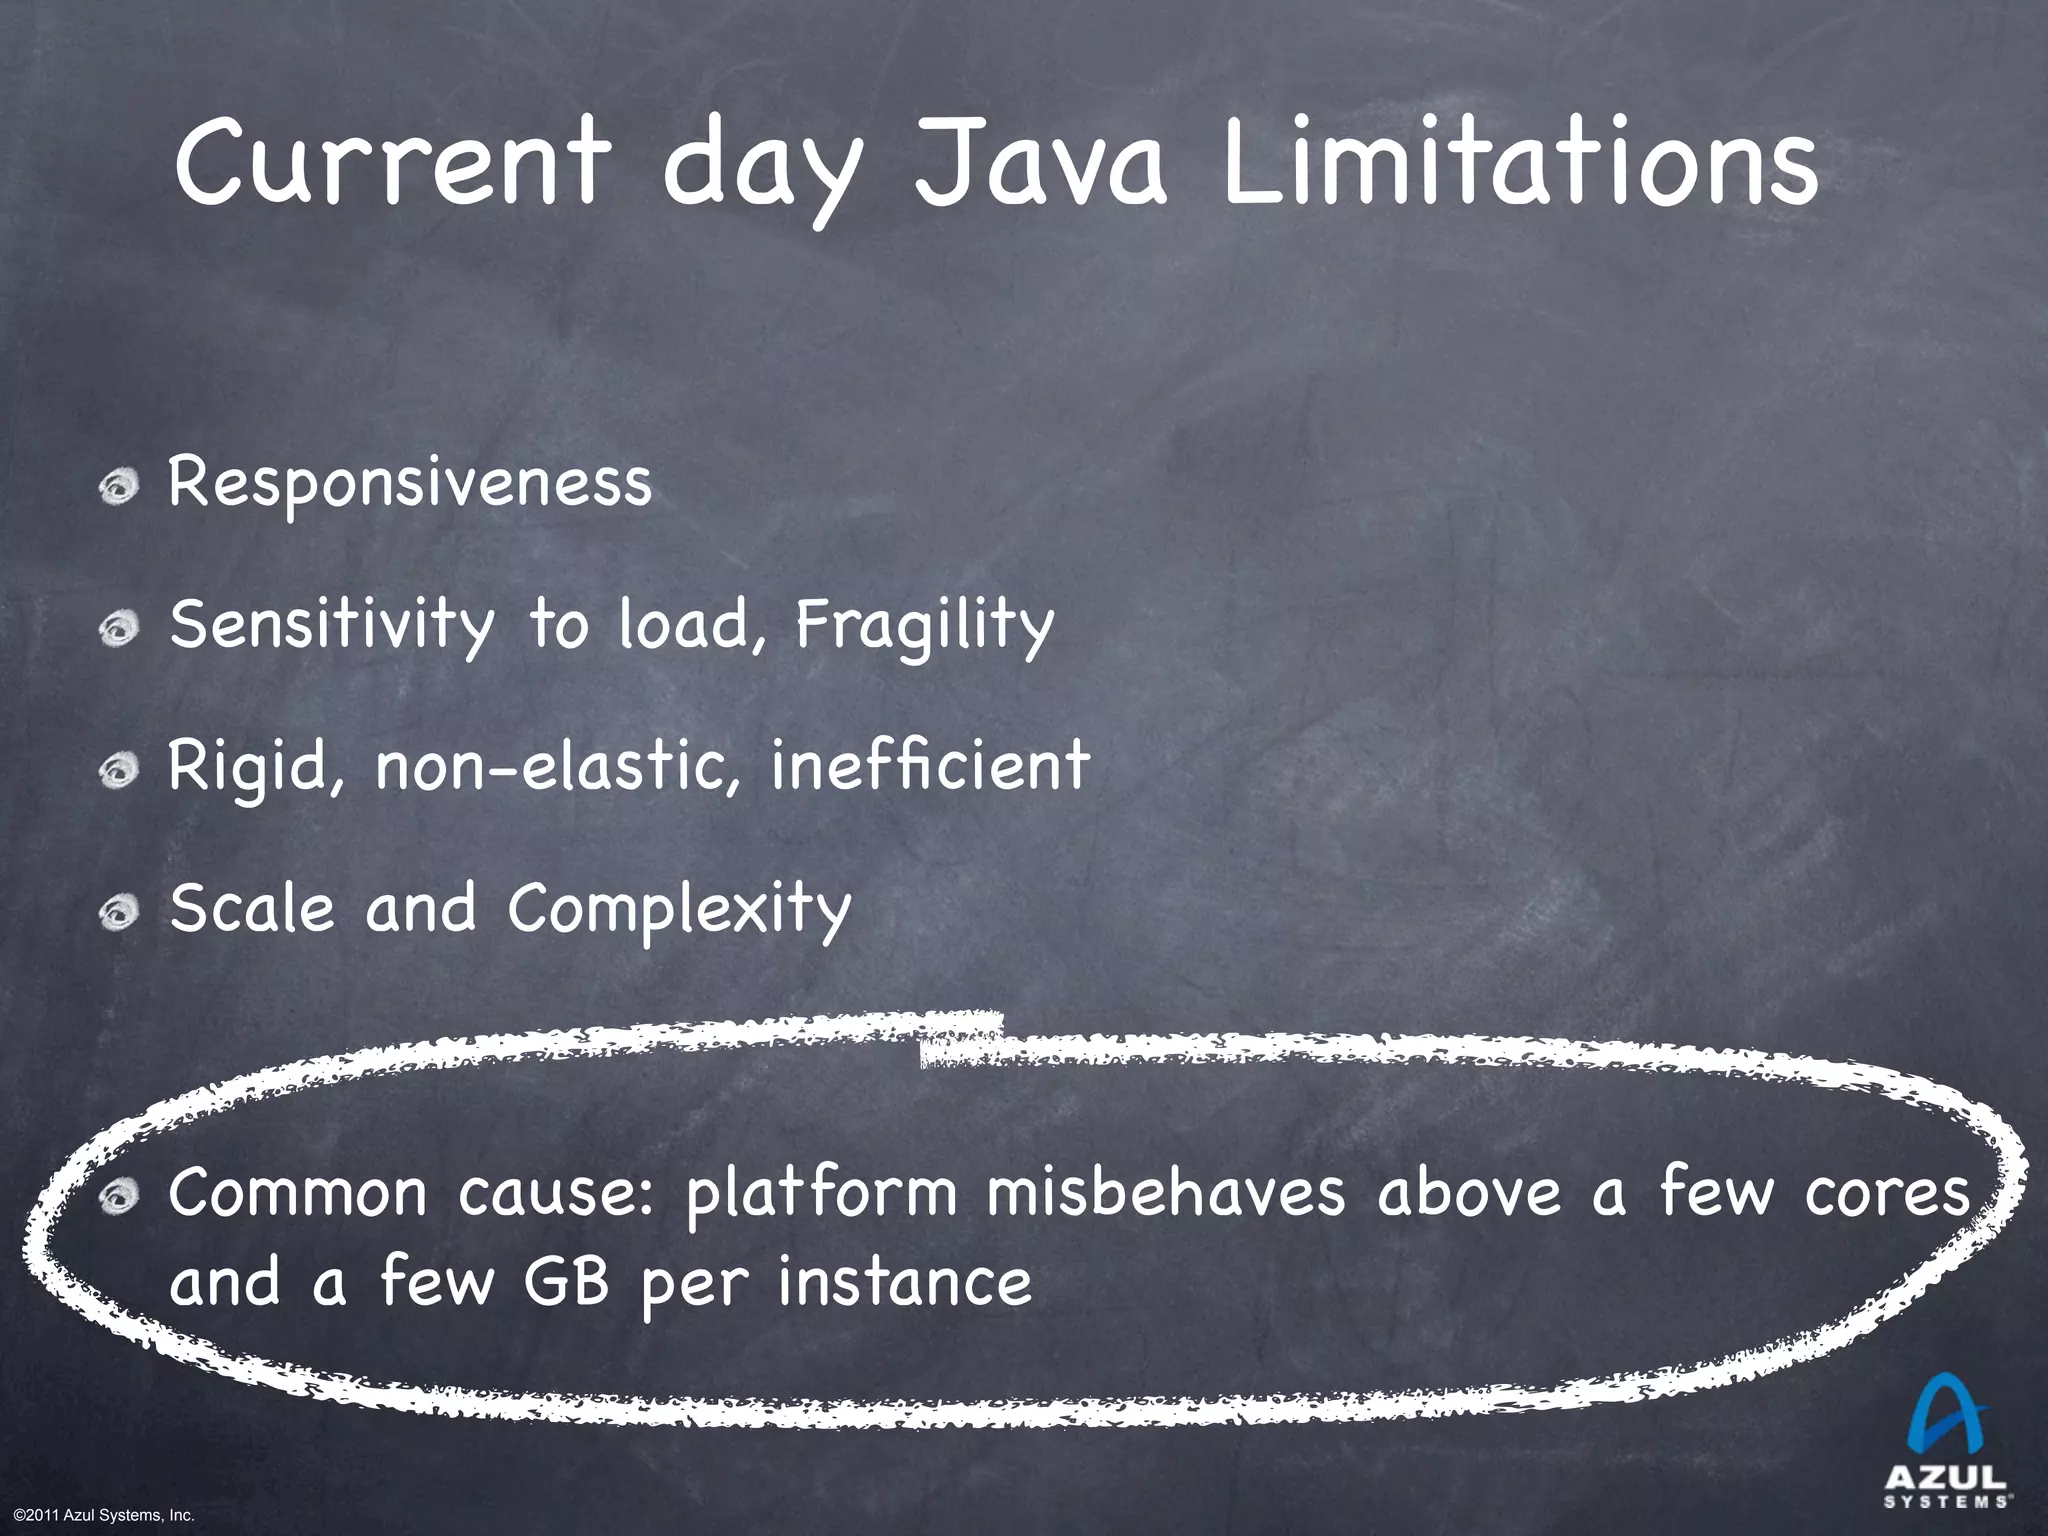
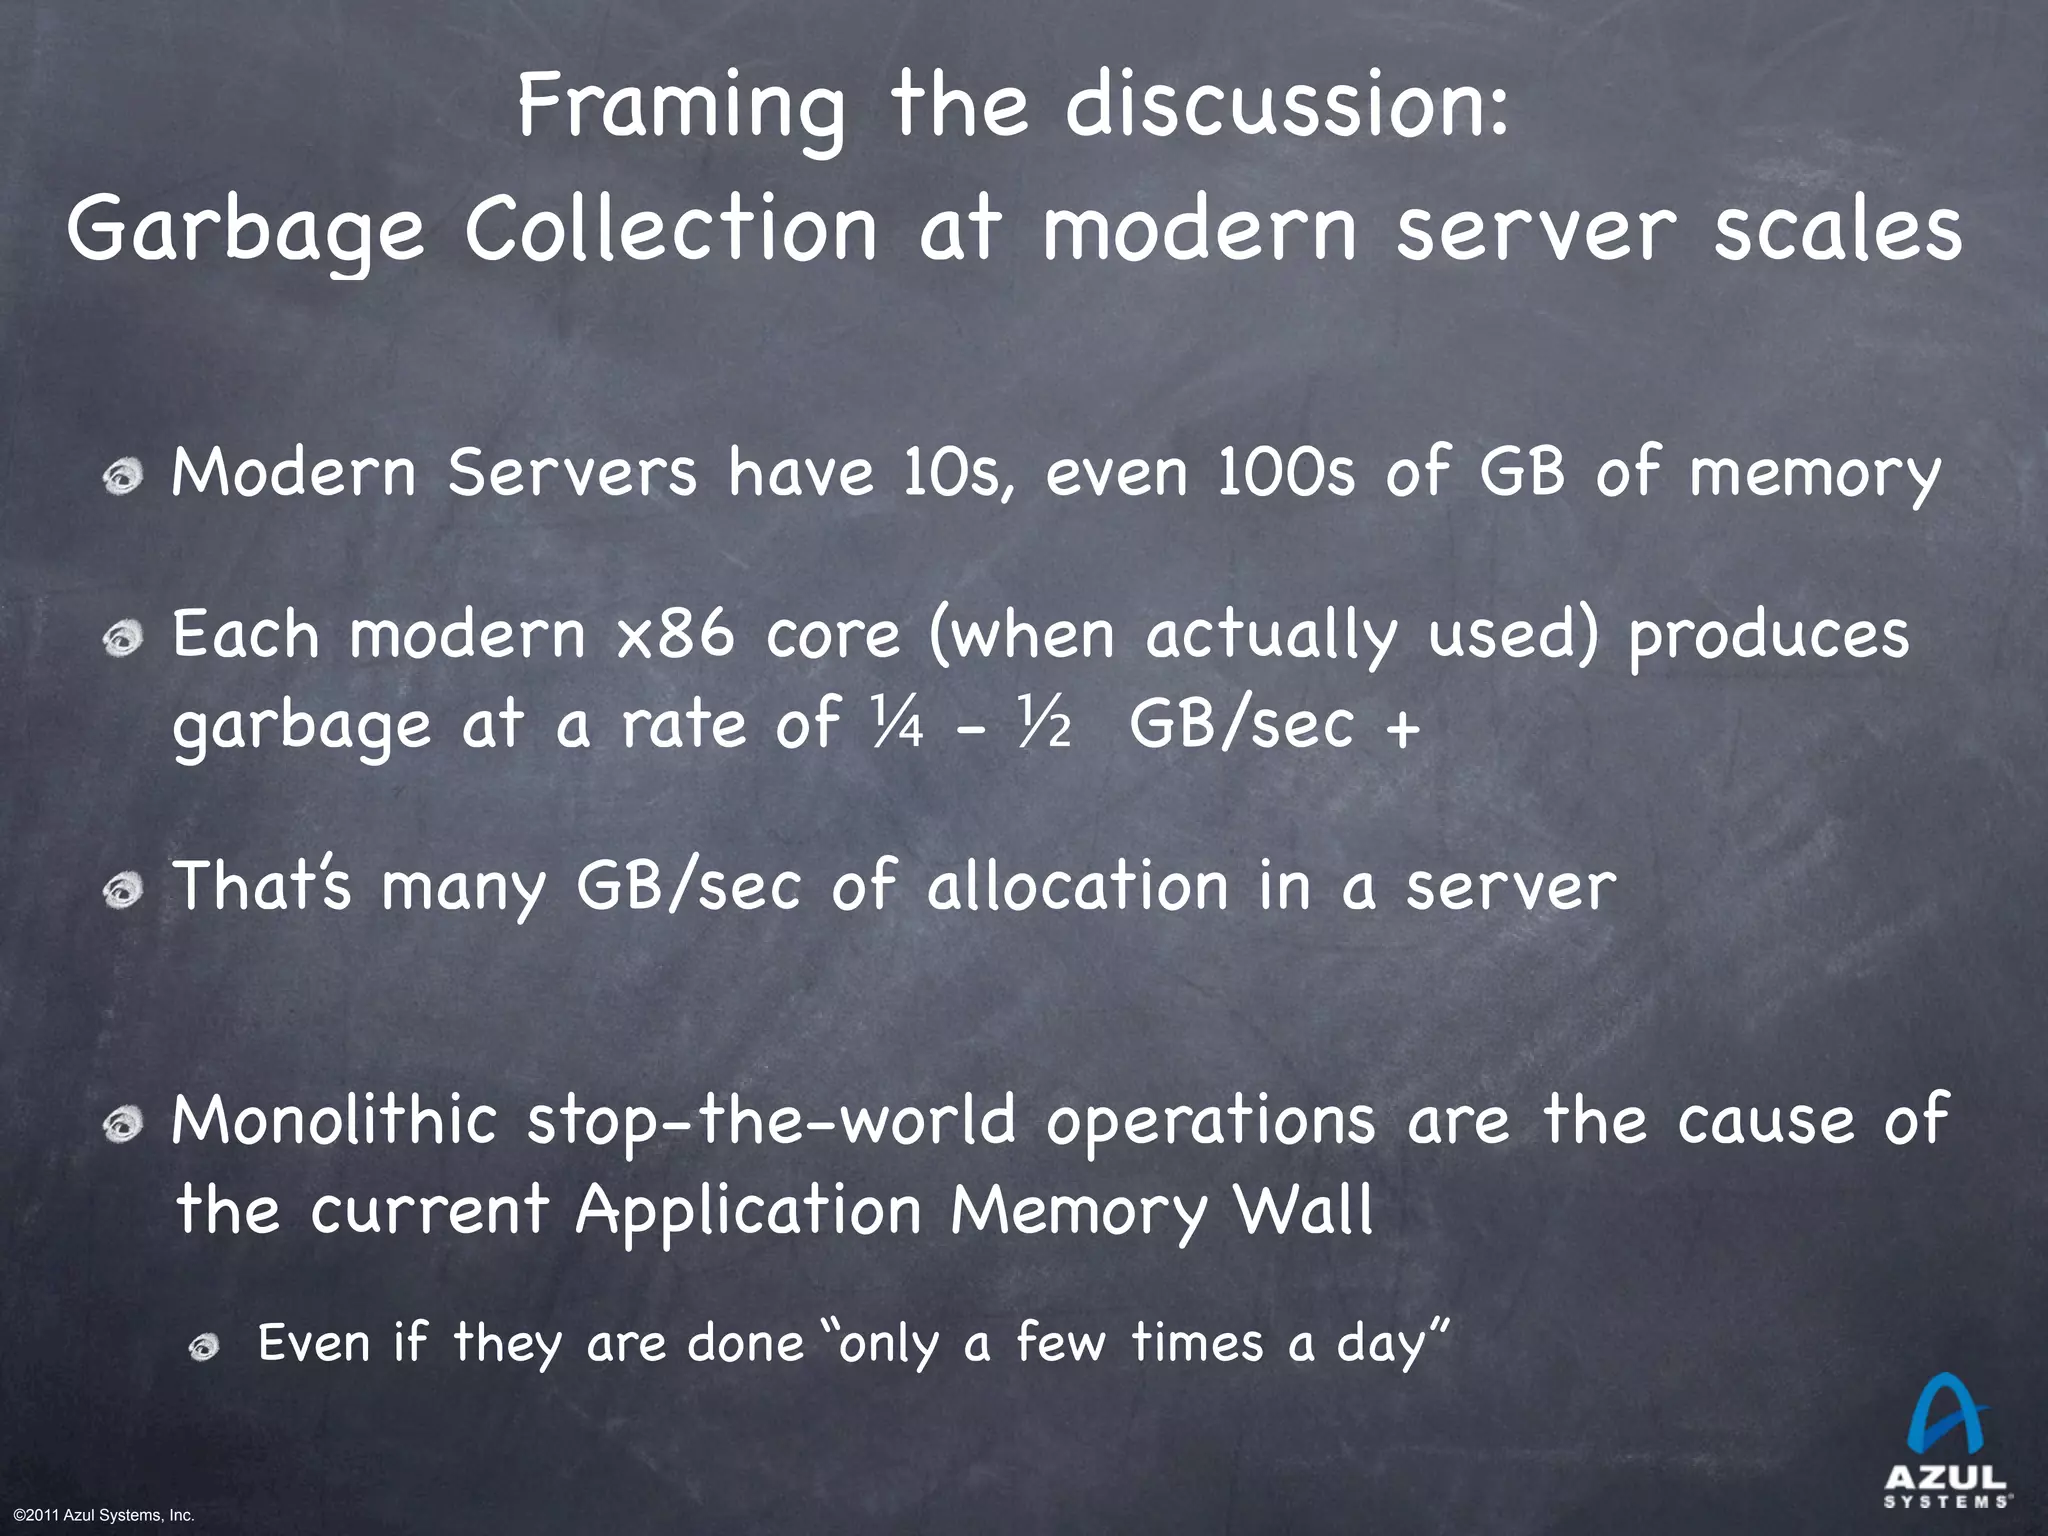
Garbage Collection is a clear and dominant cause
There seem to be practical heap size limits for
applications with responsiveness requirements
[Virtually] All current commercial JVMs will exhibit a
multi-second pause on a normally utilized 2-4GB heap.
It’s a question of “When” and “How often”, not “If”.
GC tuning only moves the “when” and the “how often” around
Root cause: The link between scale and responsiveness](https://image.slidesharecdn.com/mismatchwebinarjan2012-131129081916-phpapp02-150118132524-conversion-gate02/75/The-Java-Evolution-Mismatch-by-Gil-Tene-CTO-at-Azul-Systems-9-2048.jpg)
![©2011 Azul Systems, Inc.
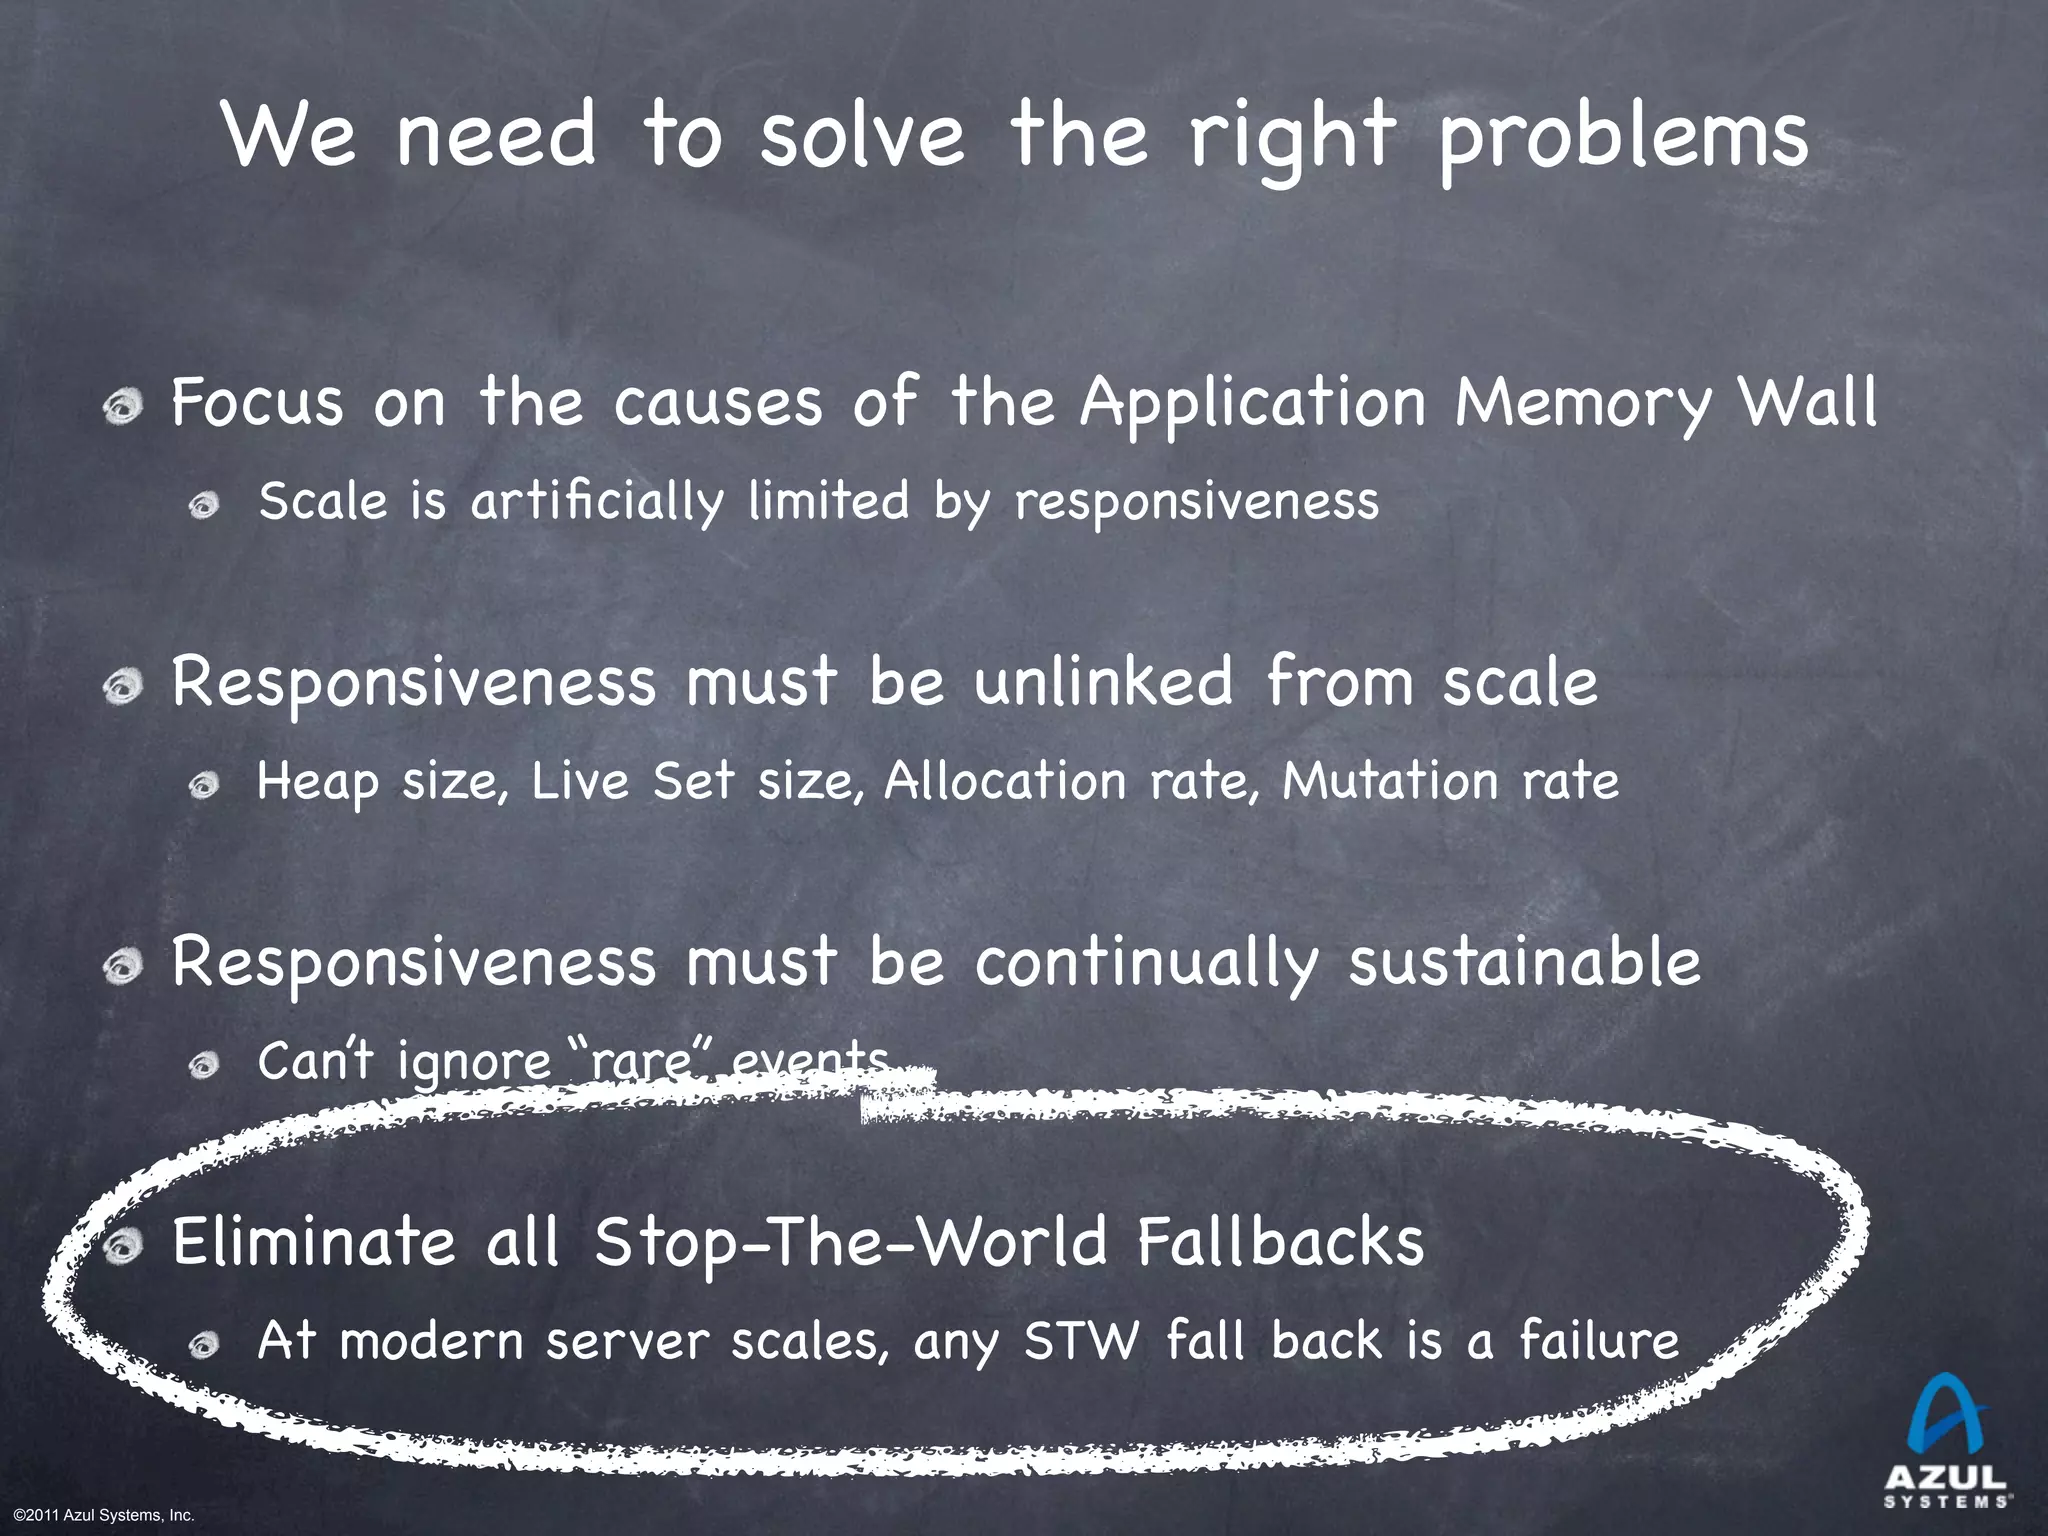
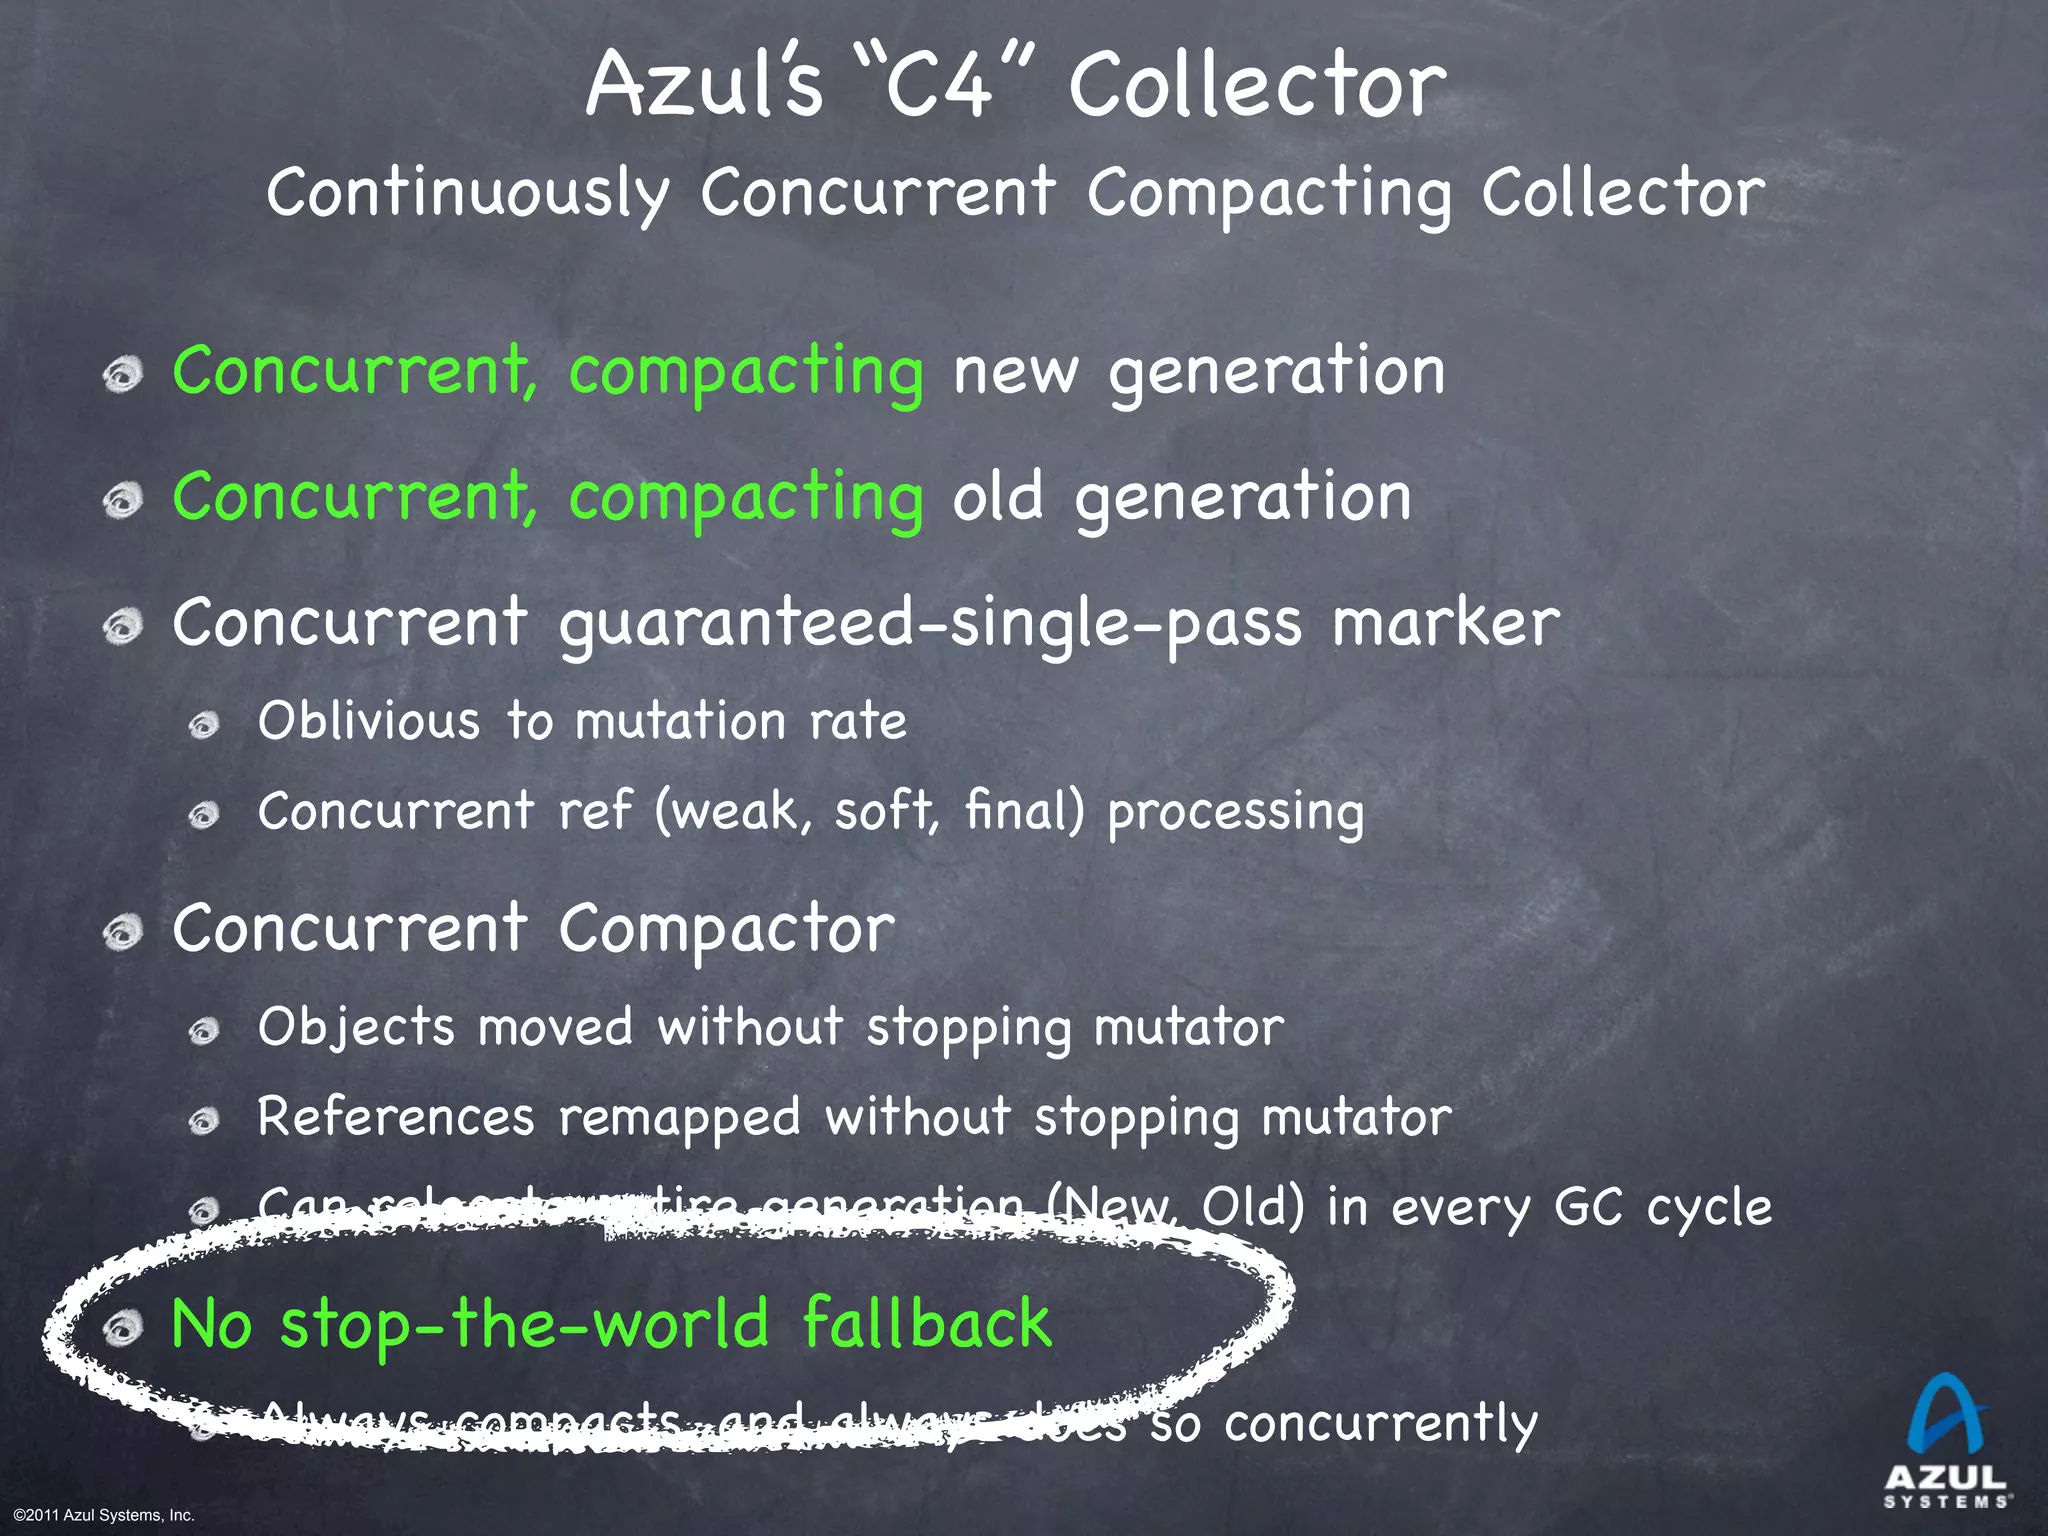
The problems that need solving
(areas where the state of the art needs improvement)
Robust Concurrent Marking
In the presence of high mutation and allocation rates
Cover modern runtime semantics (e.g. weak refs)
Compaction that is not monolithic-stop-the-world
Stay responsive while compacting many-GB heaps
Must be robust: not just a tactic to delay STW compaction
[current “incremental STW” attempts fall short on robustness]
Non-monolithic-stop-the-world Generational collection
Stay responsive while promoting multi-GB data spikes
Concurrent or “incremental STW” may be both be ok
Surprisingly little work done in this specific area](https://image.slidesharecdn.com/mismatchwebinarjan2012-131129081916-phpapp02-150118132524-conversion-gate02/75/The-Java-Evolution-Mismatch-by-Gil-Tene-CTO-at-Azul-Systems-15-2048.jpg)


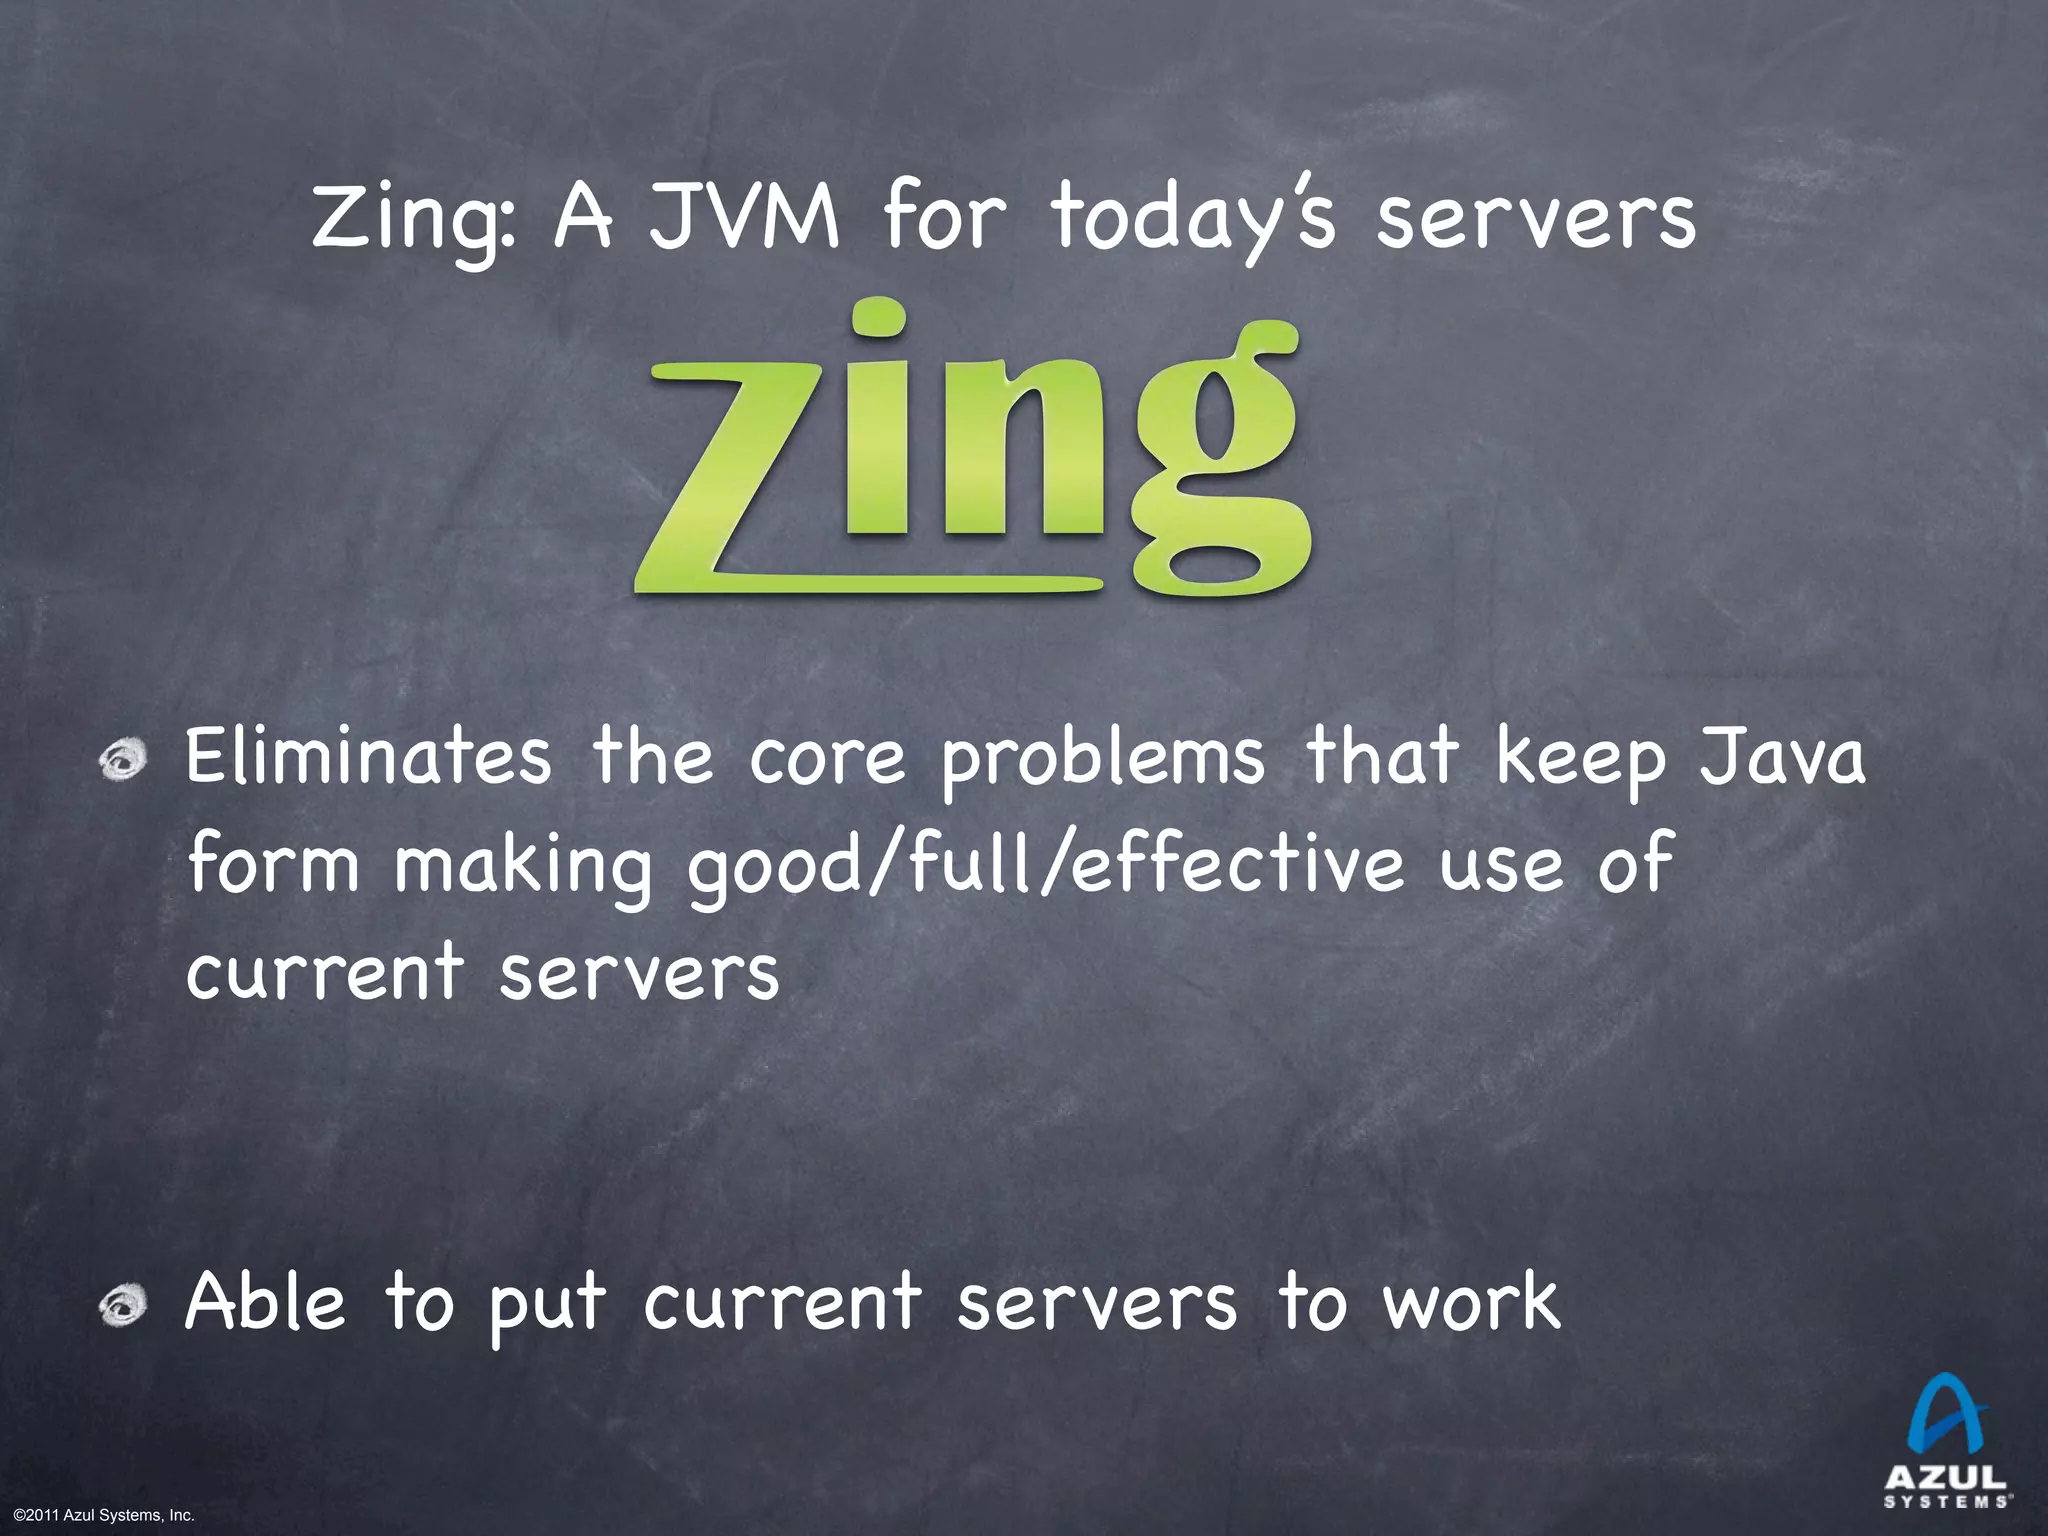
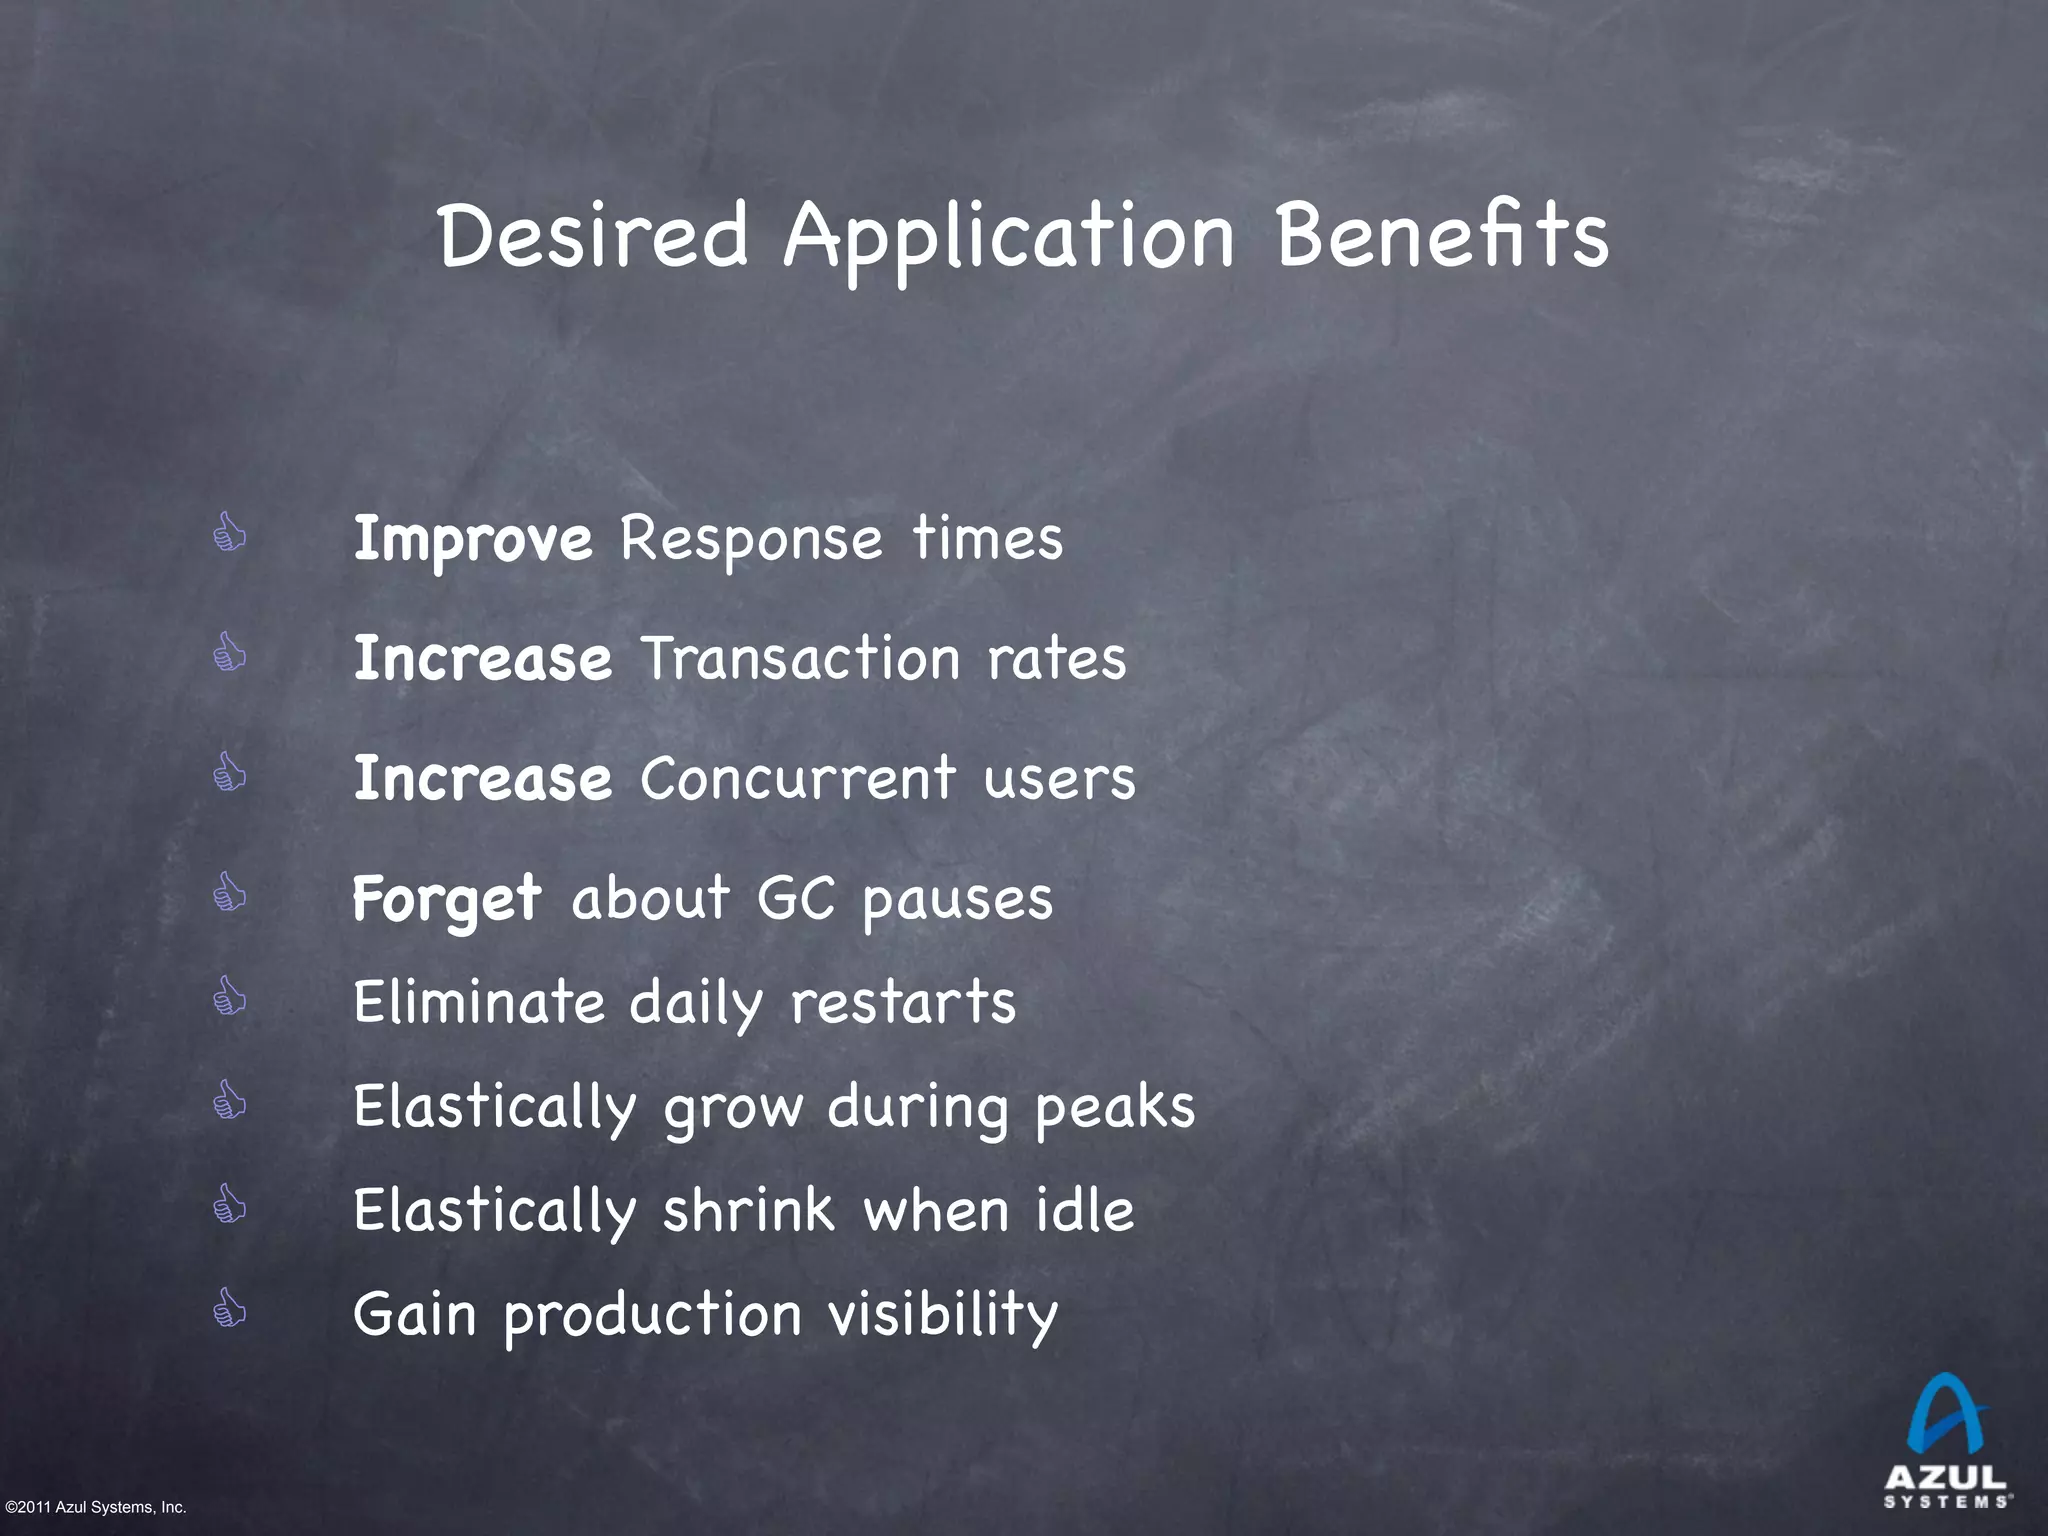
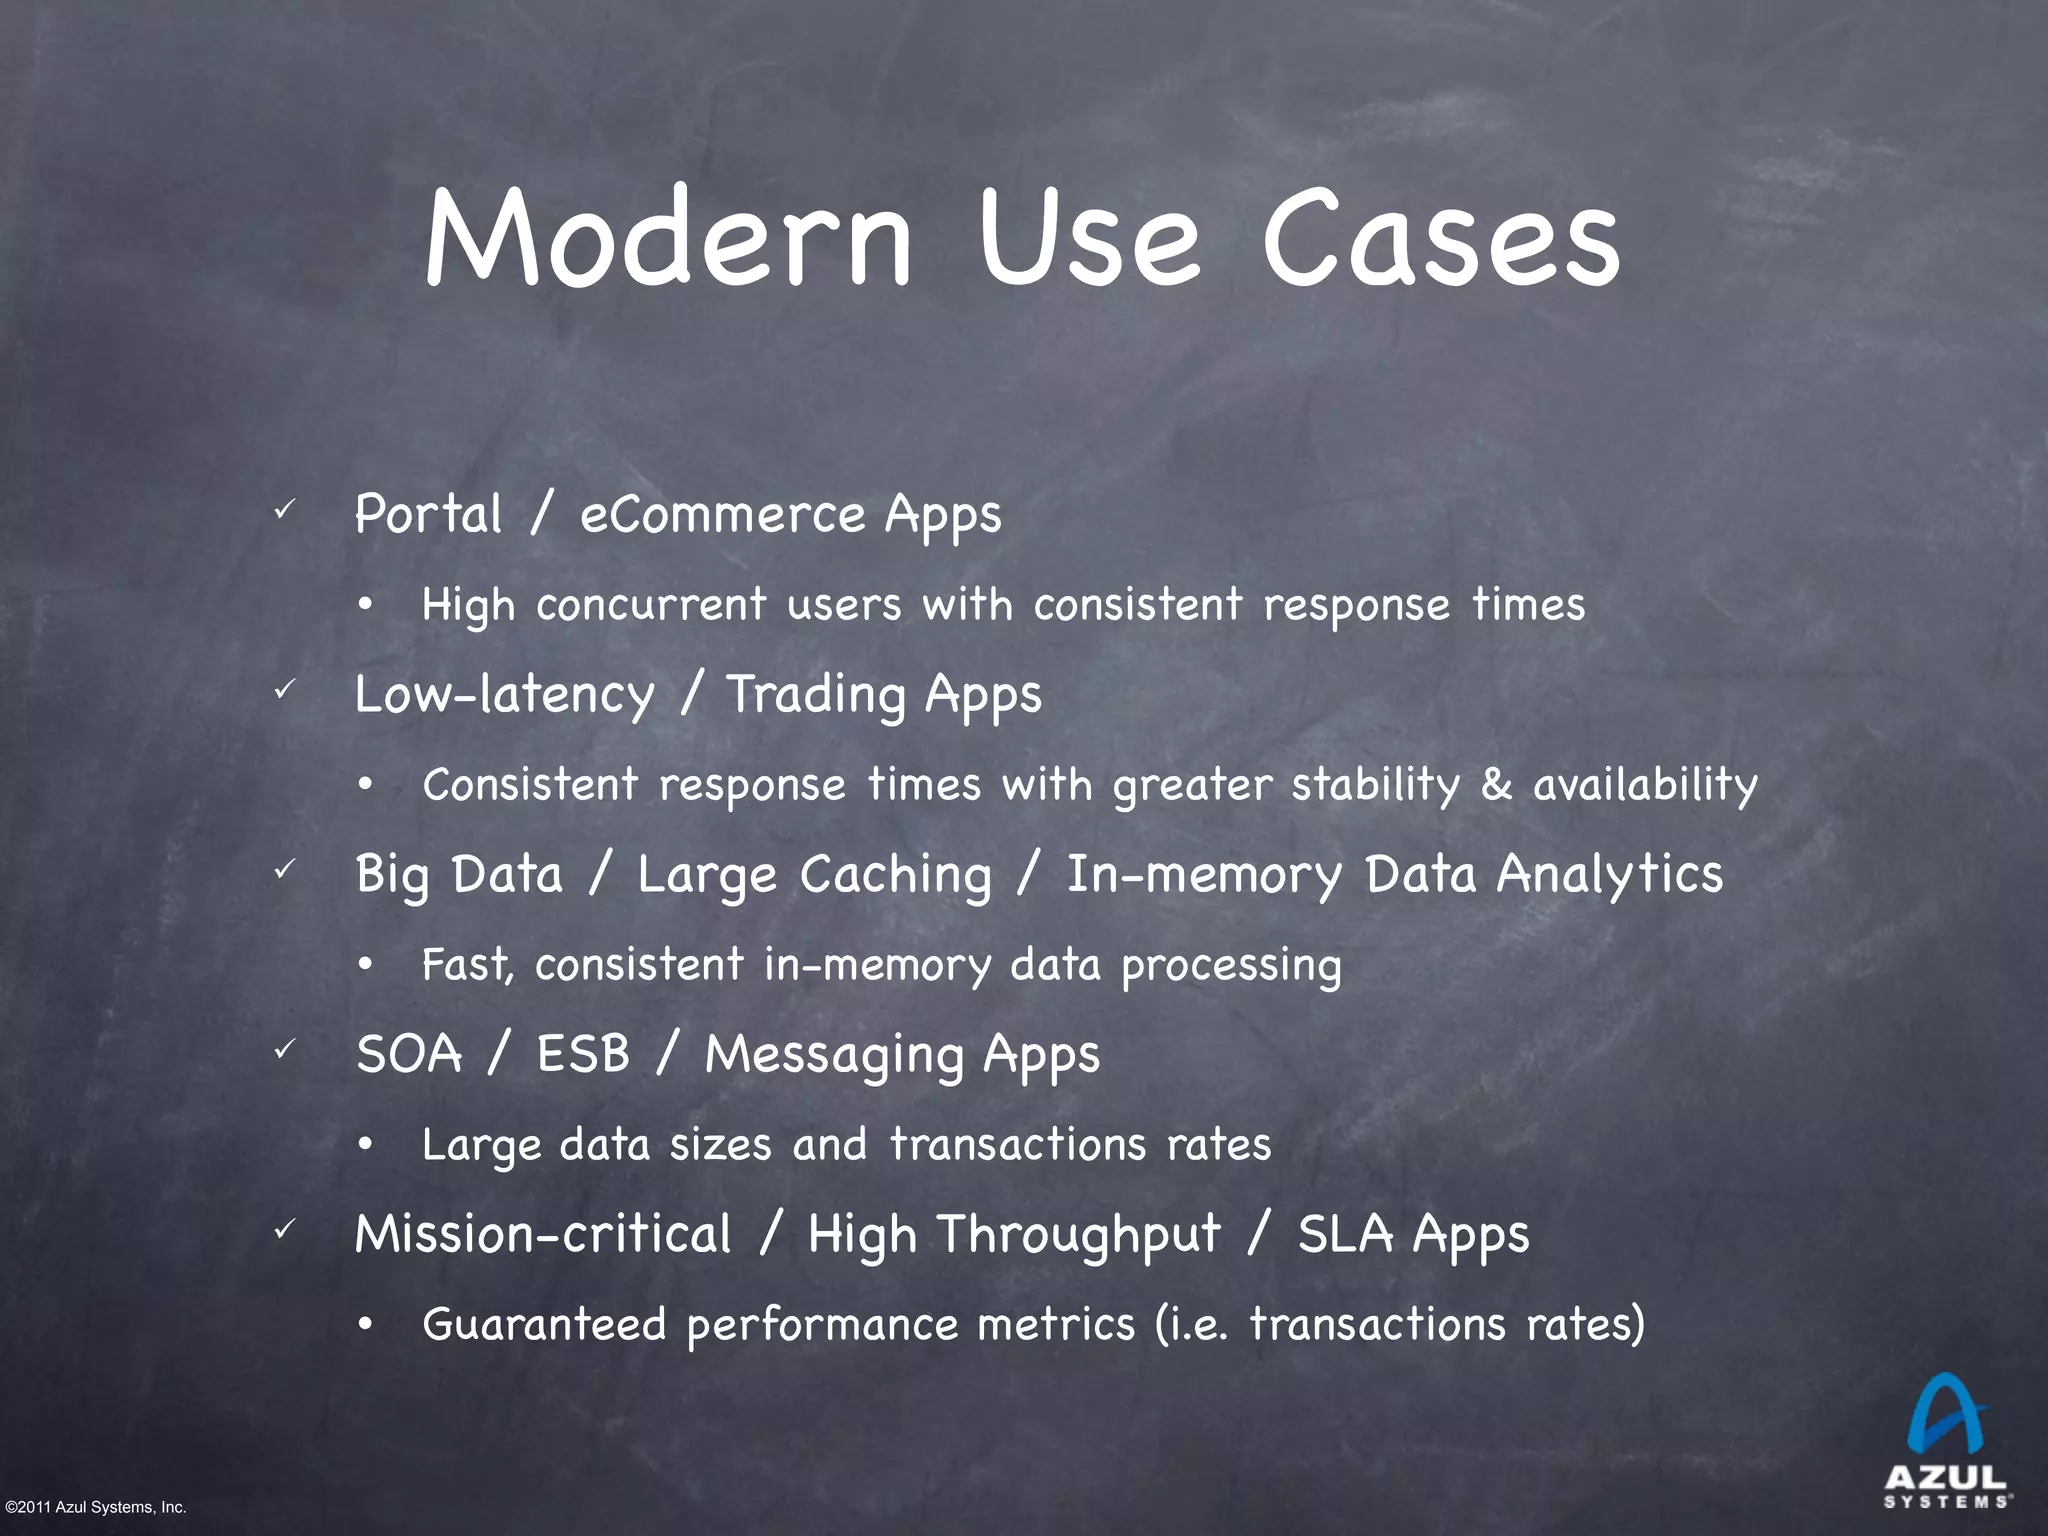
The document discusses the evolution of the Java platform and its limitations in effectively utilizing modern server capabilities, particularly due to issues with garbage collection. It introduces Azul's Zing JVM as a solution that addresses these shortcomings by improving responsiveness and scalability for applications. Additionally, it highlights the need for advancements in garbage collection techniques to handle high memory usage without impacting performance.


