Download as PDF, PPTX
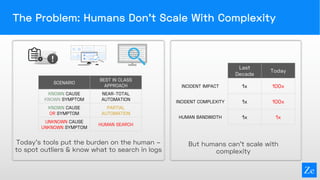
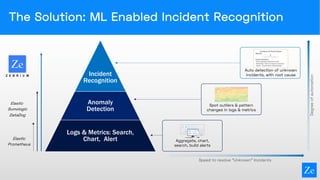
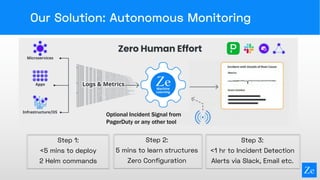


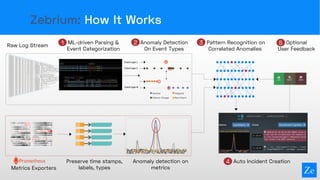


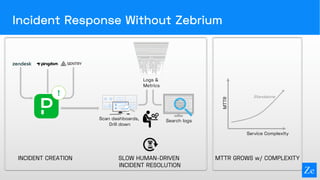
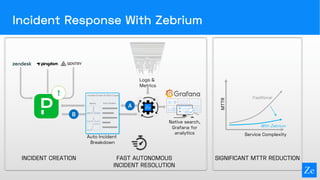
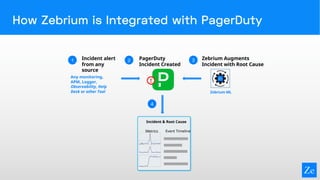
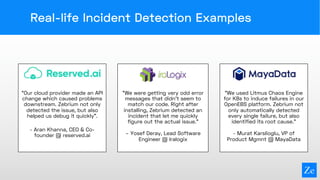


Zebrium provides an autonomous incident and root cause detection solution using machine learning to enhance incident recognition and reduce reliance on human intervention. The technology features rapid deployment, zero configuration, and efficient resolution of unknown incidents by automating incident detection and root cause analysis. This approach aims to significantly reduce mean time to recovery (MTTR) in complex service environments, as demonstrated through real-life user experiences.


![Bro, manage test data like a pro! [QA Fest 2018]](https://cdn.slidesharecdn.com/ss_thumbnails/bromanagetestdatalikeapro-180922193659-thumbnail.jpg?width=640&height=640&fit=bounds)