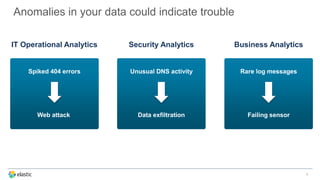
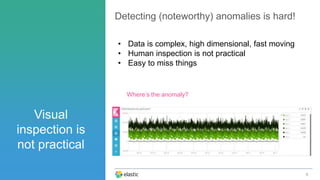
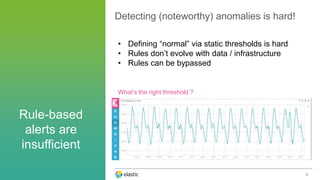
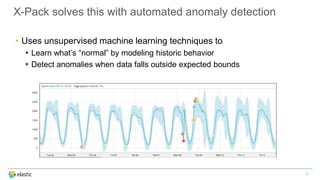
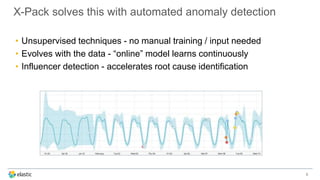
Henry Pak
Solutions Architect
Machine Learning for the Elastic Stack
Anomalies in your data could indicate trouble
1
Spiked 404 errors
Web attack
IT Operational Analytics Security Analytics Business Analytics
Unusual DNS activity
Data exfiltration
Rare log messages
Failing sensor
Operational Analytics
• Is my website seeing unusual traffic volume?
• Are bots or attackers visiting my website?
• Do I worry about the database errors in my logs?
Use Case
Security Analytics
• Has my system been compromised by malware?
• Could one of my users be an insider threat?
• Is there indication of data theft in my DNS logs?
Use Case
Telemetry / Sensors
 Is the unusual latency spike from a ISP outage?
 Which trucks in my fleet show unusual driving pattern?
 Does this rare event type indicate a failing sensor?
Use Case
5
Detecting (noteworthy) anomalies is hard!
• Data is complex, high dimensional, fast moving
• Human inspection is not practical
• Easy to miss things
Visual
inspection is
not practical
Where’s the anomaly?
6
Detecting (noteworthy) anomalies is hard!
• Defining “normal” via static thresholds is hard
• Rules don’t evolve with data / infrastructure
• Rules can be bypassed
Rule-based
alerts are
insufficient
What’s the right threshold ?
X-Pack solves this with automated anomaly detection
• Uses unsupervised machine learning techniques to
 Learn what’s “normal” by modeling historic behavior
 Detect anomalies when data falls outside expected bounds
7
X-Pack solves this with automated anomaly detection
• Unsupervised techniques - no manual training / input needed
• Evolves with the data - “online” model learns continuously
• Influencer detection - accelerates root cause identification
8
Detect anomalies of different types
• Time series - single / multiple
• Outliers in population (using entity profiling)
• Rare / unusual rates in “categories” of events
9
Anomalies in temporal pattern
• Single (univariate) time series
Example: Is there unusual traffic on website ?
10
Time
Metric
Anomalies in temporal pattern
• Multiple time series
 Multiple metrics
 Single metric split by a field;
• Each series modeled
independently
Example:
Is there unusual web activity
from any country?
11
Time
Metric
USAUKFranceChina
Outliers in population (using entity profiling)
• Create a profile for a “typical” entity (server, user, IP, etc.) in a population
• Detects entities (outlier) that deviate from the typical profile
Example:
• Which IP address is not like the others?
(indication of a bot / attacker)
12
Outliers in population (using entity profiling)
• Create a profile for a “typical” entity (server, user, IP, etc.) in a population
• Detects entities (outlier) that deviate from the typical profile
Example:
• Which IP address is not like the others?
(indication of a bot / attacker)
13
Unusual or rare events (via log categorization)
14
• Classify raw messages into groups based on similarity
• Models frequencies of each message category over time
• Spot anomalous in message groups
Example:
• Do my application logs contain unusual messages
DEMO
15

Anomaly Detection in Time-Series Data using the Elastic Stack by Henry Pak

  • 1.
    Henry Pak Solutions Architect MachineLearning for the Elastic Stack
  • 2.
    Anomalies in yourdata could indicate trouble 1 Spiked 404 errors Web attack IT Operational Analytics Security Analytics Business Analytics Unusual DNS activity Data exfiltration Rare log messages Failing sensor
  • 3.
    Operational Analytics • Ismy website seeing unusual traffic volume? • Are bots or attackers visiting my website? • Do I worry about the database errors in my logs? Use Case
  • 4.
    Security Analytics • Hasmy system been compromised by malware? • Could one of my users be an insider threat? • Is there indication of data theft in my DNS logs? Use Case
  • 5.
    Telemetry / Sensors Is the unusual latency spike from a ISP outage?  Which trucks in my fleet show unusual driving pattern?  Does this rare event type indicate a failing sensor? Use Case
  • 6.
    5 Detecting (noteworthy) anomaliesis hard! • Data is complex, high dimensional, fast moving • Human inspection is not practical • Easy to miss things Visual inspection is not practical Where’s the anomaly?
  • 7.
    6 Detecting (noteworthy) anomaliesis hard! • Defining “normal” via static thresholds is hard • Rules don’t evolve with data / infrastructure • Rules can be bypassed Rule-based alerts are insufficient What’s the right threshold ?
  • 8.
    X-Pack solves thiswith automated anomaly detection • Uses unsupervised machine learning techniques to  Learn what’s “normal” by modeling historic behavior  Detect anomalies when data falls outside expected bounds 7
  • 9.
    X-Pack solves thiswith automated anomaly detection • Unsupervised techniques - no manual training / input needed • Evolves with the data - “online” model learns continuously • Influencer detection - accelerates root cause identification 8
  • 10.
    Detect anomalies ofdifferent types • Time series - single / multiple • Outliers in population (using entity profiling) • Rare / unusual rates in “categories” of events 9
  • 11.
    Anomalies in temporalpattern • Single (univariate) time series Example: Is there unusual traffic on website ? 10 Time Metric
  • 12.
    Anomalies in temporalpattern • Multiple time series  Multiple metrics  Single metric split by a field; • Each series modeled independently Example: Is there unusual web activity from any country? 11 Time Metric USAUKFranceChina
  • 13.
    Outliers in population(using entity profiling) • Create a profile for a “typical” entity (server, user, IP, etc.) in a population • Detects entities (outlier) that deviate from the typical profile Example: • Which IP address is not like the others? (indication of a bot / attacker) 12
  • 14.
    Outliers in population(using entity profiling) • Create a profile for a “typical” entity (server, user, IP, etc.) in a population • Detects entities (outlier) that deviate from the typical profile Example: • Which IP address is not like the others? (indication of a bot / attacker) 13
  • 15.
    Unusual or rareevents (via log categorization) 14 • Classify raw messages into groups based on similarity • Models frequencies of each message category over time • Spot anomalous in message groups Example: • Do my application logs contain unusual messages
  • 16.