Download to read offline


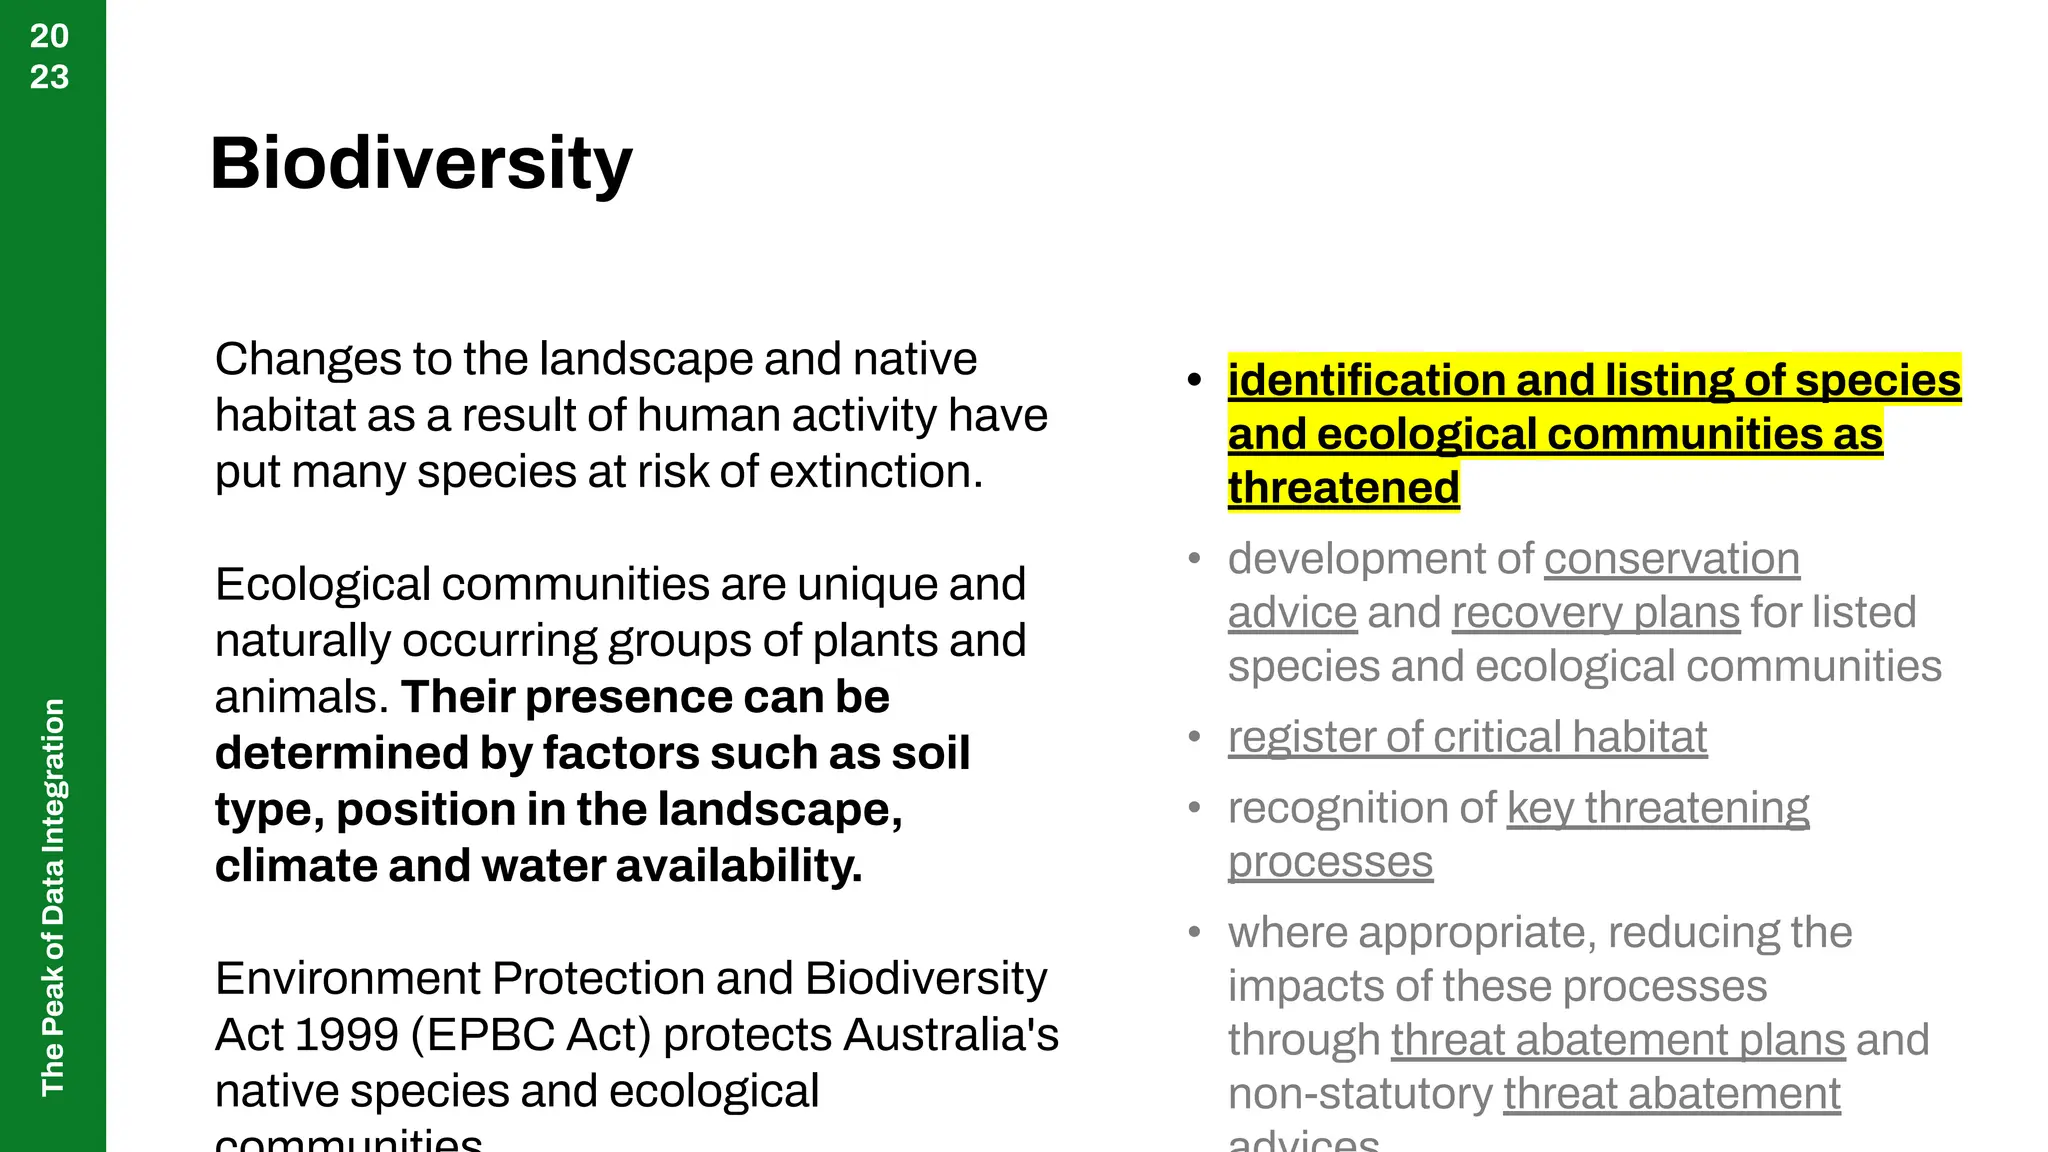

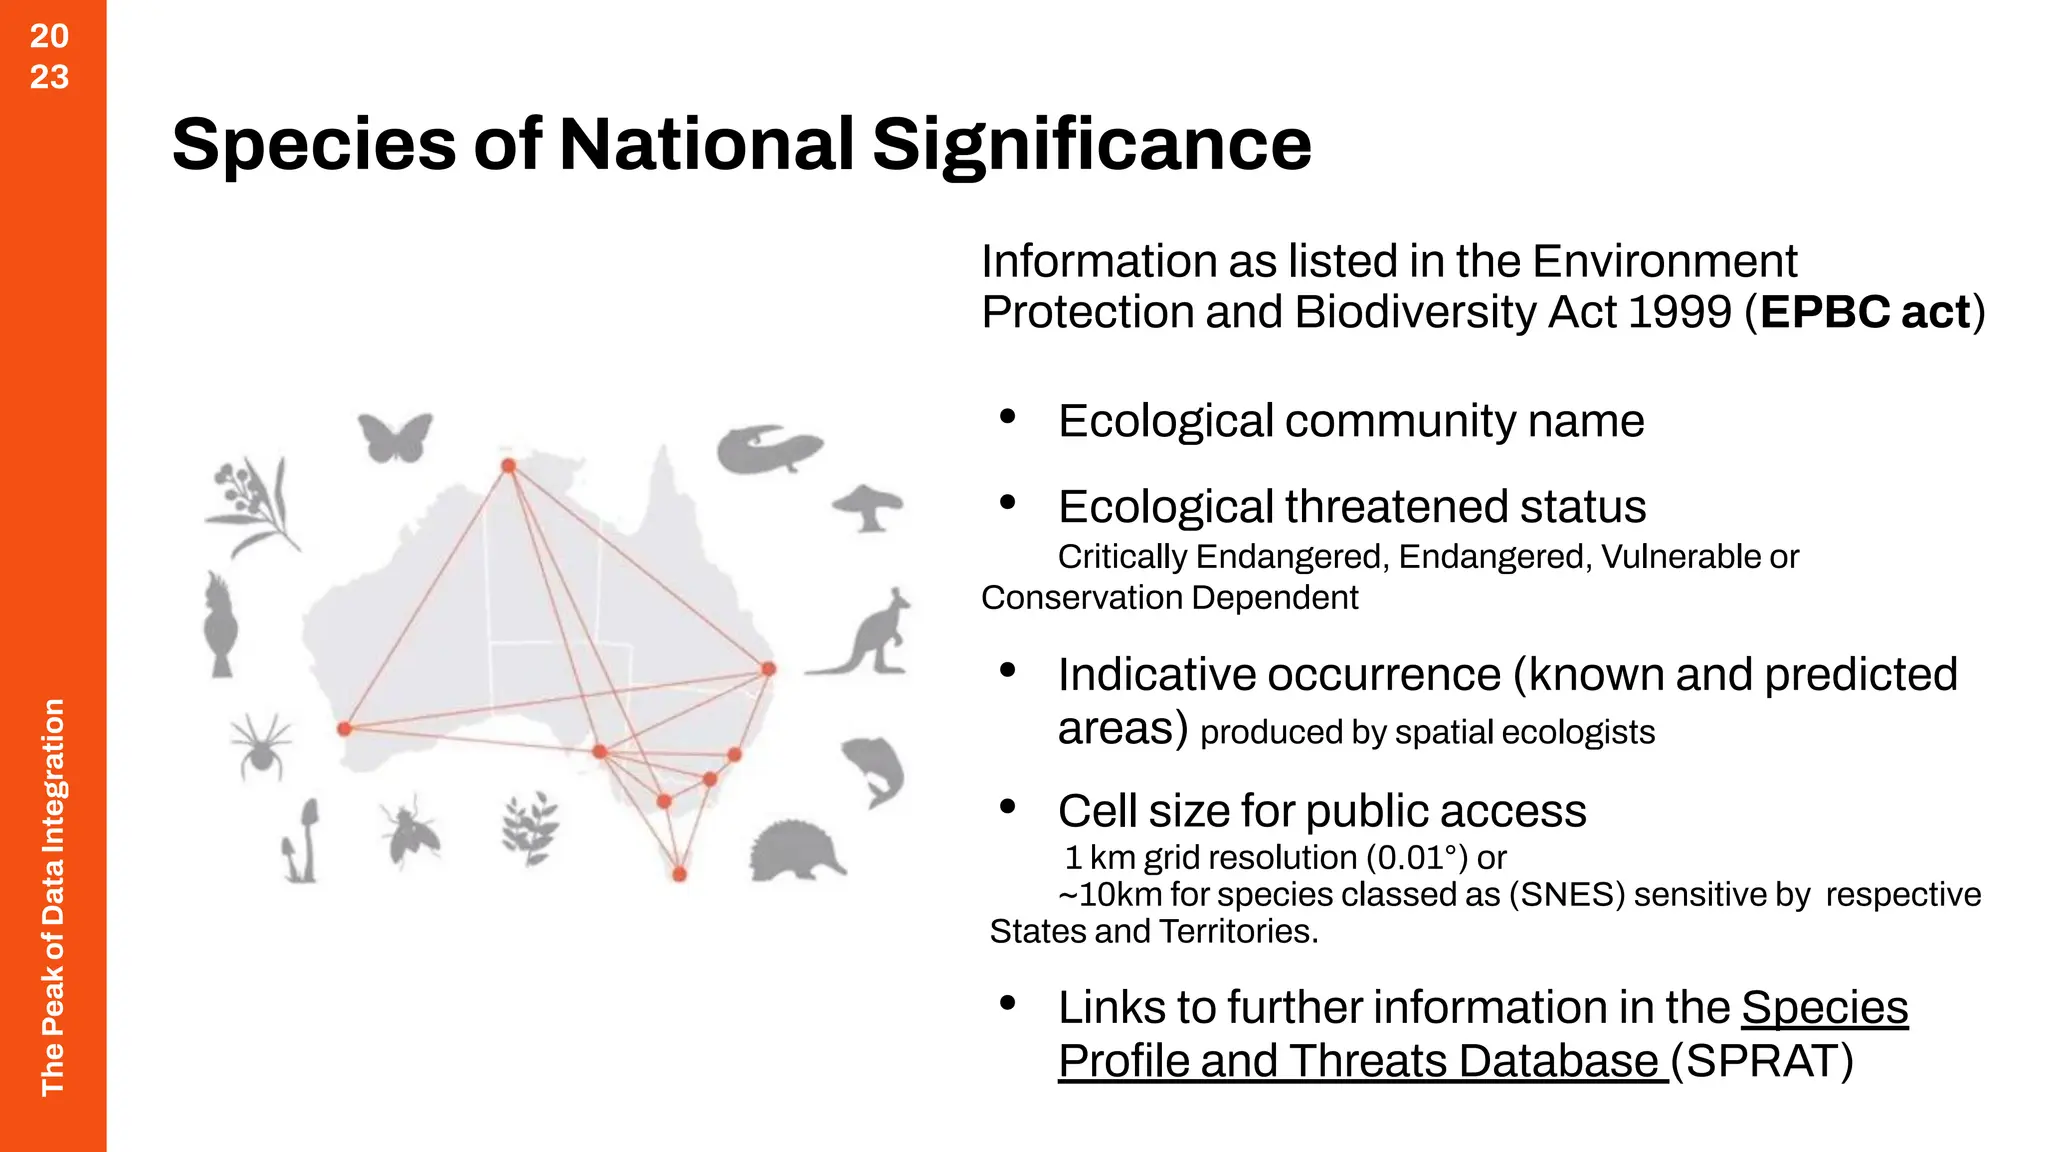
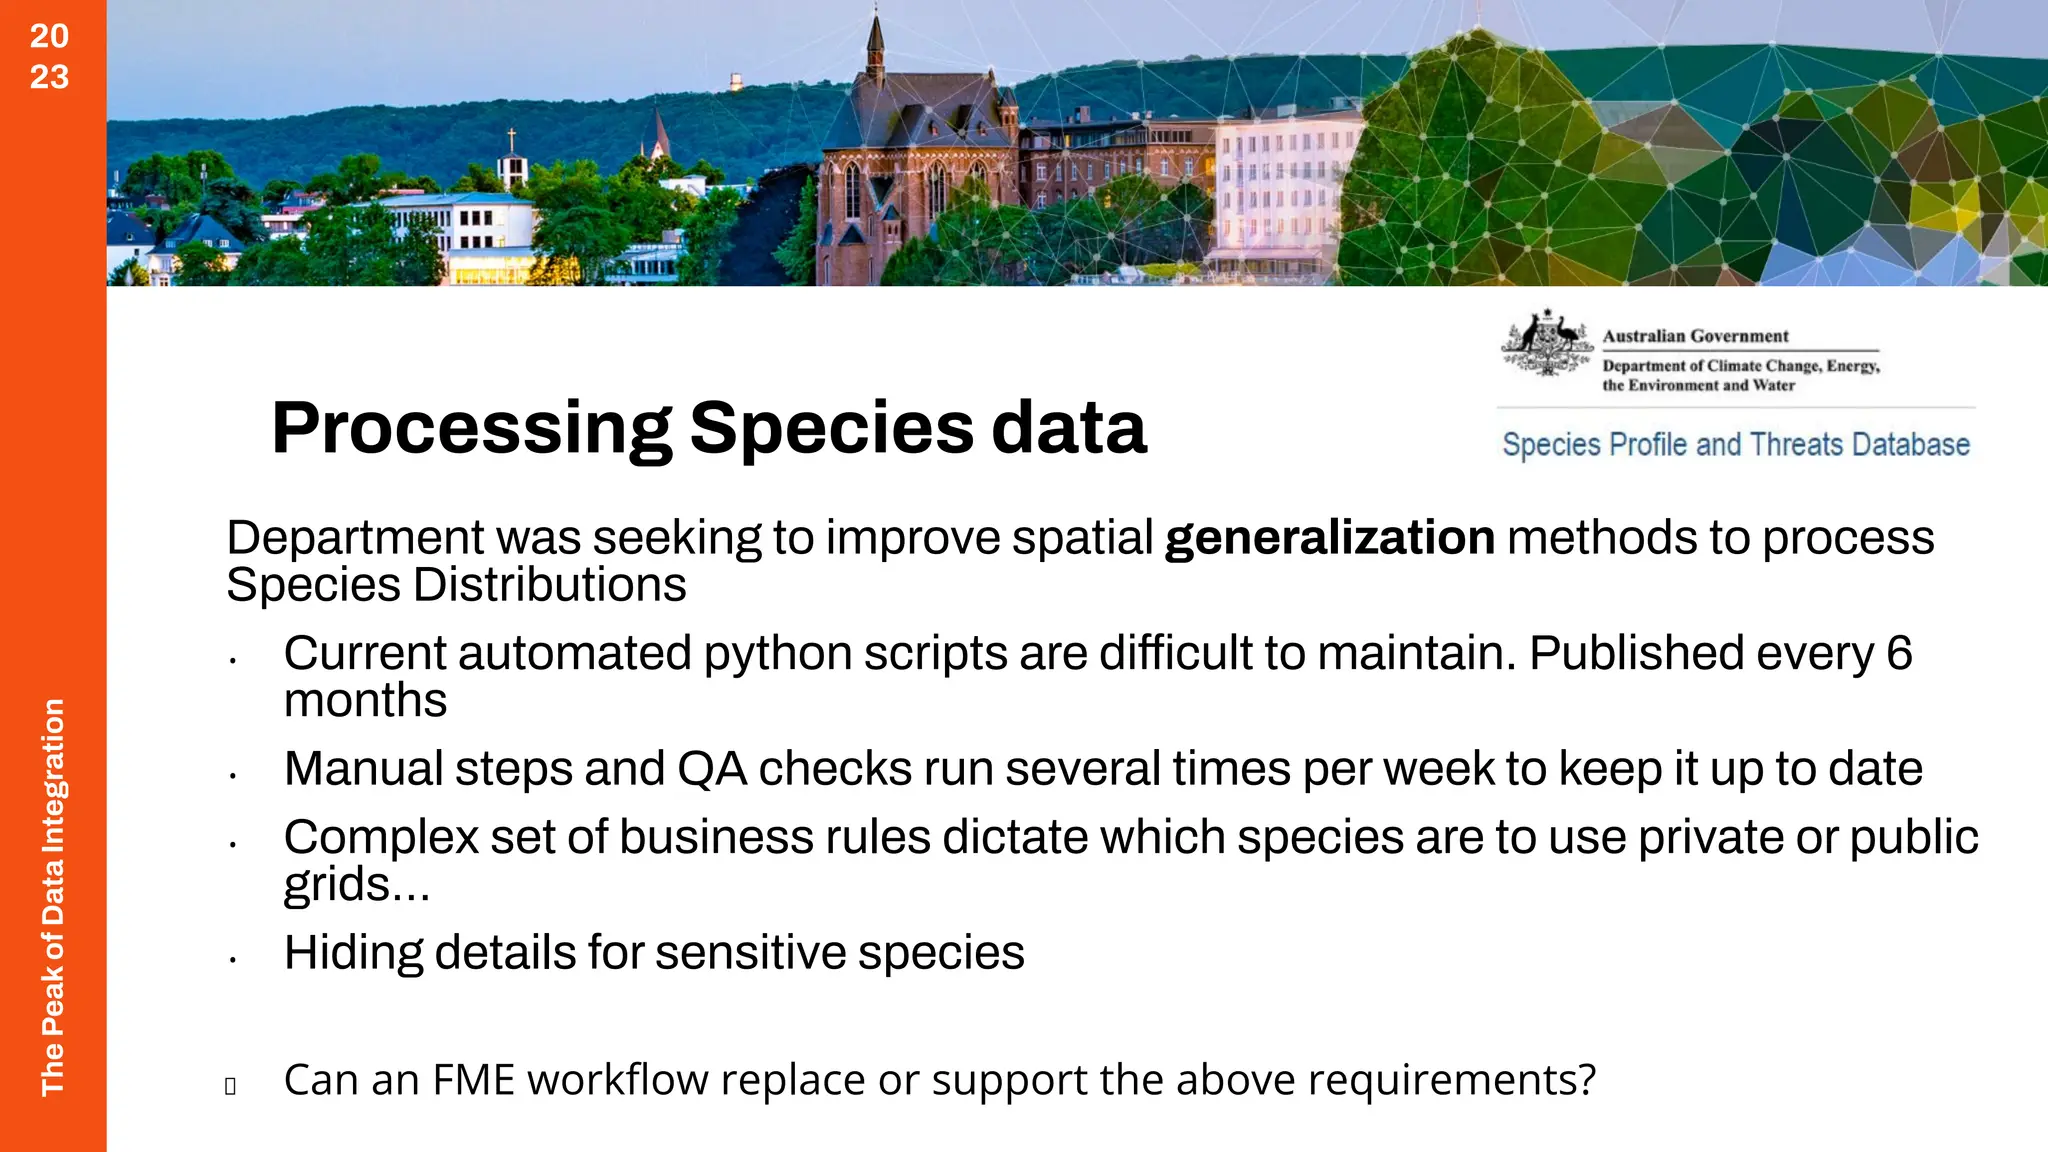

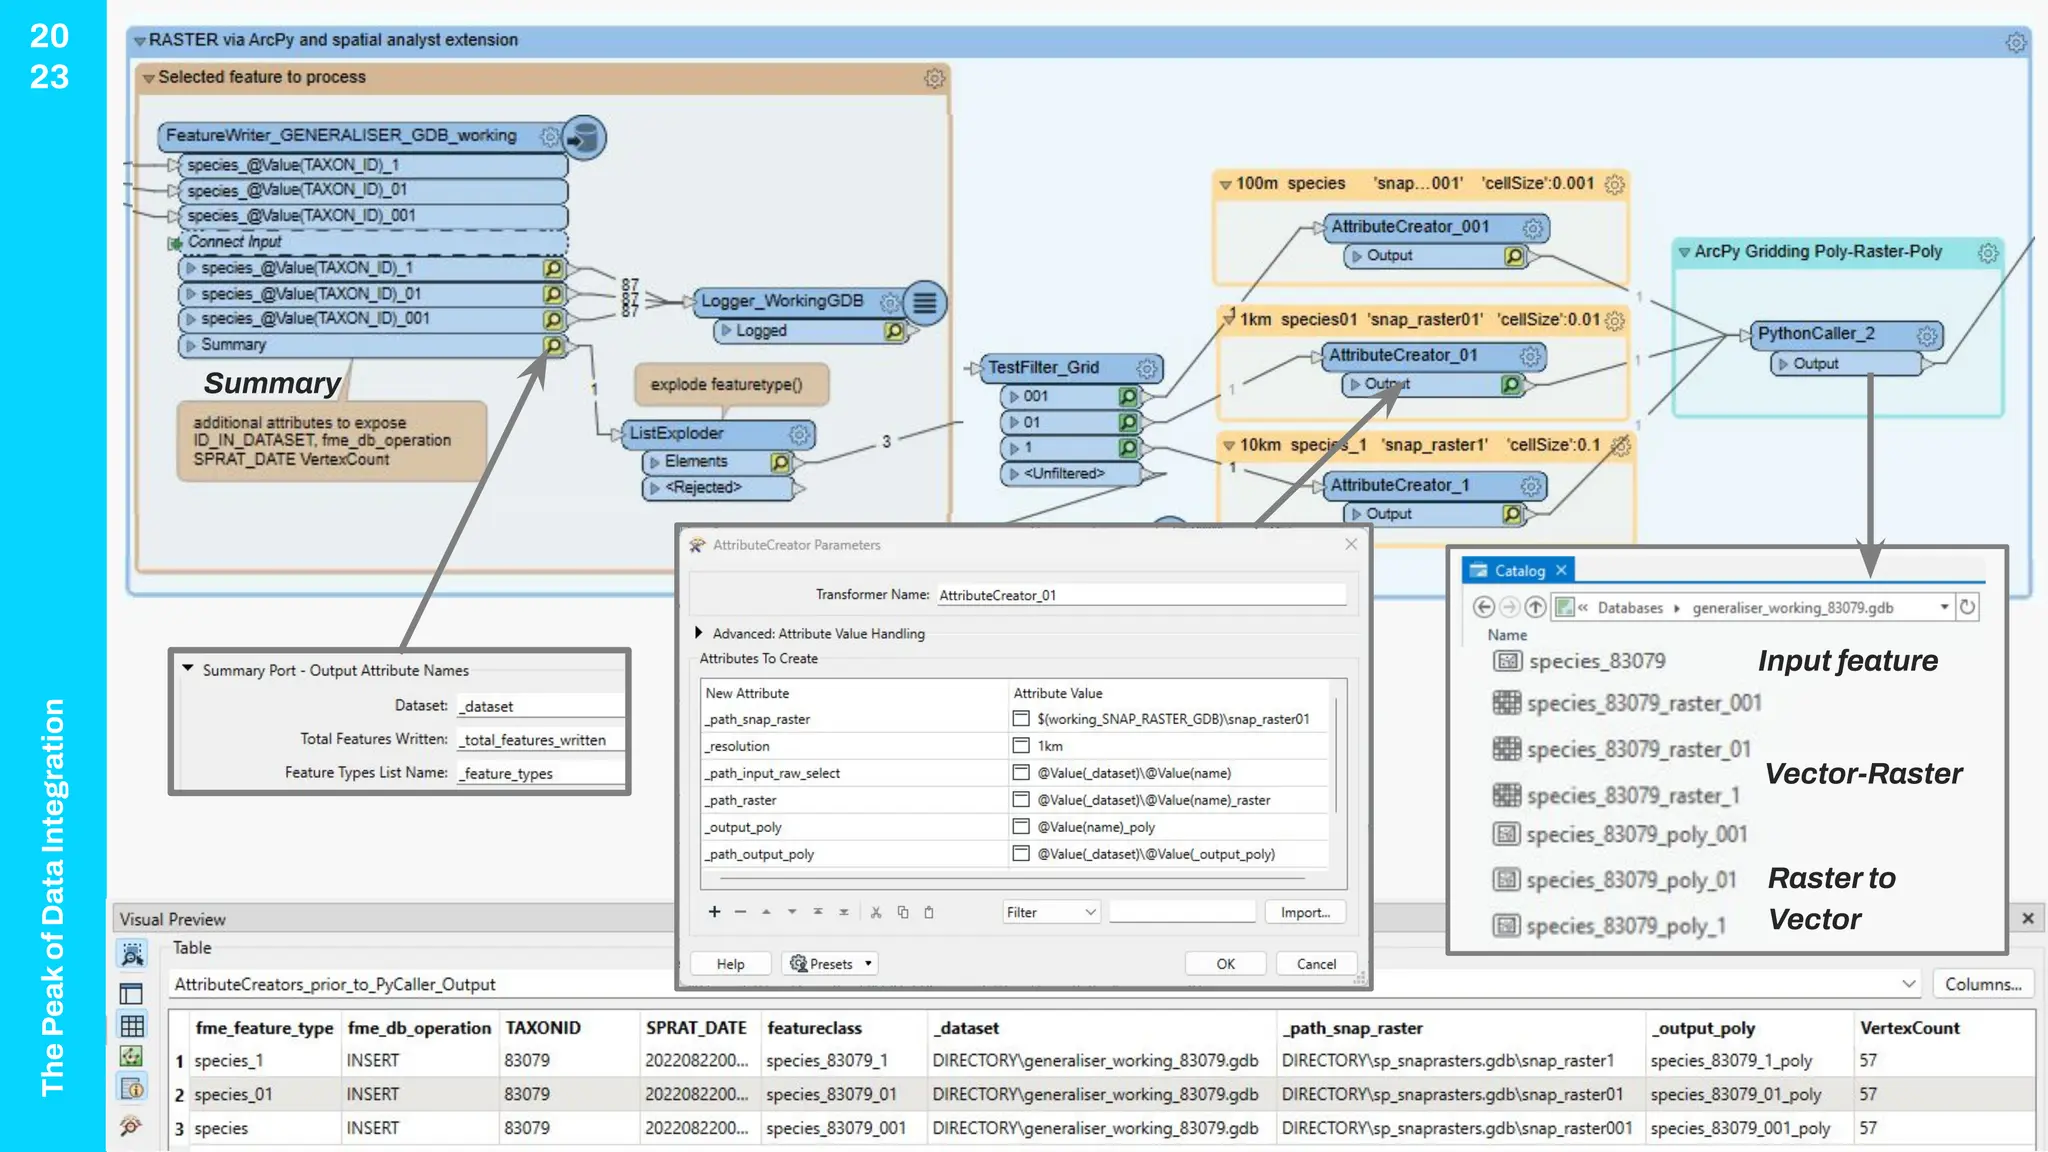
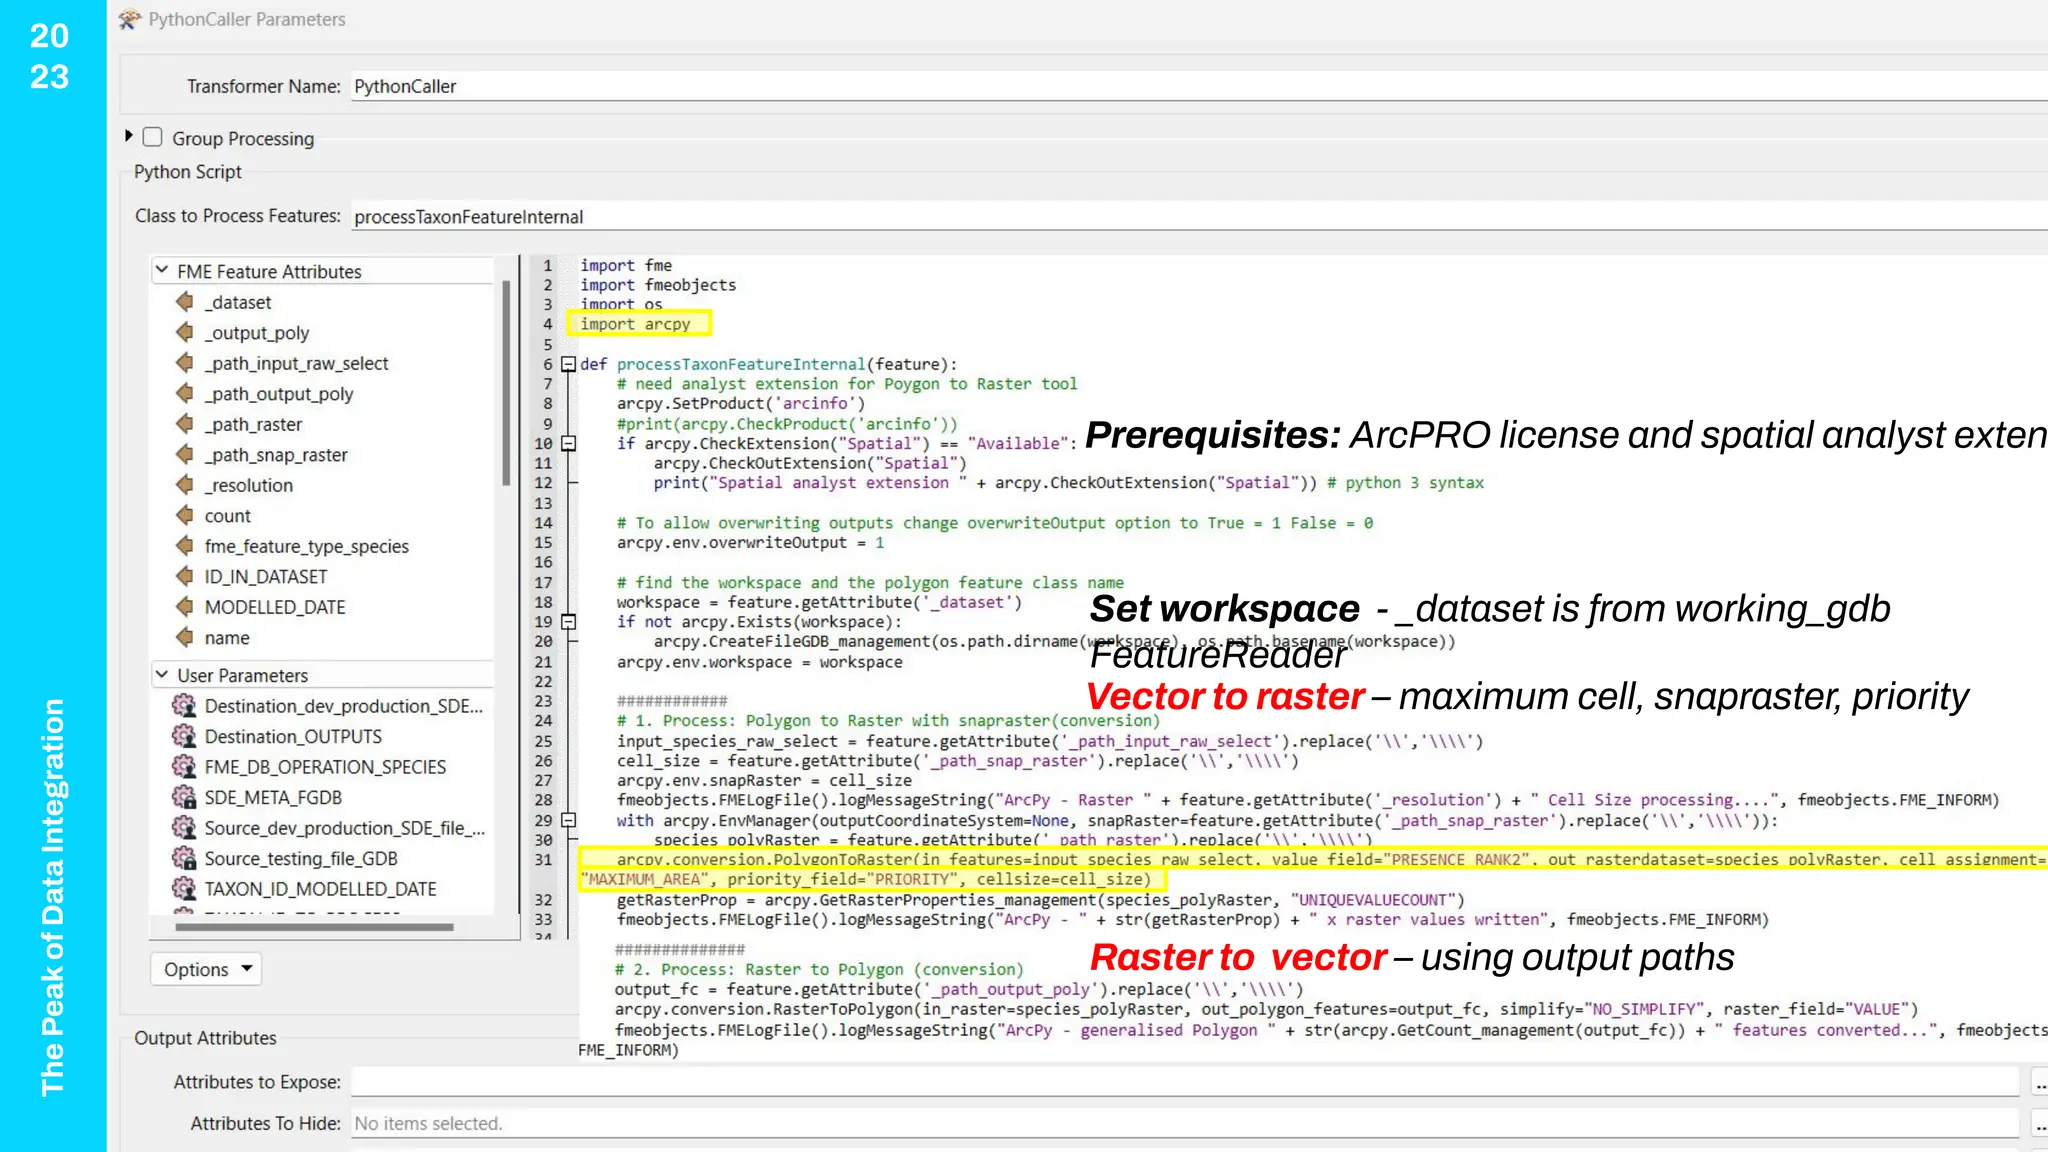
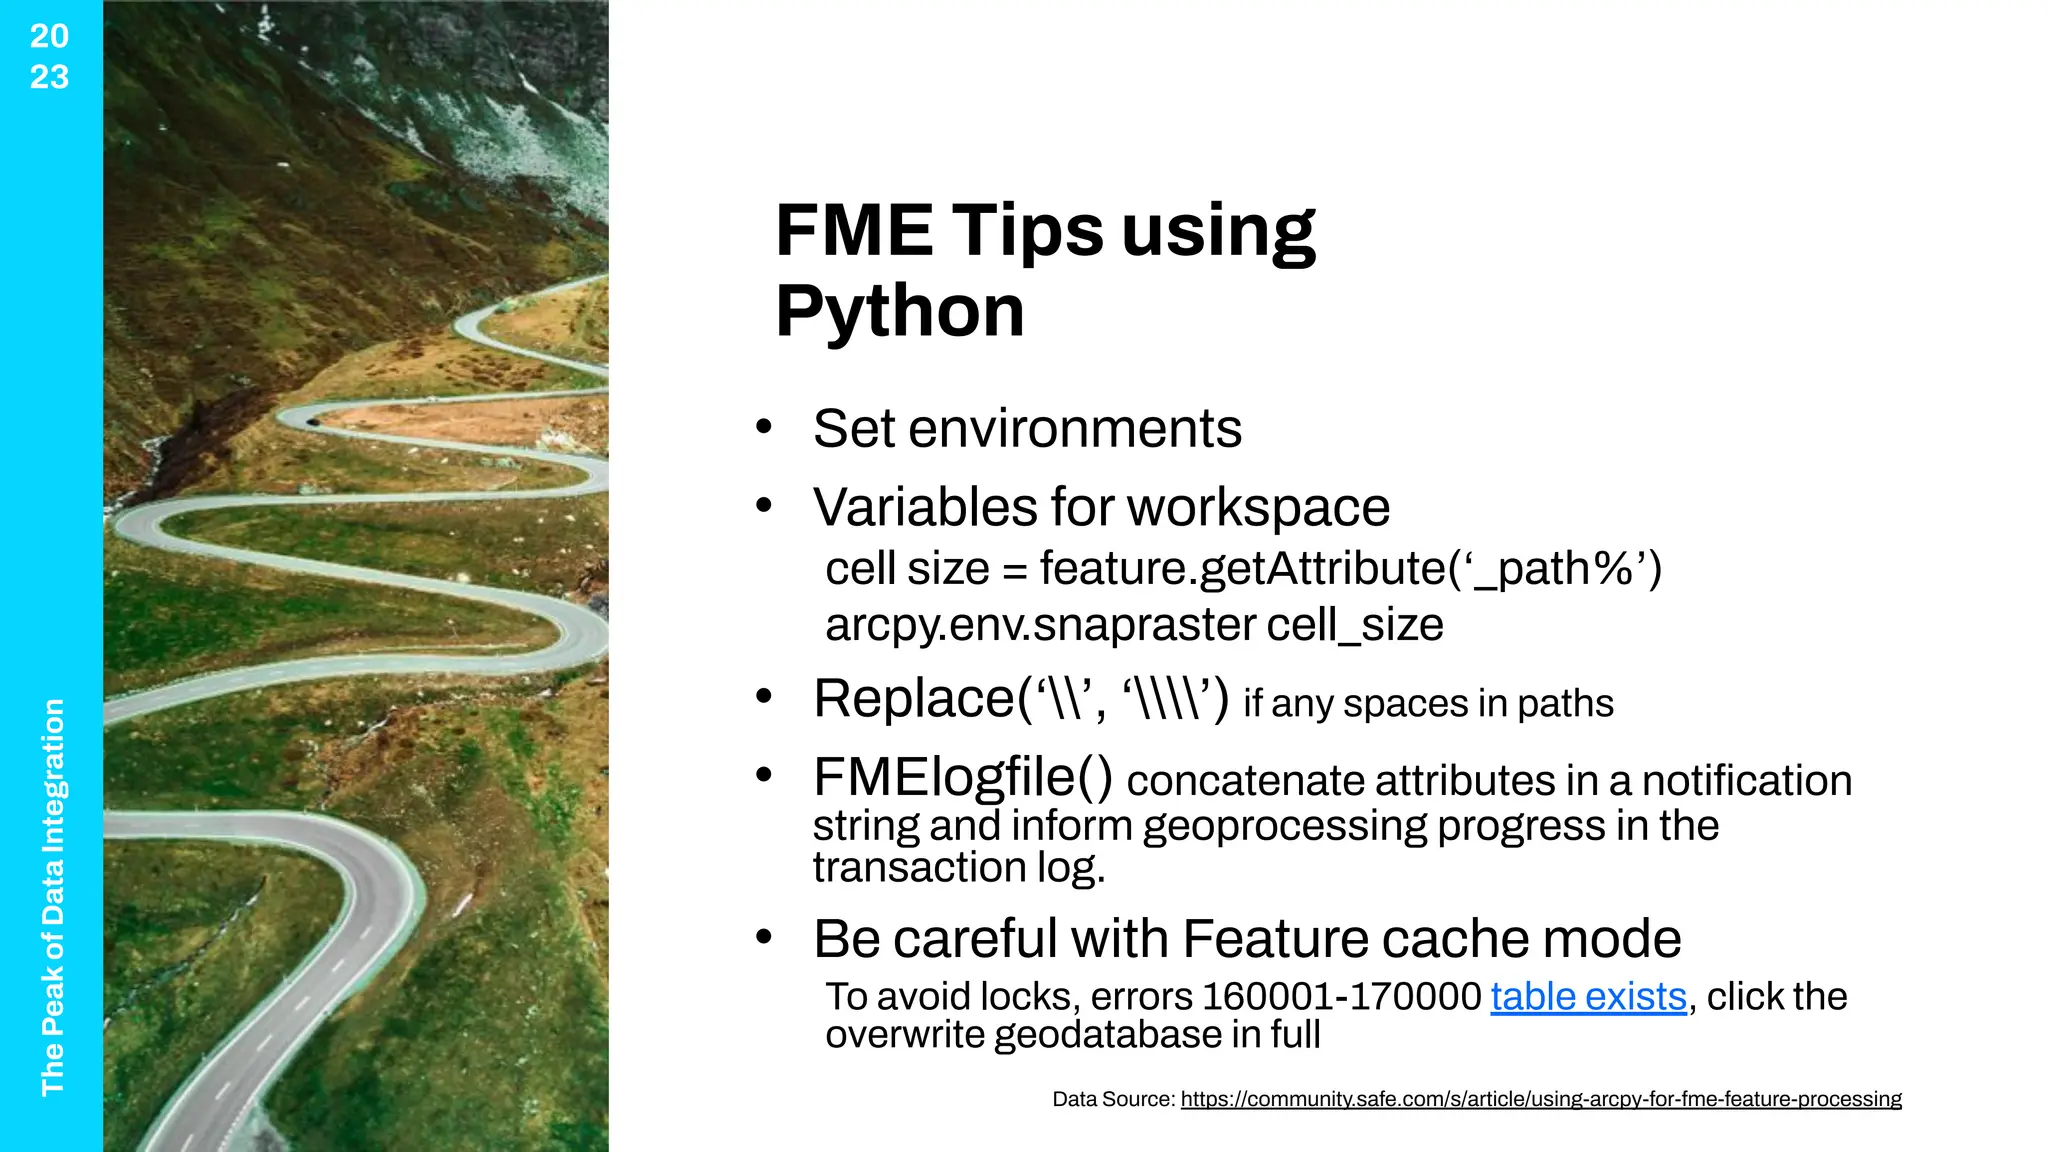

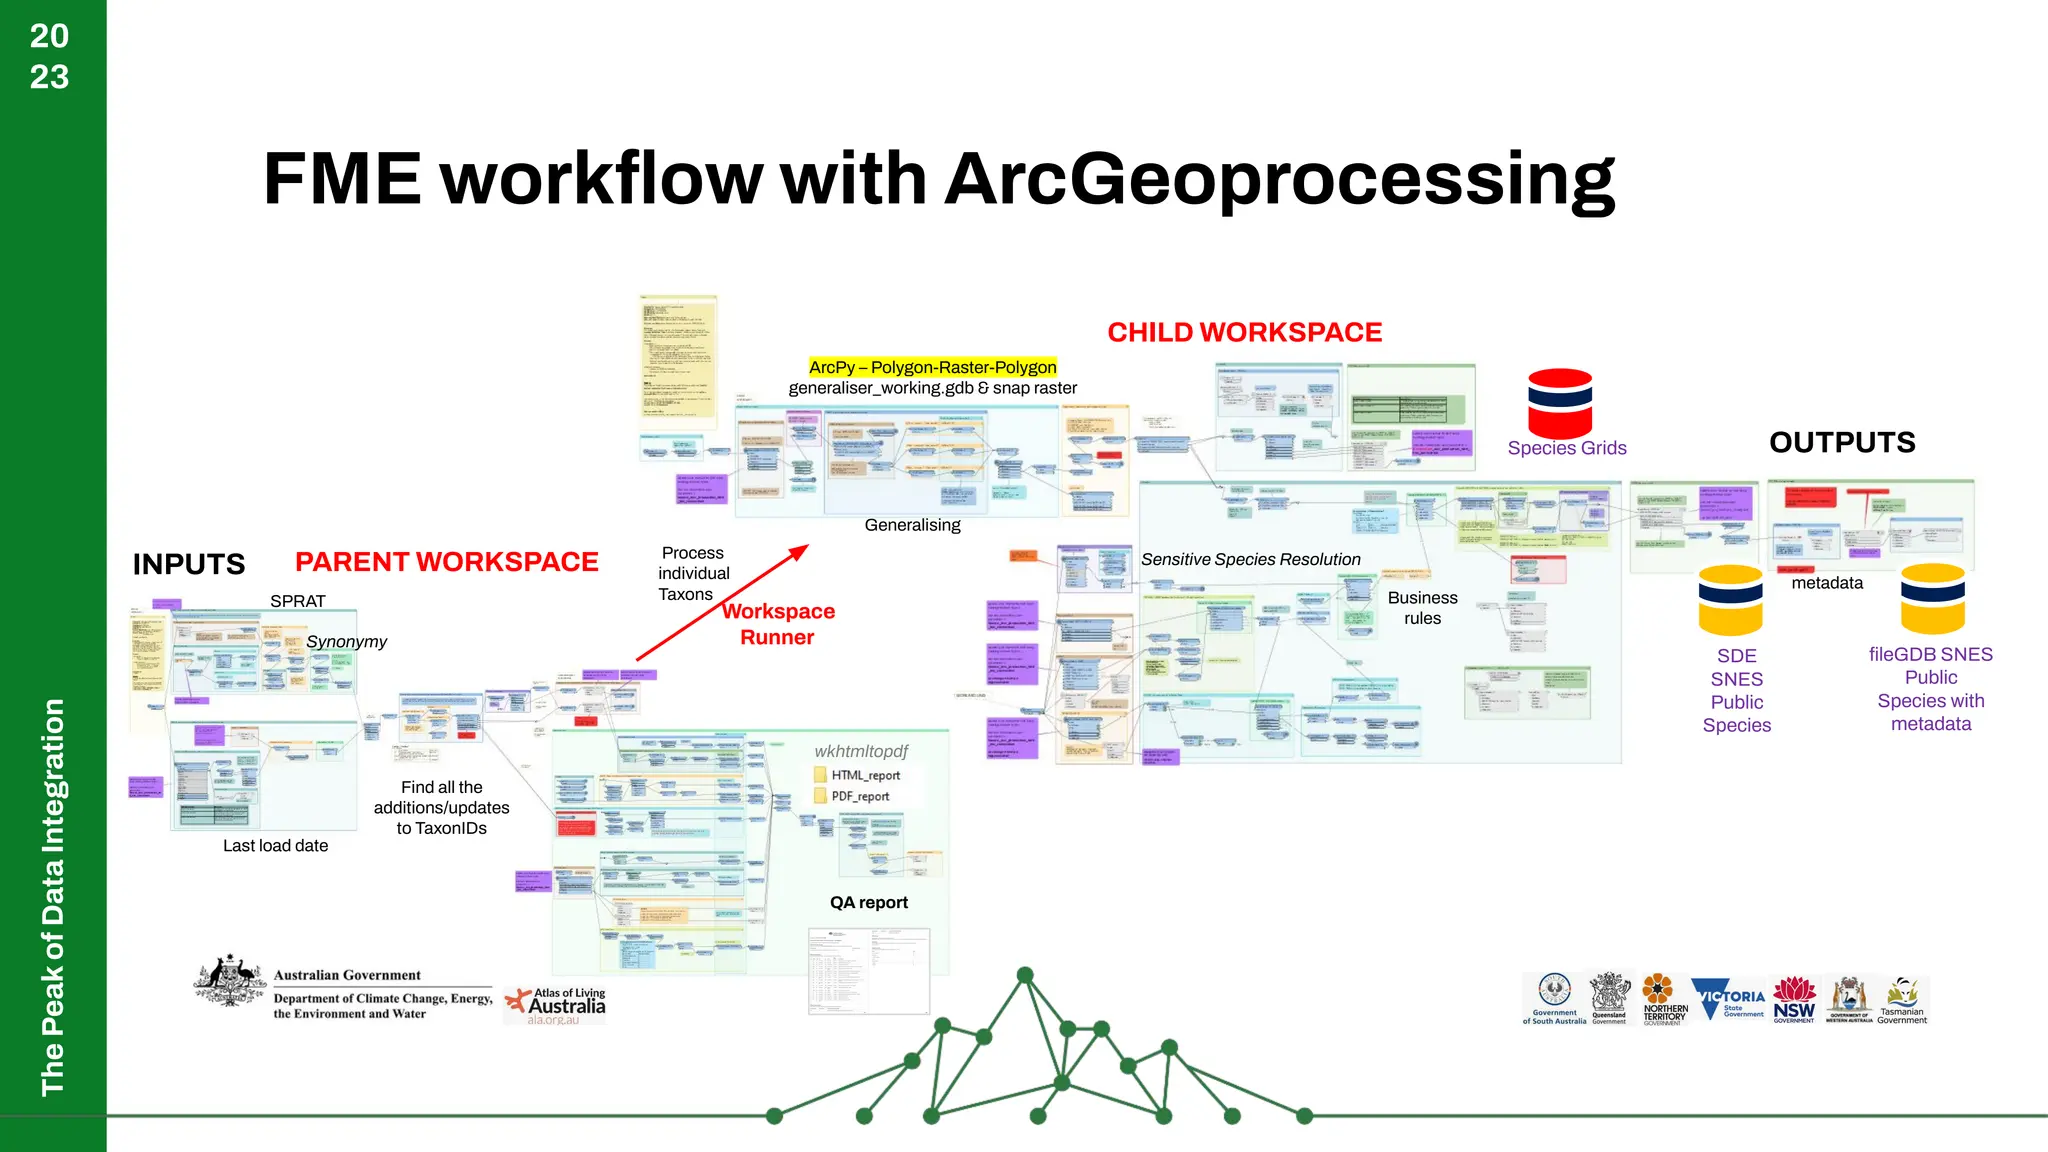


The document discusses the integration of species data within Australia, focusing on the impact of human activity on native species and the need for improved spatial generalization methods in data processing. It highlights the use of FME and ArcPy in processing species distributions, including case studies on raster gridding and vector to raster conversions. The document also outlines the challenges faced with current automated scripts and suggests best practices for using these technologies to enhance processing workflows.