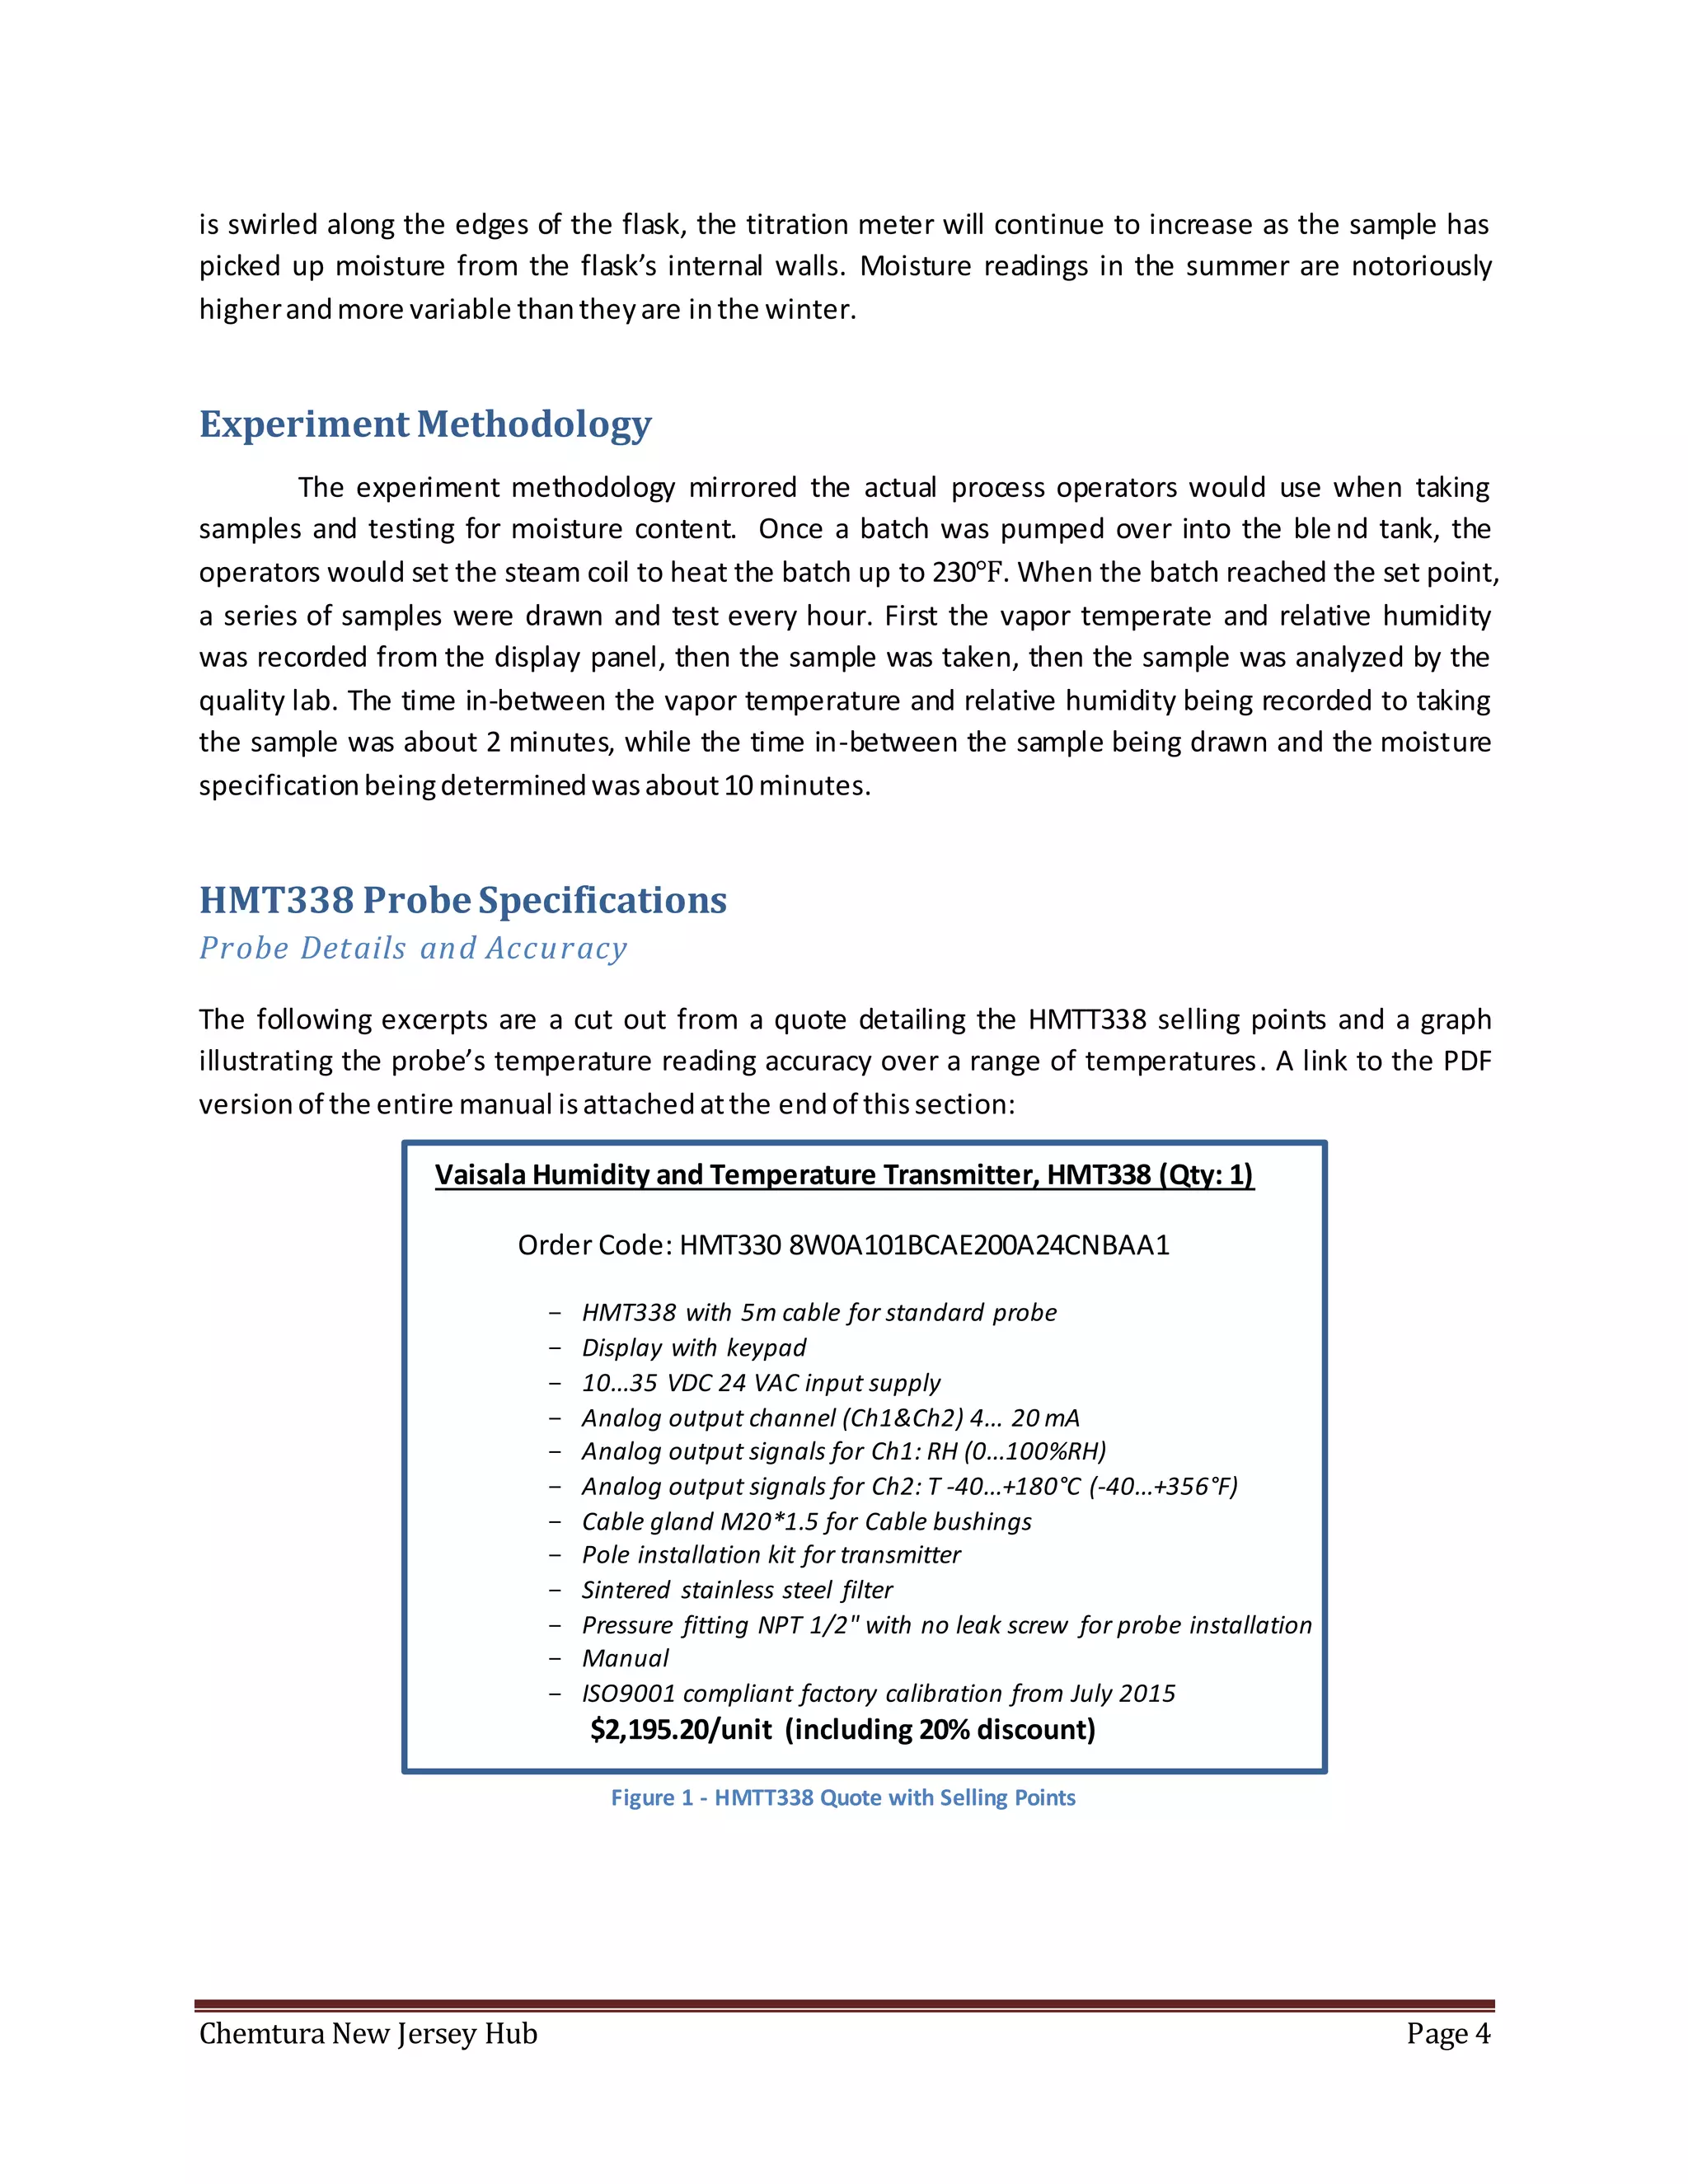
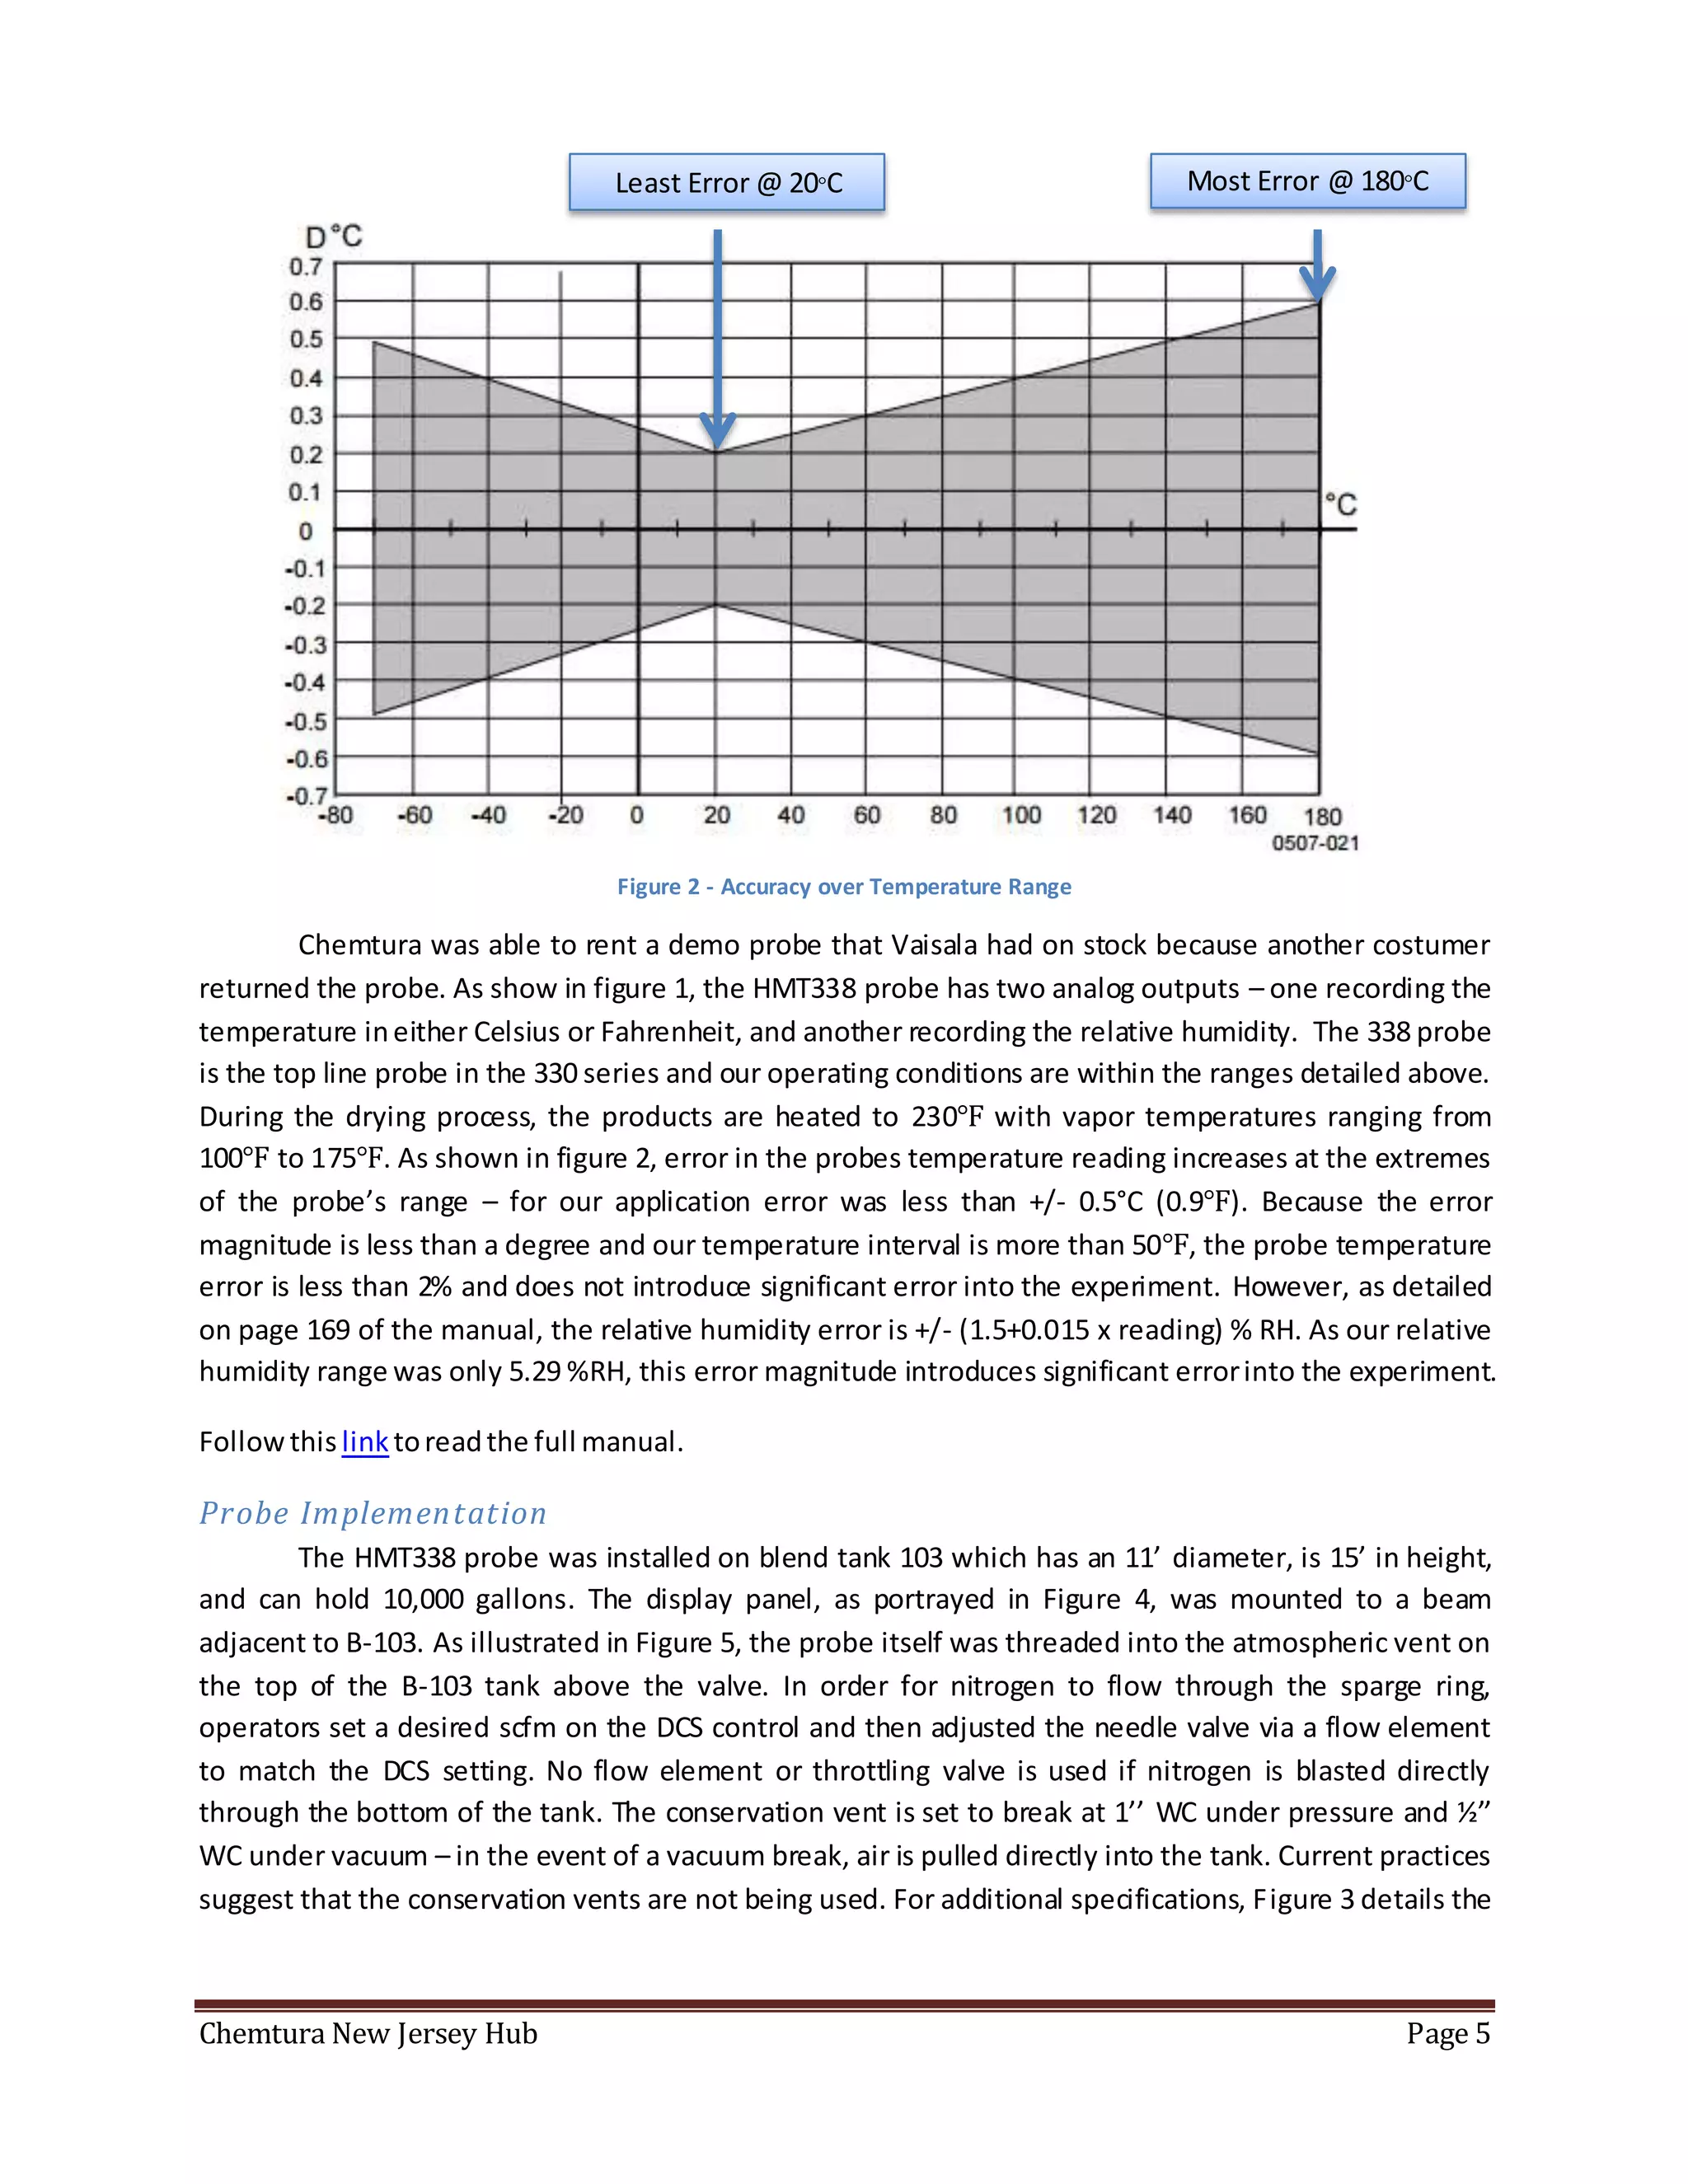
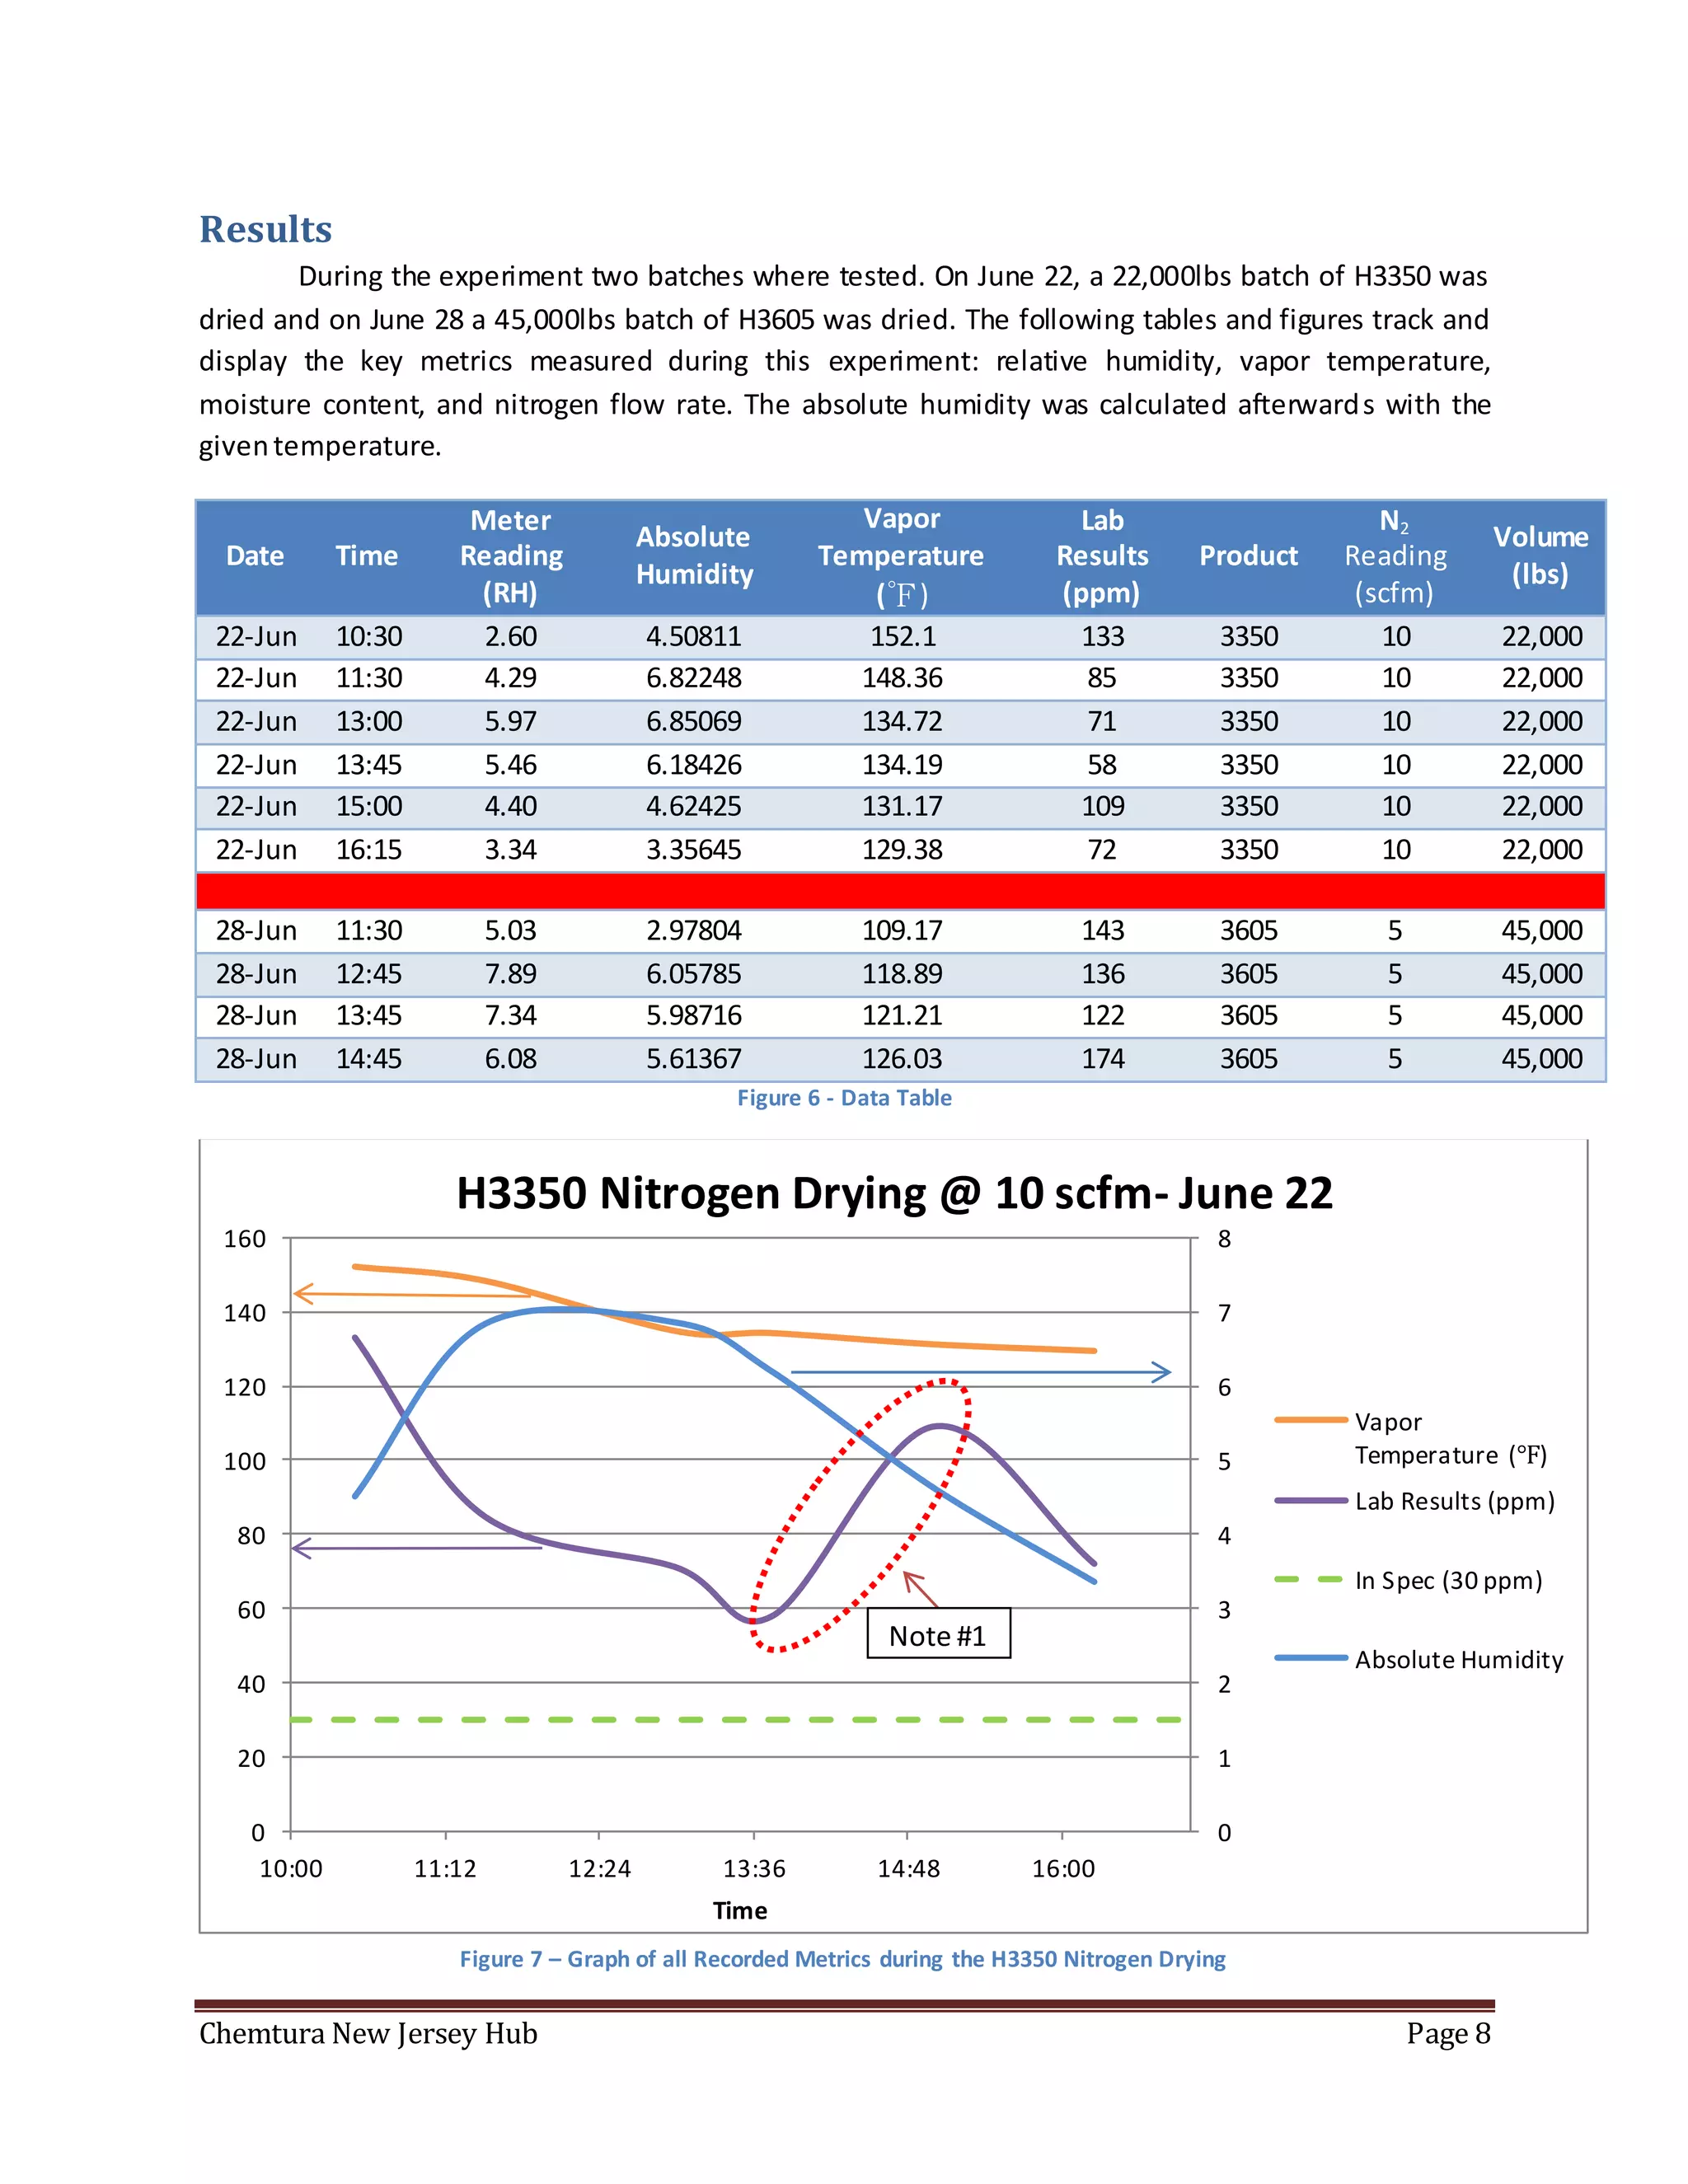
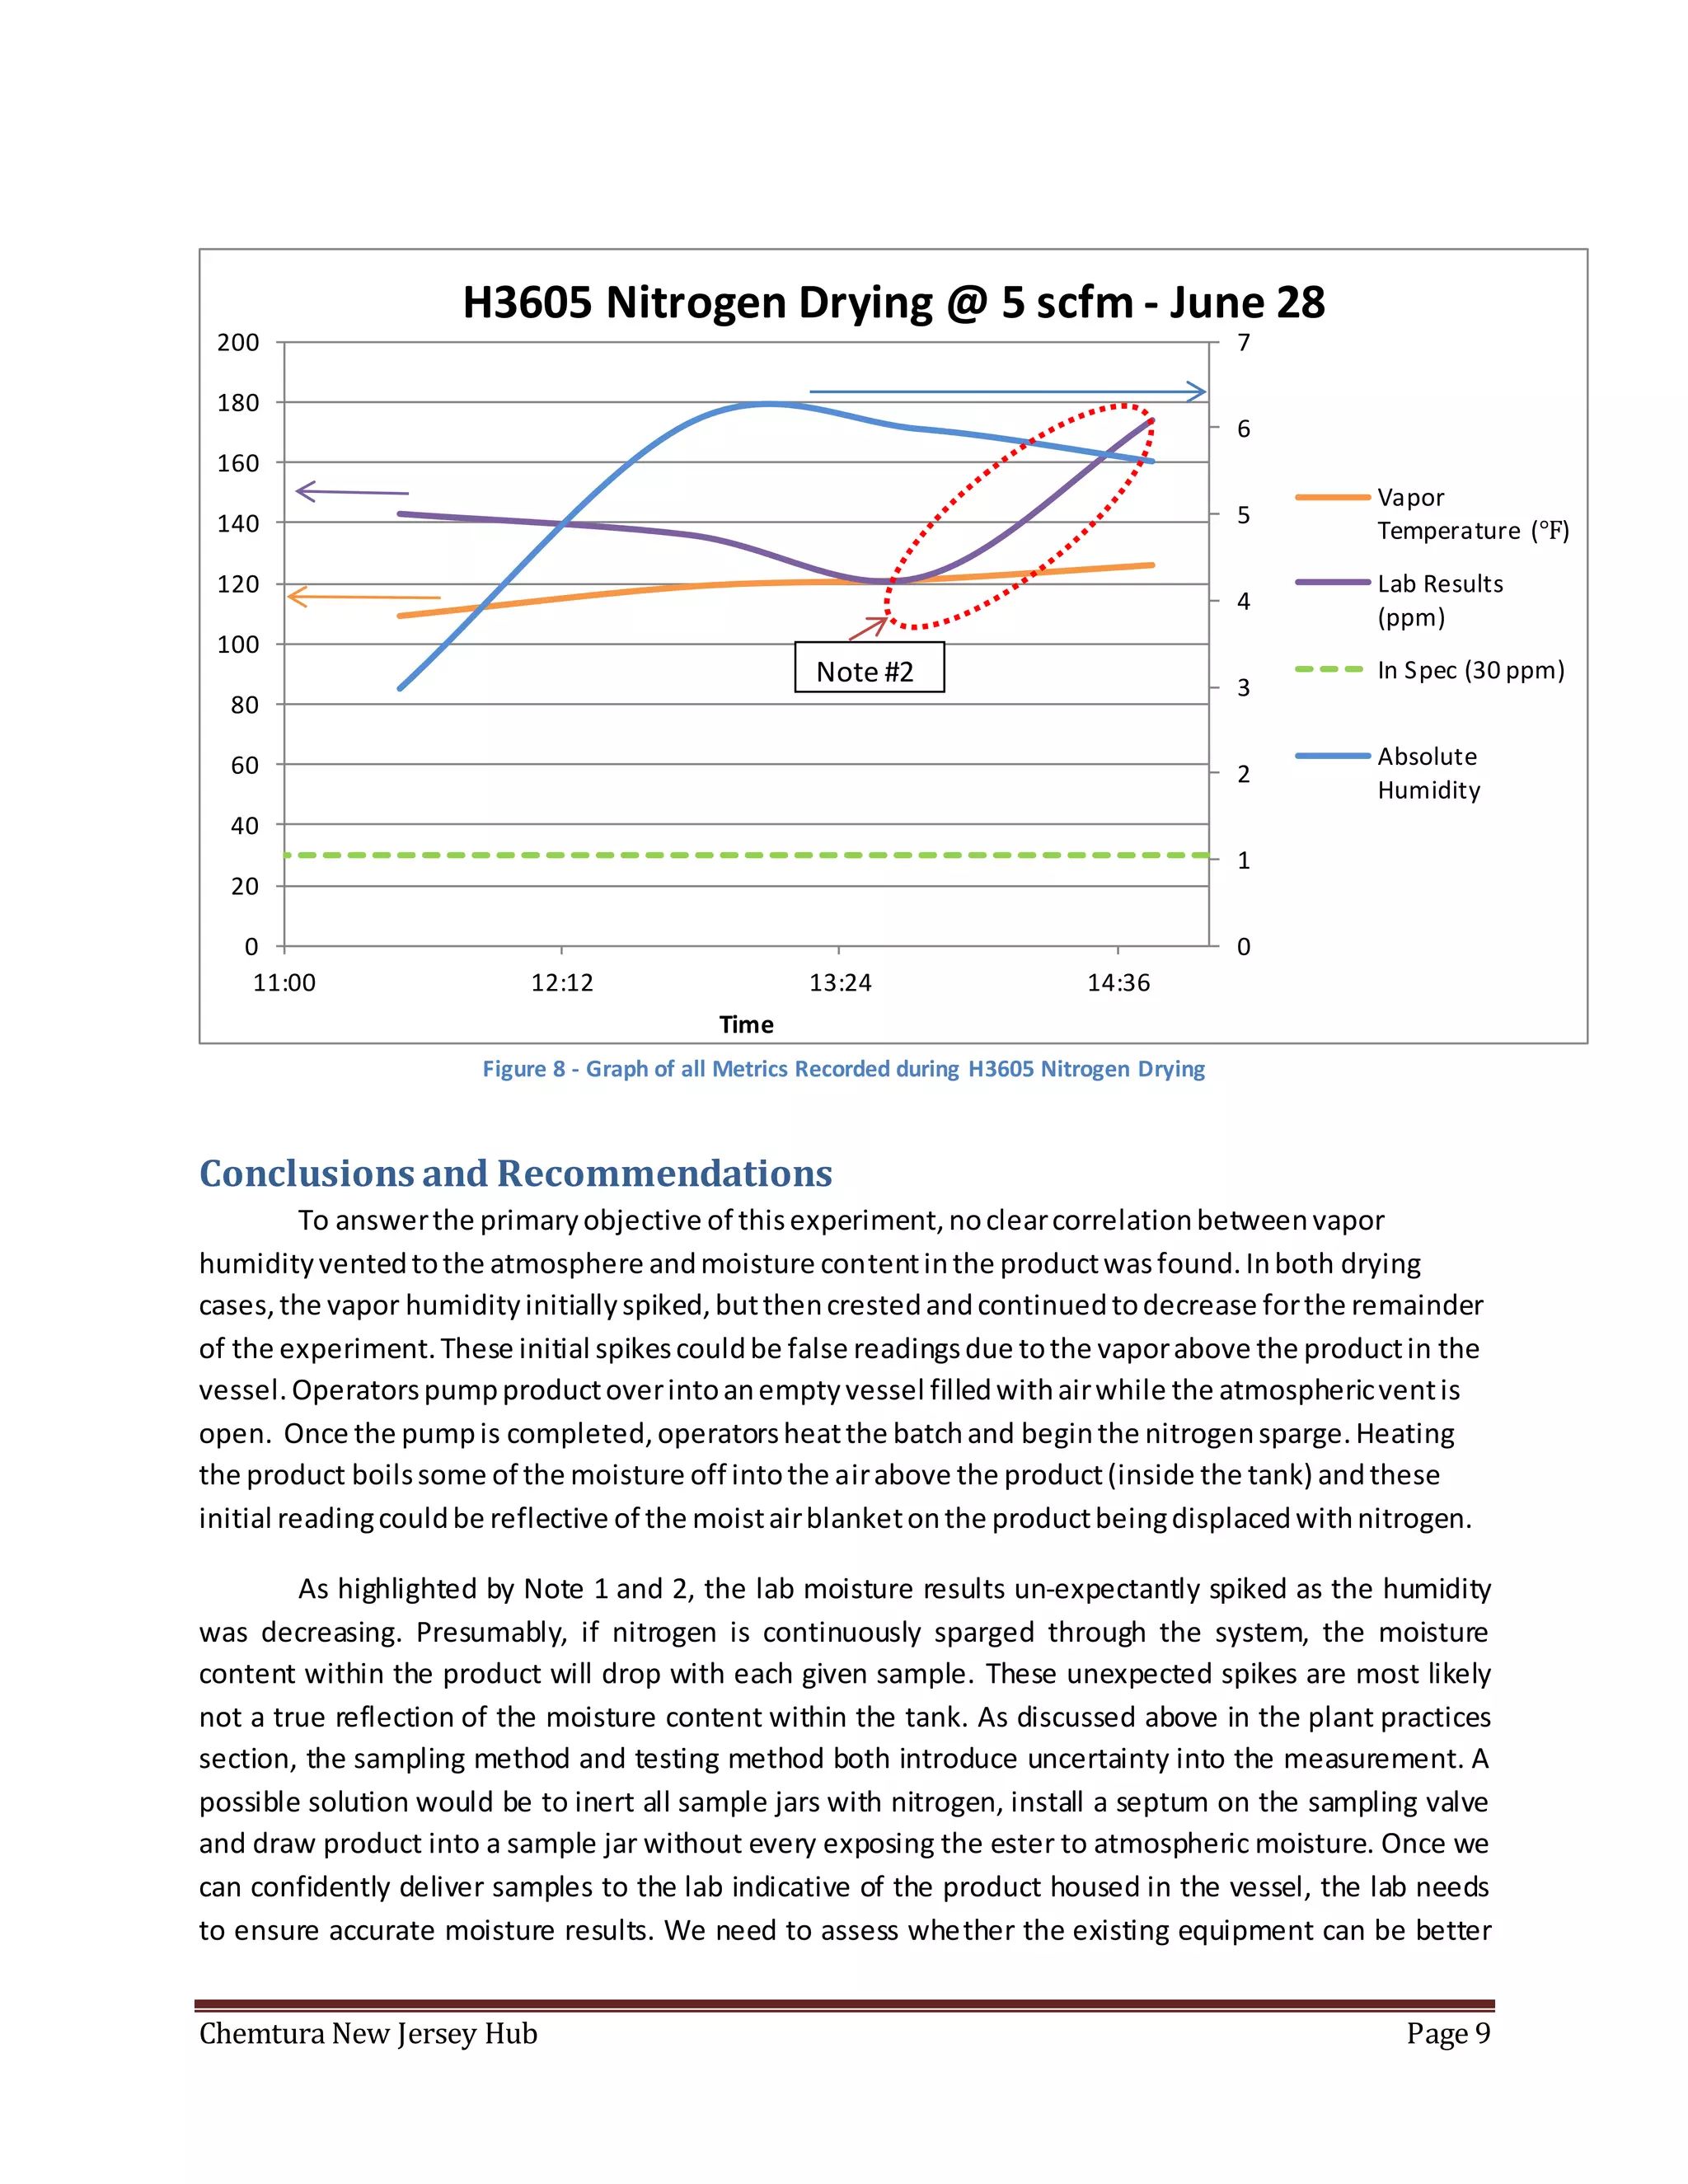
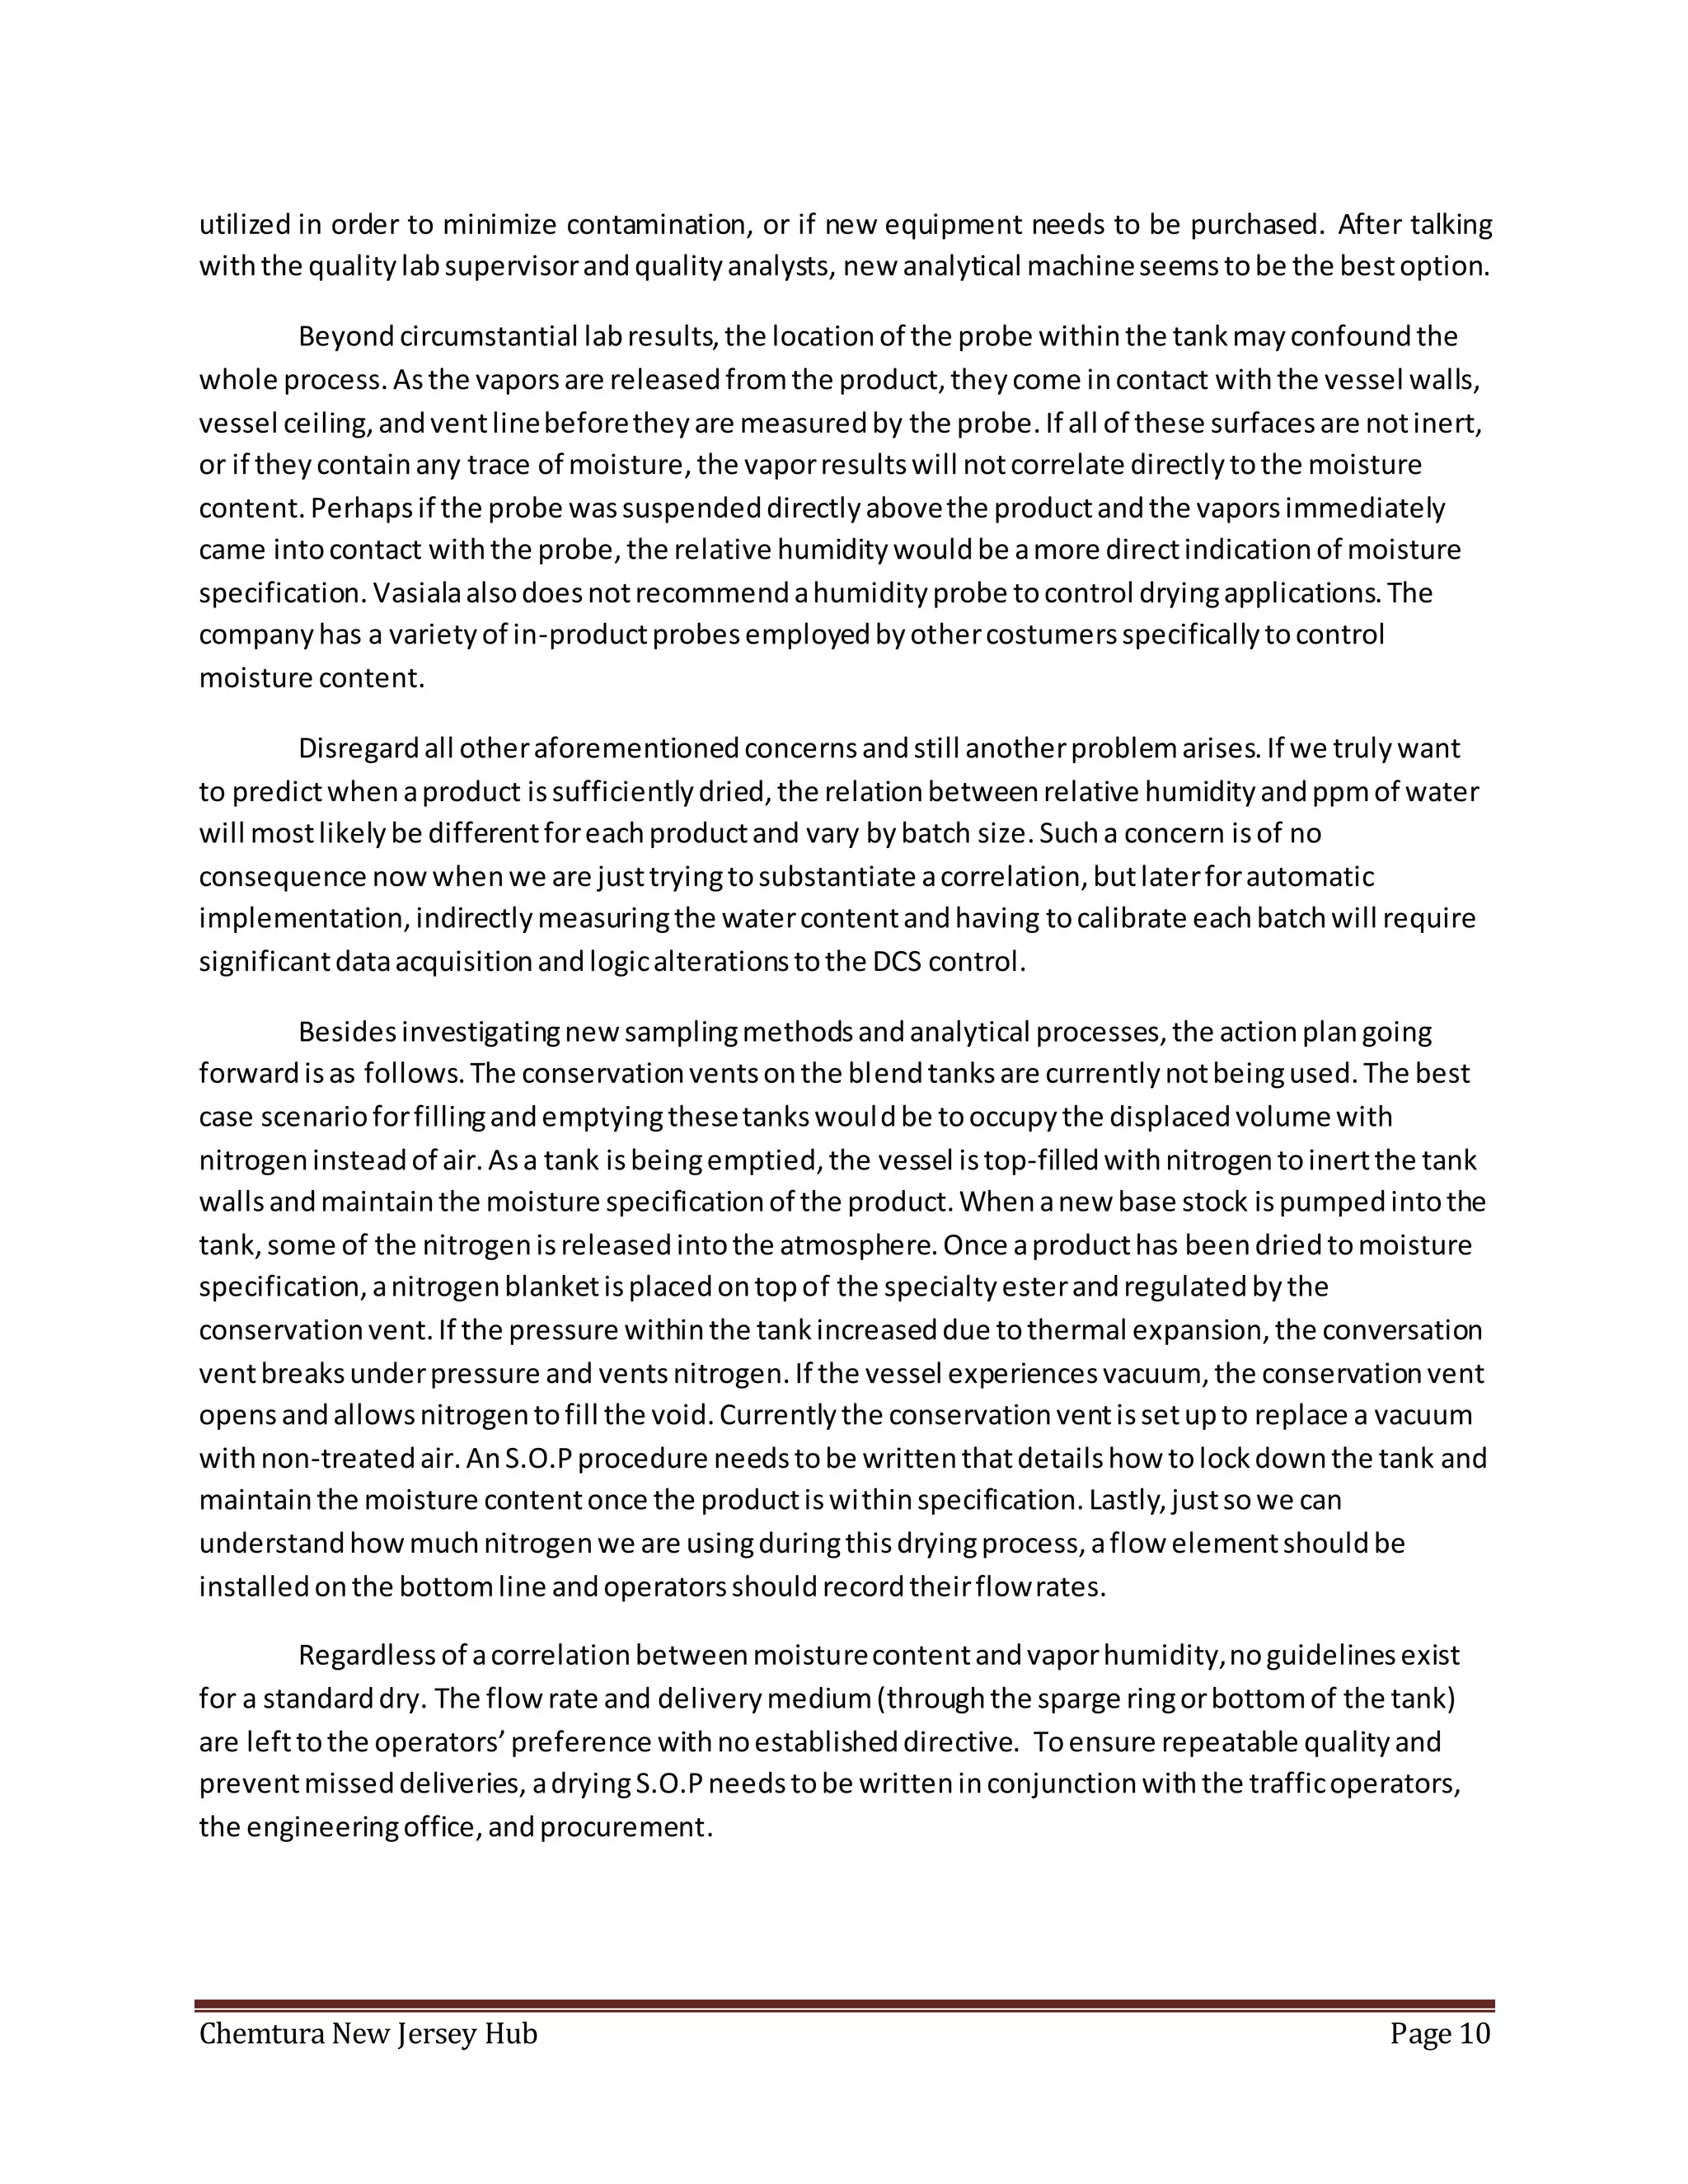
Chemtura New Jersey Hub 1020 King Georges Road, Fords NJ 08863 +1.732.738.1000
Automated Nitrogen Drying through
the HMT338 Humidity Probe
Chemtura New Jersey Hub
Fords Production Site
Engineering Department
Submittal Date: July 14, 2016
Prepared by:
Nathan Schaefer – Intern Engineer
Prepared for:
Jeffery Frankel – New Jersey Hub Engineering Manager
Chemtura New Jersey Hub Page 1
Table of Contents
Executive Summary ............................................................................................................................1
PlantPractices....................................................................................................................................3
Experiment Methodology....................................................................................................................4
HMT33 Probe Specifications................................................................................................................4
Results...............................................................................................................................................8
Conclusions and Recommendations.....................................................................................................9
Table of Figures
Figure 1 - HMTT338 Quote with Selling Points......................................................................................4
Figure 2 - Accuracy over Temperature Range .......................................................................................5
Figure 3 - HMT338 Probe Dimensions..................................................................................................6
Figure 4 - HMT338 Display Panel .........................................................................................................6
Figure 5 - B-103 Diagram.....................................................................................................................7
Figure 6 - Data Table...........................................................................................................................8
Figure 7 – Graph of all Recorded Metrics during the H3350 Nitrogen Drying ..........................................8
Figure 8 - Graph of all Metrics Recorded during H3605 Nitrogen Drying.................................................9
Chemtura New Jersey Hub Page 2
Executive Summary
In a cost saving attempt, Chemtura rented the HMT338 Humidity probe from Vaisala on June 5,
2016 with the obligation of returning the probe by July, 5 2016. The probe measures the relative
humidity and temperature of a given vapor. During the drying process, the object was to discover a
correlation between the relative humidity of the vapors being released from our blend tanks and the
product’s moisture content (ppm). If such a relationship could be discovered, the aspiration is to
automatically control the drying process to minimize nitrogen consumption. As a result of the inquiry,
no suchcorrelationwasdiscovered due toatleastthree confoundingvariables.
First, the sampling method used to draw product from the blend tank falsely introduces
moisture into the specialty ester. The sample ports are exposed directly the atmosphere and the
collection jars may contain moisture themselves; when the moisture specification is only a few ppms,
such exposure to atmospheric moisture (especially on a humid day) clouds the true moisture content of
the product in the tank. Second, the lab equipment used to measure the moisture specification is too
dependent on the ambient lab conditions. The Carl-Fischer titration introduces atmospheric moisture
into the product sample and may produce unreliable data based on the ambient humidity. Third, a
humidity probe, in conjunction with the manner in which it was implemented, may not have any
intrinsic relation to the moisture specification (ppm) of the product. The vapors being measured are not
carried directly from the product surface to the probe – they come in contact with the vessel walls,
vessel ceiling, and inside of vent pipe. Moreover, Vaisala does not recommend a humidity probe for
controlling drying operations. Vaisala offers several in-product probes that measure the moisture
specificationbytrackingthe product’swateractivity.
The following recommendations are drawn from the aforementioned conclusions: The
engineering department will investigate new means for sampling products in an inert environment and
consider different probe options. In order to make use of the already existing conservation vents, the
engineering department will write an S.O.P. for “locking down” tanks over the weekend and once
products have reached moisture specifications. Because the sparge ring is sometimes bypassed and
product is dried directly through the bottom of the tank, we don’t know how much nitrogen is being
used in the drying process. Ultimately, we don’t want to bypass the sparge ring and we would install
automatic controls to remove that capability, for the meantime, a flow meter should be put on the
bottom line and the operators should document nitrogen drying through the bottom. As per the
engineering department’s authorization, the quality lab has the necessary capital to purchase more
reliable equipmentfordetermininglow moisture contents.
Chemtura New Jersey Hub Page 3
Plant Practices
Current Practices for Drying
Once Ester 1 has finished filtering the esters through the filter presses, the base esters are
pumped into the day-tank farm. If no additions need to be made and the product is within the given
specifications, the products can be loaded onto tankers at rack 3 or 5. If additions need to be
incorporated into the specialty esters and/or the base stock needs drying, the product is pumped from a
day tank into one of the blend tanks. To dry the esters, nitrogen is sparged through the bottom of the
tank; the nitrogen picks upwater within the product and carries the wet vapors off into the atmosphere.
Currently, operators have no specific guidelines for how long to dry the batches, what flow rate to set
the nitrogen, nor what means is appropriate for delivering nitrogen into the batch. If a traffic operator
finds himself pumping a batch into a blend tank and shipping the batch on the same day, often nitrogen
isblasteddirectlyintothe bottomof the tankand the sparge ring isbypassed.
A manual needle valve on the nitrogen line in conjunction with an automatic DCS control valve
regulate the volume of nitrogen being delivered into the batch. If there is enough time to slowly dry the
batch through the sparge ring, the operators tend to set both the DCS control valve and the manual
needle valve anywhere between 5-15 scfm. Within the current set up, operators do not know nor can
predict when a batch will reach its moisture specification. During the weekday, nitrogen is continuously
sparged through the night because traffic operators are exclusively day shift employees. A batch may
become within moisture specification at 3am, but no traffic operator is present to shut off the nitrogen
sparge and put on a nitrogen blanket, nor does anyone know when a batch will reach moisture
specification. All the blend tanks have been outfitted with conservation vents so that over the weekend
nitrogen blankets can cover the products, maintaining the current moisture level, and drying can resume
on Monday. Varying anecdotal evidence suggests that some operators do blanket the tanks while others
leave the nitrogenspargingthroughthe weekend.
Current Practices for Sampling and Testing
With regards to sampling and testing to make sure the product is within the moisture
specification, the operators first take a sample from a sample port on the side of the tank. The operators
take an 8oz glassjar, remove the cap from the sample port and the sample jar, flush the jar 3-4 times, fill
the jar and then deliver the sample to the quality lab for analysis. During sampling, the jar and the
product are exposed to the atmosphere. Extraneous moisture from the atmosphere, depending on the
ambient temperature and humidity, may enter the sample and create erroneously high moisture
content in the jar that is not reflective of the actual product moisture content. Beyond just obtaining
the sample, lab results may be altered by the humidity within the lab itself. The jar is deposited in the
quality lab and one of the analyst perform a by mass Carl-Fisher titration to determine the ppm
moisture content. An analyst opens the sample jar, takes a 3-5g sample with a syringe, weights the
syringe, then removes a stopper from the titration flask and dispenses the sample into the flask. When
the analyst opens the jar to fill a syringe, the sample is yet again exposed to atmospheric moisture, and
when the flask stopper is removed, atmospheric moisture enters the equipment in which the titration is
performed. Anecdotal evidences also suggests that once the titration has been completed,if the sample
Chemtura New Jersey Hub Page 4
is swirled along the edges of the flask, the titration meter will continue to increase as the sample has
picked up moisture from the flask’s internal walls. Moisture readings in the summer are notoriously
higherandmore variable thantheyare inthe winter.
Experiment Methodology
The experiment methodology mirrored the actual process operators would use when taking
samples and testing for moisture content. Once a batch was pumped over into the blend tank, the
operators would set the steam coil to heat the batch up to 230℉. When the batch reached the set point,
a series of samples were drawn and test every hour. First the vapor temperate and relative humidity
was recorded from the display panel, then the sample was taken, then the sample was analyzed by the
quality lab. The time in-between the vapor temperature and relative humidity being recorded to taking
the sample was about 2 minutes, while the time in-between the sample being drawn and the moisture
specificationbeingdeterminedwasabout10 minutes.
HMT338 Probe Specifications
Probe Details and Accuracy
The following excerpts are a cut out from a quote detailing the HMTT338 selling points and a graph
illustrating the probe’s temperature reading accuracy over a range of temperatures. A link to the PDF
versionof the entire manual isattachedatthe endof thissection:
Vaisala Humidity and Temperature Transmitter, HMT338 (Qty: 1)
Order Code: HMT330 8W0A101BCAE200A24CNBAA1
- HMT338 with 5m cable for standard probe
- Display with keypad
- 10...35 VDC 24 VAC input supply
- Analog output channel (Ch1&Ch2) 4... 20 mA
- Analog output signals for Ch1: RH (0...100%RH)
- Analog output signals for Ch2: T -40...+180°C (-40...+356°F)
- Cable gland M20*1.5 for Cable bushings
- Pole installation kit for transmitter
- Sintered stainless steel filter
- Pressure fitting NPT 1/2" with no leak screw for probe installation
- Manual
- ISO9001 compliant factory calibration from July 2015
$2,195.20/unit (including 20% discount)
Figure 1 - HMTT338 Quote with Selling Points
Chemtura New Jersey Hub Page 5
Figure 2 - Accuracy over Temperature Range
Chemtura was able to rent a demo probe that Vaisala had on stock because another costumer
returned the probe. As show in figure 1, the HMT338 probe has two analog outputs – one recording the
temperature ineither Celsius or Fahrenheit, and another recording the relative humidity. The 338 probe
is the top line probe in the 330 series and our operating conditions are within the ranges detailed above.
During the drying process, the products are heated to 230℉ with vapor temperatures ranging from
100℉ to 175℉. As shown in figure 2, error in the probes temperature reading increases at the extremes
of the probe’s range – for our application error was less than +/- 0.5°C (0.9℉). Because the error
magnitude is less than a degree and our temperature interval is more than 50℉, the probe temperature
error is less than 2% and does not introduce significant error into the experiment. However, as detailed
on page 169 of the manual, the relative humidity error is +/- (1.5+0.015 x reading) % RH. As our relative
humidity range was only 5.29 %RH, this error magnitude introduces significant errorinto the experiment.
Followthis link toreadthe full manual.
Probe Implementation
The HMT338 probe was installed on blend tank 103 which has an 11’ diameter, is 15’ in height,
and can hold 10,000 gallons. The display panel, as portrayed in Figure 4, was mounted to a beam
adjacent to B-103. As illustrated in Figure 5, the probe itself was threaded into the atmospheric vent on
the top of the B-103 tank above the valve. In order for nitrogen to flow through the sparge ring,
operators set a desired scfm on the DCS control and then adjusted the needle valve via a flow element
to match the DCS setting. No flow element or throttling valve is used if nitrogen is blasted directly
through the bottom of the tank. The conservation vent is set to break at 1’’ WC under pressure and ½’’
WC under vacuum – in the event of a vacuum break, air is pulled directly into the tank. Current practices
suggest that the conservation vents are not being used. For additional specifications, Figure 3 details the
Least Error @ 20°C Most Error @ 180°C
Chemtura New Jersey Hub Page 6
exact probe’s length and threading. The probe fit snugglyinside the 3’’ vent and was fullyexposed to the
vaporsbeingreleasedfromthe tank.
Figure 3 - HMT338 Probe Dimensions
Figure 4 - HMT338 Display Panel
Chemtura New Jersey Hub Page 7
Figure 5 - B-103 Diagram
Otherdetails and pictures of the specific implementation of thisprobeon tankB-103 are unavailable
becausethe probewas disassembled and returned to Vaisala beforethisreportwasdrafted.
HMT338 probe
installation site
on vent line
Agitator
SamplingPort
Nitrogengoing
intosparge ring
Needle
Valve
DCS Control
Valve
Conservation
Vent
Nitrogen bypassing the
sparge line going into the
bottom of the tank
Flow
Element
Chemtura New Jersey Hub Page 8
Results
During the experiment two batches where tested. On June 22, a 22,000lbs batch of H3350 was
dried and on June 28 a 45,000lbs batch of H3605 was dried. The following tables and figures track and
display the key metrics measured during this experiment: relative humidity, vapor temperature,
moisture content, and nitrogen flow rate. The absolute humidity was calculated afterwards with the
giventemperature.
Date Time
Meter
Reading
(RH)
Absolute
Humidity
Vapor
Temperature
(℉)
Lab
Results
(ppm)
Product
N2
Reading
(scfm)
Volume
(lbs)
22-Jun 10:30 2.60 4.50811 152.1 133 3350 10 22,000
22-Jun 11:30 4.29 6.82248 148.36 85 3350 10 22,000
22-Jun 13:00 5.97 6.85069 134.72 71 3350 10 22,000
22-Jun 13:45 5.46 6.18426 134.19 58 3350 10 22,000
22-Jun 15:00 4.40 4.62425 131.17 109 3350 10 22,000
22-Jun 16:15 3.34 3.35645 129.38 72 3350 10 22,000
28-Jun 11:30 5.03 2.97804 109.17 143 3605 5 45,000
28-Jun 12:45 7.89 6.05785 118.89 136 3605 5 45,000
28-Jun 13:45 7.34 5.98716 121.21 122 3605 5 45,000
28-Jun 14:45 6.08 5.61367 126.03 174 3605 5 45,000
Figure 6 - Data Table
Figure 7 – Graph of all Recorded Metrics during the H3350 Nitrogen Drying
0
1
2
3
4
5
6
7
8
0
20
40
60
80
100
120
140
160
10:00 11:12 12:24 13:36 14:48 16:00
Time
H3350 Nitrogen Drying @ 10 scfm- June 22
Vapor
Temperature (℉)
Lab Results (ppm)
In Spec (30 ppm)
Absolute Humidity
Note #1
Chemtura New Jersey Hub Page 9
Figure 8 - Graph of all Metrics Recorded during H3605 Nitrogen Drying
Conclusions and Recommendations
To answerthe primaryobjective of thisexperiment,noclearcorrelationbetweenvapor
humidityventedtothe atmosphere andmoisture contentinthe productwasfound.Inboth drying
cases,the vapor humidityinitiallyspiked,butthencrestedandcontinuedtodecrease forthe remainder
of the experiment.These initial spikescouldbe false readingsdue tothe vaporabove the productin the
vessel.Operatorspumpproductoverintoanemptyvessel filledwithairwhile the atmosphericventis
open. Once the pumpis completed,operatorsheatthe batchand beginthe nitrogensparge.Heating
the product boilssome of the moisture off intothe airabove the product(inside the tank) andthese
initial readingcouldbe reflective of the moistairblanketonthe productbeingdisplacedwithnitrogen.
As highlighted by Note 1 and 2, the lab moisture results un-expectantly spiked as the humidity
was decreasing. Presumably, if nitrogen is continuously sparged through the system, the moisture
content within the product will drop with each given sample. These unexpected spikes are most likely
not a true reflection of the moisture content within the tank. As discussed above in the plant practices
section, the sampling method and testing method both introduce uncertainty into the measurement. A
possible solution would be to inert all sample jars with nitrogen, install a septum on the sampling valve
and draw product into a sample jar without every exposing the ester to atmospheric moisture. Once we
can confidently deliver samples to the lab indicative of the product housed in the vessel, the lab needs
to ensure accurate moisture results. We need to assess whether the existing equipment can be better
0
1
2
3
4
5
6
7
0
20
40
60
80
100
120
140
160
180
200
11:00 12:12 13:24 14:36
Time
H3605 Nitrogen Drying @ 5 scfm - June 28
Vapor
Temperature (℉)
Lab Results
(ppm)
In Spec (30 ppm)
Absolute
Humidity
Note #2
Chemtura New Jersey Hub Page 10
utilized in order to minimize contamination, or if new equipment needs to be purchased. After talking
withthe qualitylabsupervisorandqualityanalysts, new analytical machineseemstobe the bestoption.
Beyond circumstantial labresults,the locationof the probe withinthe tankmayconfoundthe
whole process.Asthe vaporsare releasedfromthe product,theycome incontact withthe vessel walls,
vessel ceiling,andventlinebeforetheyare measuredby the probe.If all of these surfacesare notinert,
or if theycontainany trace of moisture,the vaporresultswill notcorrelate directlytothe moisture
content.Perhapsif the probe wassuspendeddirectlyabovethe productandthe vaporsimmediately
came intocontact withthe probe,the relative humiditywouldbe amore directindicationof moisture
specification. Vasialaalsodoesnotrecommendahumidityprobe tocontrol dryingapplications.The
companyhas a varietyof in-productprobesemployedbyothercostumersspecificallytocontrol
moisture content.
Disregardall otheraforementionedconcernsandstill anotherproblemarises.If we trulywant
to predictwhenaproduct issufficientlydried,the relationbetweenrelative humidityandppmof water
will mostlikelybe differentforeachproductand vary bybatch size.Sucha concern isof no
consequence nowwhenwe are justtryingtosubstantiate acorrelation,butlaterforautomatic
implementation,indirectlymeasuringthe watercontentandhaving tocalibrate eachbatchwill require
significantdataacquisitionandlogicalterationstothe DCS control.
Besidesinvestigatingnewsamplingmethodsandanalytical processes,the actionplangoing
forwardisas follows.The conservationventsonthe blendtanksare currentlynotbeingused.The best
case scenarioforfillingandemptyingthesetankswouldbe tooccupythe displacedvolumewith
nitrogeninsteadof air.Asa tank isbeingemptied,the vessel istop-filledwithnitrogentoinertthe tank
wallsandmaintainthe moisture specificationof the product.Whenanew base stock ispumpedintothe
tank, some of the nitrogenisreleasedintothe atmosphere.Once aproducthas beendriedtomoisture
specification,anitrogenblanketisplacedontopof the specialtyesterandregulatedbythe
conservationvent.If the pressure withinthe tankincreaseddue tothermal expansion,the conversation
ventbreaksunderpressure and ventsnitrogen.If the vessel experiencesvacuum, the conservationvent
opensandallowsnitrogentofill the void.Currentlythe conservationventissetupto replace a vacuum
withnon-treatedair.AnS.O.Pprocedure needstobe writtenthatdetailshow tolockdownthe tank and
maintainthe moisture contentonce the productiswithinspecification.Lastly,justsowe can
understandhowmuchnitrogenwe are usingduringthisdryingprocess,aflow elementshouldbe
installedonthe bottomline andoperatorsshouldrecordtheirflowrates.
Regardless of acorrelationbetweenmoisturecontentandvaporhumidity,noguidelinesexist
for a standarddry. The flowrate and deliverymedium(throughthe sparge ringorbottomof the tank)
are lefttothe operators’preference withnoestablisheddirective. Toensure repeatable qualityand
preventmisseddeliveries, adryingS.O.Pneedstobe writteninconjunctionwiththe trafficoperators,
the engineeringoffice,andprocurement.

Automated Nitrogen Drying

  • 1.
    Chemtura New JerseyHub 1020 King Georges Road, Fords NJ 08863 +1.732.738.1000 Automated Nitrogen Drying through the HMT338 Humidity Probe Chemtura New Jersey Hub Fords Production Site Engineering Department Submittal Date: July 14, 2016 Prepared by: Nathan Schaefer – Intern Engineer Prepared for: Jeffery Frankel – New Jersey Hub Engineering Manager
  • 2.
    Chemtura New JerseyHub Page 1 Table of Contents Executive Summary ............................................................................................................................1 PlantPractices....................................................................................................................................3 Experiment Methodology....................................................................................................................4 HMT33 Probe Specifications................................................................................................................4 Results...............................................................................................................................................8 Conclusions and Recommendations.....................................................................................................9 Table of Figures Figure 1 - HMTT338 Quote with Selling Points......................................................................................4 Figure 2 - Accuracy over Temperature Range .......................................................................................5 Figure 3 - HMT338 Probe Dimensions..................................................................................................6 Figure 4 - HMT338 Display Panel .........................................................................................................6 Figure 5 - B-103 Diagram.....................................................................................................................7 Figure 6 - Data Table...........................................................................................................................8 Figure 7 – Graph of all Recorded Metrics during the H3350 Nitrogen Drying ..........................................8 Figure 8 - Graph of all Metrics Recorded during H3605 Nitrogen Drying.................................................9
  • 3.
    Chemtura New JerseyHub Page 2 Executive Summary In a cost saving attempt, Chemtura rented the HMT338 Humidity probe from Vaisala on June 5, 2016 with the obligation of returning the probe by July, 5 2016. The probe measures the relative humidity and temperature of a given vapor. During the drying process, the object was to discover a correlation between the relative humidity of the vapors being released from our blend tanks and the product’s moisture content (ppm). If such a relationship could be discovered, the aspiration is to automatically control the drying process to minimize nitrogen consumption. As a result of the inquiry, no suchcorrelationwasdiscovered due toatleastthree confoundingvariables. First, the sampling method used to draw product from the blend tank falsely introduces moisture into the specialty ester. The sample ports are exposed directly the atmosphere and the collection jars may contain moisture themselves; when the moisture specification is only a few ppms, such exposure to atmospheric moisture (especially on a humid day) clouds the true moisture content of the product in the tank. Second, the lab equipment used to measure the moisture specification is too dependent on the ambient lab conditions. The Carl-Fischer titration introduces atmospheric moisture into the product sample and may produce unreliable data based on the ambient humidity. Third, a humidity probe, in conjunction with the manner in which it was implemented, may not have any intrinsic relation to the moisture specification (ppm) of the product. The vapors being measured are not carried directly from the product surface to the probe – they come in contact with the vessel walls, vessel ceiling, and inside of vent pipe. Moreover, Vaisala does not recommend a humidity probe for controlling drying operations. Vaisala offers several in-product probes that measure the moisture specificationbytrackingthe product’swateractivity. The following recommendations are drawn from the aforementioned conclusions: The engineering department will investigate new means for sampling products in an inert environment and consider different probe options. In order to make use of the already existing conservation vents, the engineering department will write an S.O.P. for “locking down” tanks over the weekend and once products have reached moisture specifications. Because the sparge ring is sometimes bypassed and product is dried directly through the bottom of the tank, we don’t know how much nitrogen is being used in the drying process. Ultimately, we don’t want to bypass the sparge ring and we would install automatic controls to remove that capability, for the meantime, a flow meter should be put on the bottom line and the operators should document nitrogen drying through the bottom. As per the engineering department’s authorization, the quality lab has the necessary capital to purchase more reliable equipmentfordetermininglow moisture contents.
  • 4.
    Chemtura New JerseyHub Page 3 Plant Practices Current Practices for Drying Once Ester 1 has finished filtering the esters through the filter presses, the base esters are pumped into the day-tank farm. If no additions need to be made and the product is within the given specifications, the products can be loaded onto tankers at rack 3 or 5. If additions need to be incorporated into the specialty esters and/or the base stock needs drying, the product is pumped from a day tank into one of the blend tanks. To dry the esters, nitrogen is sparged through the bottom of the tank; the nitrogen picks upwater within the product and carries the wet vapors off into the atmosphere. Currently, operators have no specific guidelines for how long to dry the batches, what flow rate to set the nitrogen, nor what means is appropriate for delivering nitrogen into the batch. If a traffic operator finds himself pumping a batch into a blend tank and shipping the batch on the same day, often nitrogen isblasteddirectlyintothe bottomof the tankand the sparge ring isbypassed. A manual needle valve on the nitrogen line in conjunction with an automatic DCS control valve regulate the volume of nitrogen being delivered into the batch. If there is enough time to slowly dry the batch through the sparge ring, the operators tend to set both the DCS control valve and the manual needle valve anywhere between 5-15 scfm. Within the current set up, operators do not know nor can predict when a batch will reach its moisture specification. During the weekday, nitrogen is continuously sparged through the night because traffic operators are exclusively day shift employees. A batch may become within moisture specification at 3am, but no traffic operator is present to shut off the nitrogen sparge and put on a nitrogen blanket, nor does anyone know when a batch will reach moisture specification. All the blend tanks have been outfitted with conservation vents so that over the weekend nitrogen blankets can cover the products, maintaining the current moisture level, and drying can resume on Monday. Varying anecdotal evidence suggests that some operators do blanket the tanks while others leave the nitrogenspargingthroughthe weekend. Current Practices for Sampling and Testing With regards to sampling and testing to make sure the product is within the moisture specification, the operators first take a sample from a sample port on the side of the tank. The operators take an 8oz glassjar, remove the cap from the sample port and the sample jar, flush the jar 3-4 times, fill the jar and then deliver the sample to the quality lab for analysis. During sampling, the jar and the product are exposed to the atmosphere. Extraneous moisture from the atmosphere, depending on the ambient temperature and humidity, may enter the sample and create erroneously high moisture content in the jar that is not reflective of the actual product moisture content. Beyond just obtaining the sample, lab results may be altered by the humidity within the lab itself. The jar is deposited in the quality lab and one of the analyst perform a by mass Carl-Fisher titration to determine the ppm moisture content. An analyst opens the sample jar, takes a 3-5g sample with a syringe, weights the syringe, then removes a stopper from the titration flask and dispenses the sample into the flask. When the analyst opens the jar to fill a syringe, the sample is yet again exposed to atmospheric moisture, and when the flask stopper is removed, atmospheric moisture enters the equipment in which the titration is performed. Anecdotal evidences also suggests that once the titration has been completed,if the sample
  • 5.
    Chemtura New JerseyHub Page 4 is swirled along the edges of the flask, the titration meter will continue to increase as the sample has picked up moisture from the flask’s internal walls. Moisture readings in the summer are notoriously higherandmore variable thantheyare inthe winter. Experiment Methodology The experiment methodology mirrored the actual process operators would use when taking samples and testing for moisture content. Once a batch was pumped over into the blend tank, the operators would set the steam coil to heat the batch up to 230℉. When the batch reached the set point, a series of samples were drawn and test every hour. First the vapor temperate and relative humidity was recorded from the display panel, then the sample was taken, then the sample was analyzed by the quality lab. The time in-between the vapor temperature and relative humidity being recorded to taking the sample was about 2 minutes, while the time in-between the sample being drawn and the moisture specificationbeingdeterminedwasabout10 minutes. HMT338 Probe Specifications Probe Details and Accuracy The following excerpts are a cut out from a quote detailing the HMTT338 selling points and a graph illustrating the probe’s temperature reading accuracy over a range of temperatures. A link to the PDF versionof the entire manual isattachedatthe endof thissection: Vaisala Humidity and Temperature Transmitter, HMT338 (Qty: 1) Order Code: HMT330 8W0A101BCAE200A24CNBAA1 - HMT338 with 5m cable for standard probe - Display with keypad - 10...35 VDC 24 VAC input supply - Analog output channel (Ch1&Ch2) 4... 20 mA - Analog output signals for Ch1: RH (0...100%RH) - Analog output signals for Ch2: T -40...+180°C (-40...+356°F) - Cable gland M20*1.5 for Cable bushings - Pole installation kit for transmitter - Sintered stainless steel filter - Pressure fitting NPT 1/2" with no leak screw for probe installation - Manual - ISO9001 compliant factory calibration from July 2015 $2,195.20/unit (including 20% discount) Figure 1 - HMTT338 Quote with Selling Points
  • 6.
    Chemtura New JerseyHub Page 5 Figure 2 - Accuracy over Temperature Range Chemtura was able to rent a demo probe that Vaisala had on stock because another costumer returned the probe. As show in figure 1, the HMT338 probe has two analog outputs – one recording the temperature ineither Celsius or Fahrenheit, and another recording the relative humidity. The 338 probe is the top line probe in the 330 series and our operating conditions are within the ranges detailed above. During the drying process, the products are heated to 230℉ with vapor temperatures ranging from 100℉ to 175℉. As shown in figure 2, error in the probes temperature reading increases at the extremes of the probe’s range – for our application error was less than +/- 0.5°C (0.9℉). Because the error magnitude is less than a degree and our temperature interval is more than 50℉, the probe temperature error is less than 2% and does not introduce significant error into the experiment. However, as detailed on page 169 of the manual, the relative humidity error is +/- (1.5+0.015 x reading) % RH. As our relative humidity range was only 5.29 %RH, this error magnitude introduces significant errorinto the experiment. Followthis link toreadthe full manual. Probe Implementation The HMT338 probe was installed on blend tank 103 which has an 11’ diameter, is 15’ in height, and can hold 10,000 gallons. The display panel, as portrayed in Figure 4, was mounted to a beam adjacent to B-103. As illustrated in Figure 5, the probe itself was threaded into the atmospheric vent on the top of the B-103 tank above the valve. In order for nitrogen to flow through the sparge ring, operators set a desired scfm on the DCS control and then adjusted the needle valve via a flow element to match the DCS setting. No flow element or throttling valve is used if nitrogen is blasted directly through the bottom of the tank. The conservation vent is set to break at 1’’ WC under pressure and ½’’ WC under vacuum – in the event of a vacuum break, air is pulled directly into the tank. Current practices suggest that the conservation vents are not being used. For additional specifications, Figure 3 details the Least Error @ 20°C Most Error @ 180°C
  • 7.
    Chemtura New JerseyHub Page 6 exact probe’s length and threading. The probe fit snugglyinside the 3’’ vent and was fullyexposed to the vaporsbeingreleasedfromthe tank. Figure 3 - HMT338 Probe Dimensions Figure 4 - HMT338 Display Panel
  • 8.
    Chemtura New JerseyHub Page 7 Figure 5 - B-103 Diagram Otherdetails and pictures of the specific implementation of thisprobeon tankB-103 are unavailable becausethe probewas disassembled and returned to Vaisala beforethisreportwasdrafted. HMT338 probe installation site on vent line Agitator SamplingPort Nitrogengoing intosparge ring Needle Valve DCS Control Valve Conservation Vent Nitrogen bypassing the sparge line going into the bottom of the tank Flow Element
  • 9.
    Chemtura New JerseyHub Page 8 Results During the experiment two batches where tested. On June 22, a 22,000lbs batch of H3350 was dried and on June 28 a 45,000lbs batch of H3605 was dried. The following tables and figures track and display the key metrics measured during this experiment: relative humidity, vapor temperature, moisture content, and nitrogen flow rate. The absolute humidity was calculated afterwards with the giventemperature. Date Time Meter Reading (RH) Absolute Humidity Vapor Temperature (℉) Lab Results (ppm) Product N2 Reading (scfm) Volume (lbs) 22-Jun 10:30 2.60 4.50811 152.1 133 3350 10 22,000 22-Jun 11:30 4.29 6.82248 148.36 85 3350 10 22,000 22-Jun 13:00 5.97 6.85069 134.72 71 3350 10 22,000 22-Jun 13:45 5.46 6.18426 134.19 58 3350 10 22,000 22-Jun 15:00 4.40 4.62425 131.17 109 3350 10 22,000 22-Jun 16:15 3.34 3.35645 129.38 72 3350 10 22,000 28-Jun 11:30 5.03 2.97804 109.17 143 3605 5 45,000 28-Jun 12:45 7.89 6.05785 118.89 136 3605 5 45,000 28-Jun 13:45 7.34 5.98716 121.21 122 3605 5 45,000 28-Jun 14:45 6.08 5.61367 126.03 174 3605 5 45,000 Figure 6 - Data Table Figure 7 – Graph of all Recorded Metrics during the H3350 Nitrogen Drying 0 1 2 3 4 5 6 7 8 0 20 40 60 80 100 120 140 160 10:00 11:12 12:24 13:36 14:48 16:00 Time H3350 Nitrogen Drying @ 10 scfm- June 22 Vapor Temperature (℉) Lab Results (ppm) In Spec (30 ppm) Absolute Humidity Note #1
  • 10.
    Chemtura New JerseyHub Page 9 Figure 8 - Graph of all Metrics Recorded during H3605 Nitrogen Drying Conclusions and Recommendations To answerthe primaryobjective of thisexperiment,noclearcorrelationbetweenvapor humidityventedtothe atmosphere andmoisture contentinthe productwasfound.Inboth drying cases,the vapor humidityinitiallyspiked,butthencrestedandcontinuedtodecrease forthe remainder of the experiment.These initial spikescouldbe false readingsdue tothe vaporabove the productin the vessel.Operatorspumpproductoverintoanemptyvessel filledwithairwhile the atmosphericventis open. Once the pumpis completed,operatorsheatthe batchand beginthe nitrogensparge.Heating the product boilssome of the moisture off intothe airabove the product(inside the tank) andthese initial readingcouldbe reflective of the moistairblanketonthe productbeingdisplacedwithnitrogen. As highlighted by Note 1 and 2, the lab moisture results un-expectantly spiked as the humidity was decreasing. Presumably, if nitrogen is continuously sparged through the system, the moisture content within the product will drop with each given sample. These unexpected spikes are most likely not a true reflection of the moisture content within the tank. As discussed above in the plant practices section, the sampling method and testing method both introduce uncertainty into the measurement. A possible solution would be to inert all sample jars with nitrogen, install a septum on the sampling valve and draw product into a sample jar without every exposing the ester to atmospheric moisture. Once we can confidently deliver samples to the lab indicative of the product housed in the vessel, the lab needs to ensure accurate moisture results. We need to assess whether the existing equipment can be better 0 1 2 3 4 5 6 7 0 20 40 60 80 100 120 140 160 180 200 11:00 12:12 13:24 14:36 Time H3605 Nitrogen Drying @ 5 scfm - June 28 Vapor Temperature (℉) Lab Results (ppm) In Spec (30 ppm) Absolute Humidity Note #2
  • 11.
    Chemtura New JerseyHub Page 10 utilized in order to minimize contamination, or if new equipment needs to be purchased. After talking withthe qualitylabsupervisorandqualityanalysts, new analytical machineseemstobe the bestoption. Beyond circumstantial labresults,the locationof the probe withinthe tankmayconfoundthe whole process.Asthe vaporsare releasedfromthe product,theycome incontact withthe vessel walls, vessel ceiling,andventlinebeforetheyare measuredby the probe.If all of these surfacesare notinert, or if theycontainany trace of moisture,the vaporresultswill notcorrelate directlytothe moisture content.Perhapsif the probe wassuspendeddirectlyabovethe productandthe vaporsimmediately came intocontact withthe probe,the relative humiditywouldbe amore directindicationof moisture specification. Vasialaalsodoesnotrecommendahumidityprobe tocontrol dryingapplications.The companyhas a varietyof in-productprobesemployedbyothercostumersspecificallytocontrol moisture content. Disregardall otheraforementionedconcernsandstill anotherproblemarises.If we trulywant to predictwhenaproduct issufficientlydried,the relationbetweenrelative humidityandppmof water will mostlikelybe differentforeachproductand vary bybatch size.Sucha concern isof no consequence nowwhenwe are justtryingtosubstantiate acorrelation,butlaterforautomatic implementation,indirectlymeasuringthe watercontentandhaving tocalibrate eachbatchwill require significantdataacquisitionandlogicalterationstothe DCS control. Besidesinvestigatingnewsamplingmethodsandanalytical processes,the actionplangoing forwardisas follows.The conservationventsonthe blendtanksare currentlynotbeingused.The best case scenarioforfillingandemptyingthesetankswouldbe tooccupythe displacedvolumewith nitrogeninsteadof air.Asa tank isbeingemptied,the vessel istop-filledwithnitrogentoinertthe tank wallsandmaintainthe moisture specificationof the product.Whenanew base stock ispumpedintothe tank, some of the nitrogenisreleasedintothe atmosphere.Once aproducthas beendriedtomoisture specification,anitrogenblanketisplacedontopof the specialtyesterandregulatedbythe conservationvent.If the pressure withinthe tankincreaseddue tothermal expansion,the conversation ventbreaksunderpressure and ventsnitrogen.If the vessel experiencesvacuum, the conservationvent opensandallowsnitrogentofill the void.Currentlythe conservationventissetupto replace a vacuum withnon-treatedair.AnS.O.Pprocedure needstobe writtenthatdetailshow tolockdownthe tank and maintainthe moisture contentonce the productiswithinspecification.Lastly,justsowe can understandhowmuchnitrogenwe are usingduringthisdryingprocess,aflow elementshouldbe installedonthe bottomline andoperatorsshouldrecordtheirflowrates. Regardless of acorrelationbetweenmoisturecontentandvaporhumidity,noguidelinesexist for a standarddry. The flowrate and deliverymedium(throughthe sparge ringorbottomof the tank) are lefttothe operators’preference withnoestablisheddirective. Toensure repeatable qualityand preventmisseddeliveries, adryingS.O.Pneedstobe writteninconjunctionwiththe trafficoperators, the engineeringoffice,andprocurement.