Download to read offline
![TOWARDS UNDERSTANDING AUTISM RISK FACTORS: A
CLASSIFICATION OF BRAIN IMAGES WITH SUPPORT
VECTOR MACHINES
COLLEEN PAM CHEN
Computational Science Research Center
San Diego State University, San Diego, CA 92120, USA
ColleenPamChen@gmail.com
CHRISTOPHER LEE KEOWN
Computational Science Research Center
San Diego State University, San Diego, CA 92120, USA
Christopher.Keown@gmail.com
RALPH-AXEL MÜLLER
Brain Development Imaging Laboratory
San Diego State University, San Diego, CA 92120, USA
amueller@sciences.sdsu.edu
We demonstrate the use of support vector machine methods to classify autism neuroimaging
data collected from multiple sites.
Keywords: SVM; neuroimaging; pattern recognition; autism diagnosis.
1. Introduction
Autism spectrum disorder (ASD) is a highly heterogeneous disorder with the likely
coexistence of multiple subtypes. Currently, there are no brain-based diagnostic
criteria for the neurological disorder. Therefore, the search for biomarkers in ASD is
of utmost importance. Collaboration within autism research community has yielded
a database consortium, the Autism Brain Imaging Data Exchange (ABIDE) [27],
consisting of functional neuroimaging data collected across various sites inter-
nationally. The challenge is to analyze such data with inherent variability due to
di®erent magnetic resonance imaging (MRI) scanners, scanning parameters, and
subject recruitment procedures used across di®erent sites. This study implements
machine learning (ML) algorithms to classify autism functional neuroimaging data
from ABIDE. Neuroimaging-based diagnostics could potentially assist clinicians to
make more accurate diagnoses of autism, resulting in earlier behavior intervention
and treatment that is more e®ective.
International Journal of Semantic Computing
Vol. 7, No. 2 (2013) 205–213
°c World Scienti¯c Publishing Company
DOI: 10.1142/S1793351X13400102
205](https://image.slidesharecdn.com/b995a3c2-83bf-4cd0-99c6-18cefff45f42-151209205337-lva1-app6892/85/Autism_risk_factors-1-320.jpg)
![1.1. Background
Autism is a neurodevelopmental disorder characterized by impairments in social
behavior and communication skills, as well as by repetitive behaviors and restricted
interests. Results from twin studies [1, 2] have linked both genetic and environmental
factors to the disorder. In the past decade, autism has attracted much attention due
to increased prevalence ÀÀÀ currently estimated at 1 in 88 (CDC) ÀÀÀ and research
into the neural bases has grown rapidly.
The inherent heterogeneity of autism presents great challenges for researchers,
but evidence across neuroimaging modalities is now converging, implicating aberrant
connectivity patterns involving numerous functional networks [3– 5]. A prominent
source of data has been blood oxygen-level dependent functional magnetic resonance
imaging (BOLD fMRI), which measures °uctuations in oxygen levels in the brain as
an indirect measure of neuronal activity. Functional connectivity is the correlation of
the BOLD signal from di®erent regions of the brain and can be indicative of
underlying structural connectivity [6]. When compared to typical development (TD),
functional connectivity in task-activated fMRI has been found to be consistently
reduced in ASD between regions involved in a variety of cognitive tasks including
cognitive control, visual attention, language, memory, and theory of mind. Exam-
ination of spontaneous low-frequency BOLD °uctuations during ``resting state,"
where participants relax in the scanner without performing a task, has produced
mixed ¯ndings of both under- and overconnectivity between brain regions [7].
Currently, no single theory has been shown to unify these varied ¯ndings. Just
et al. [8] proposed a theory of generalized underconnectivity that is mostly consistent
with task-activated ¯ndings, but does not explain the mixed ¯ndings in resting-state
and intrinsic fcMRI. Di®erences in experimental design and data processing pipelines
were also posited as a potential source for variability in ¯ndings [3]. Furthermore, the
degree to which subject motion can confound data by producing arti¯cial long-
distance underconnectivity and local overconnectivity has only been recently
emphasized [9, 10], and many prior studies either did not protect against motion
confounds or did not describe the measures taken.
Given the complexities and inconsistencies of the ASD literature, data-driven
techniques provide exploratory approaches to uncovering connectivity patterns.
Machine learning is a natural ¯t for discovering such complex patterns, but has
rarely been reported in ASD literature. Two ML algorithms are implemented in this
study to perform a binary classi¯cation task of identifying features that detect
autism neuroimaging data. We explored a stochastic search algorithm, particle
swarm optimization (PSO), in combination with support vector machines (SVM) for
feature selection; its implementation is termed PSO-SVM. Another algorithm
explored in autism classi¯cation utilizes support vector machine methods based on
recursive feature elimination (RFE-SVM) for feature ranking.
In the current study, we combined the aforementioned data-driven methodo-
logical approaches to thoroughly examine regional and network connectivity in the
206 C. P. Chen, C. L. Keown & R.-A. M€uller](https://image.slidesharecdn.com/b995a3c2-83bf-4cd0-99c6-18cefff45f42-151209205337-lva1-app6892/85/Autism_risk_factors-2-320.jpg)
![clinical and control groups using resting-state fMRI data. For brain region parcel-
lation, we used 264 meta-analysis-de¯ned regions of interest; then examined the
underlying structure of connectivity patterns using ML and assess how well these
features classify the autistic clinical population.
1.2. Particle swarm optimization for feature selection
Particle swarm is a bio-inspired, stochastic optimization algorithm that models the
social behavior of swarming particles; it was ¯rst developed by Kennedy and Eber-
hart [23, 24]. The algorithm seeks to explore the search space by a population of
individuals or particles. Each particle represents a potential solution with a velocity,
which is dynamically adjusted according to its own experience and that of its
neighbors. The population of particles is updated based on each particle's previous
best performance and the best particle in the population. PSO combines local search
with global search for balancing the exploration and exploitation, thus it is useful for
searching high-dimensional problem spaces. Its implementation here was based on
[21], where a modi¯ed binary PSO algorithm is proposed for feature selection. The
feature space was made up of prede¯ned brain regions from previous meta-analysis of
functional neuroimaging studies that were then constructed as a correlation matrix
to quantify connectivity between brain regions. The features were selected by PSO
based on highest ¯tness scores, or cost function, then utilized for binary classi¯cation
by a linear SVM. The SVM seeks to minimize the upper bound of the generalization
error based on the structural risk mimization (SRM) principle that is known to have
high generalization performance [22]. Choosing the optimal input feature subset
in°uences the performance of the SVM; feature selection is an important issue in
building classi¯cation systems, which refers to choosing subset of attributes from the
set of original attributes. The key purpose is to identify signi¯cant features, eliminate
the irrelevant or dispensable features and build a good learning model. Using a new
learning scheme based on swarm intelligence, PSO has been found to be a promising
technique for real world engineering and optimization problems due to its strong
global search capability. PSO takes less time for each function evaluation and is very
easy to implement. In this study, a discrete binary PSO algorithm was used as a
feature selection vehicle to identify the most discriminant or informative features.
The main objective of this study was to exploit the maximum generalization capa-
bility of SVM and apply it to the autism neuroimaging data to distinguish clinical
from control populations. The PSO algorithm was utilized as a feature selection tool
to obtain a compact and discriminative feature subset, which improves the accuracy
and robustness of the subsequent classi¯ers.
1.3. Recursive feature elimination for feature ranking
We implemented an alternate approach for space dimensionality reduction using
SVM methods based on Recursive Feature Elimination (RFE). A known problem in
classi¯cation and machine learning is to reduce the dimensionality of the feature
Towards Understanding Autism Risk Factors 207](https://image.slidesharecdn.com/b995a3c2-83bf-4cd0-99c6-18cefff45f42-151209205337-lva1-app6892/85/Autism_risk_factors-3-320.jpg)
![space to overcome the risk of over¯tting. Since our data had high dimensionality in
the feature space (24,091 features) and comparatively small number of training
patterns (200 subjects), we face the risk of over¯tting where the decision function
that separates the training data does not perform well on the test data. In this study,
we implemented a pruning technique, proposed by Guyon, that eliminates some of
the original input features and retain a minimum subset of features that yield best
classi¯cation performance [25]. The proposed feature-ranking technique yields a
¯xed number of top ranked features, which may be selected for further analysis
or design a classi¯er. Using feature ranking coe±cients as classi¯er weights, the
inputs that are weighted by the largest value in°uence most the classi¯cation
decision. This multivariate classi¯er is optimized during training to handle multiple
variables, or features, simultaneously. RFE is an iterative method that trains the
classi¯er (by optimizing the weights), computes the ranking criterion for all features,
then removes the feature with smallest ranking criterion. This iterative procedure is
an instance of backward feature elimination. SVM RFE is an application of RFE
using the weight magnitude as ranking criterion. The output obtained from such
algorithm is a list of all features ranked in the order of most informative to least. We
then explore the optimal number of (top ranked) features that maximizes classi¯-
cation accuracy on the training data set. We applied the subset of top ranked fea-
tures to the independent test set to obtain the error rate and the predictive power of
the classi¯er.
2. Methods and Materials
We selected a subsample of 252 participants with low in-scanner head motion from
ABIDE, from which randomly selected 50 subjects to be the independent validation
sample with equal number of ASD and control. Data preprocessed with slice time,
¯eld map, and motion correction. Regions of interest selected using meta-analysis of
functional studies de¯ned 264 regions [20]. Pearson's correlation matrix constructed
to quantify connectivity between pairwise regions; the ML features are de¯ned as
connections. We implemented two ML algorithms to compare classi¯cation accuracy
and robustness of the classi¯er: (1) a stochastic search algorithm, particle swarm
optimization, was used for feature selection in combination with support vector
machines (PSO-SVM), (2) a recursive feature elimination (RFE-SVM) was used for
feature ranking.
2.1. Data
The data used in the current experiment was selected from the Autism Brain Imaging
Data Exchange (ABIDE, http://fcon 1000.projects.nitrc.org/indi/abide/, cite in
press), a collection of approximately 1100 resting-state scans [27] from 17 di®erent sites.
Instead of trying to maximize sample size, our primary goal in selecting participants was
208 C. P. Chen, C. L. Keown & R.-A. M€uller](https://image.slidesharecdn.com/b995a3c2-83bf-4cd0-99c6-18cefff45f42-151209205337-lva1-app6892/85/Autism_risk_factors-4-320.jpg)
![to maximize the data quality. We inspected the data and eliminated those exhibiting
artifacts or severe ringing, signal dropout, suboptimal registration or standardization
(see data preprocessing), or excessive motion (see motion section). Sites with fewer than
150 time points were also excluded. The remaining participants were matched on age
and in-scanner head motion to yield a ¯nal sample of 126 TD and 126 ASD, ranging
from six to thirty-six years old.
2.2. Data preprocessing
Data were processed using the Analysis of Functional NeuroImages software [11]
(afni.nimh.nih.gov) and FSL 5.0 [12] (www.fmrib.ox.ac.uk/fsl). Functional images
were slice-time corrected, motion corrected (3dvolreg) to align to the middle time
point, ¯eld-map corrected and aligned to the San Diego State University datasets
and aligned to the anatomical image using FLIRT [13, 14] with six degrees of free-
dom. FSL's nonlinear registration tool (FNIRT) was then used to standardize images
to the MNI152 standard image (3 mm isotropic) using sinc interpolation, and the
outputs were blurred to a global full-width-at-half-maximum of 6 mm. Given recent
concerns that traditional ¯ltering approaches can cause rippling of motion confounds
to neighboring time points [15], we used a second-order band-pass Butterworth ¯lter
[16, 17] to isolate low-frequency BOLD °uctuations (0:008 < f < 0:08 Hz) [18].
Regression of a total of 17 nuisance variables was performed to improve data
quality [17]. Nuisance regressors included six rigid-body motion parameters derived
from motion correction and the derivatives. White matter and ventricular masks
were created at the participant level using FSL's FAST image segmentation [19] and
trimmed to avoid partial-volume e®ects.An average time series was extracted from
each mask and was removed using regression, along with its corresponding deriva-
tive. Whole-brain global signal was also included as a regressor to mitigate cross-site
variability. All nuisance regressors were band-pass ¯ltered using the second-order
Butterworth ¯lter (0:008 < f < 0:08 Hz) [16, 17].
2.3. Motion
Motion was quanti¯ed as the Euclidean distance between the six rigid-body motion
parameters for two consecutive time points. For any instance greater than 0.25 mm,
considered excessive motion, the time point as well as the preceding and following
time points were censored, or ``scrubbed" [16]. If two censored time points occurred
within ten time points of each other, all time points between them were also cen-
sored. Subjects with fewer than 90% of time points or less than 150 total time points
remaining after censoring, were excluded from the analysis. Runs were then trun-
cated at the point where 150 usable time points was reached. Motion over the
truncated run was summarized for each participant as the average Euclidean dis-
tance moved between time points (including areas that were censored) and was
well-matched between group (p ¼ 0:92).
Towards Understanding Autism Risk Factors 209](https://image.slidesharecdn.com/b995a3c2-83bf-4cd0-99c6-18cefff45f42-151209205337-lva1-app6892/85/Autism_risk_factors-5-320.jpg)
![pairwise brain connections, we illustrated the features in the connectogram that shows
regions of the brain and connectivity (see Fig. 2). The image is divided into two
halves ÀÀÀ the left and right hemisphere. Within each half, regions are grouped into
lobes (frontal, temporal, occipital, etc.) from anterior (top of image) to posterior
(bottom of image). Within each lobe, ¯ne anatomical and functional divisions (par-
celations) are shown as labeled segments. The label of each segment is an abbreviated
code. For example, SupPrCS is the superior part of the precentral sulcus.The order
and position of the parcelations is ¯xed across patients and composes a static coor-
dinate system [26]. Within the center of the connectogram are the observed connec-
tions between parcelations, measured in vivo. The red lines represent overconnected
features, where ASD connectivity is greater than TD; the green lines represent
underconnected features, where ASD connectivity is less than TD.
Fig. 2. Connectogram reveals no obvious regional pattern of informative connections.
Towards Understanding Autism Risk Factors 211](https://image.slidesharecdn.com/b995a3c2-83bf-4cd0-99c6-18cefff45f42-151209205337-lva1-app6892/85/Autism_risk_factors-7-320.jpg)
![4. Conclusions
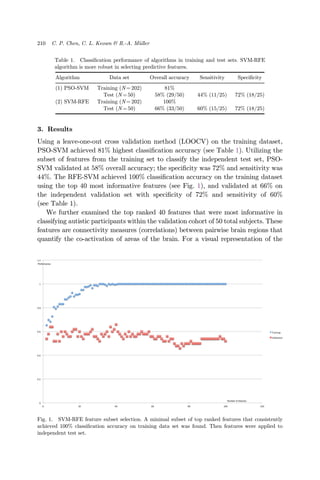
Using a subset of low-motion rs-fMRI data from ABIDE, algorithm (2) RFE-SVM
performed perfectly on a training data set and moderately well (66% accuracy)
on a test set. The 40 most informative features (regional brain connections) are
widely distributed with 90% mid- to long-distance connections (> 40 mm Euclidian
distance); where the majority (80%) of connections are within the left hemisphere or
interhemispheric. The 40 selected features have disproportionately strong contri-
bution from somatosensory and motor regions (especially face).We ¯nd no clear
pattern of connectivity that generalizes the behavioral symptoms of autism.Though
with moderate classi¯cation accuracy, our results suggest that behavior-based
diagnostic criteria (generally taken for granted in ASD research) are not fully ade-
quate for identifying a brain-based set of disorders. Rather than being solely
attributed to limitations of ML approaches, modest classi¯cation performance may
re°ect inadequacies of diagnostic procedures.
References
[1] S. E. Folstein and B. Rosen-Sheidley, Genetics of autism: Complex aetiology for a
heterogeneous disorder, Nat. Rev, Genet. 2(12) (2001) 943–955.
[2] J. Hallmayer, S. Cleveland et al., Genetic heritability and shared environmental factors
among twin pairs with autism, Arch. Gen. Psychiatry 68(11) (2011) 1095–1102.
[3] R. A. Muller, P. Shih et al., Underconnected, but how? A survey of functional connec-
tivity MRI studies in autism spectrum disorders, Cereb. Corte. 21(10) (2011) 2233–2243.
[4] S. E. Schipul, T. A. Keller et al., Inter-regional brain communication and its disturbance
in autism, Front. Syst. Neurosci. 5 (2011) 10.
[5] M. E. Vissers, M. X. Cohen et al., Brain connectivity and high functioning autism:
A promising path of research that needs re¯ned models, methodological convergence, and
stronger behavioral links, Neurosci. Biobehav. Rev. 36(1) (2012) 604–625.
[6] C. J. Honey, O. Sporns et al., Predicting human resting-state functional connectivity
from structural connectivity, in Proc. Natl. Acad. Sci. USA 106(6) (2009) 2035–2040.
[7] C. S. Monk, S. J. Peltier et al., Abnormalities of intrinsic functional connectivity in
autism spectrum disorders, Neuroimage 47(2) (2009) 764–772.
[8] M. A. Just, V. L. Cherkassky et al., Cortical activation and synchronization during
sentence comprehension in high-functioning autism: Evidence of underconnectivity,
Brain 127(Pt.8) (2004) 1811–1821.
[9] J. D. Power, K. A. Barnes et al., Spurious but systematic correlations in func-
tional connectivity MRI networks arise from subject motion, Neuroimage 59(3) (2012)
2142–2154.
[10] K. R. Van Dijk, M. R. Sabuncu et al., The in°uence of head motion on intrinsic func-
tional connectivity MRI, Neuroimage 59(1) (2012) 431–438.
[11] R. W. Cox, AFNI: Software for analysis and visualization of functional magnetic res-
onance neuroimages, Computers and Biomedical Research 29 (1996) 162–173.
[12] S. M. Smith, M. Jenkinson et al., Advances in functional and structural MR image
analysis and implementation as FSL, Neuroimage 23 Suppl. 1 (2004) S208–219.
[13] M. Jenkinson, P. Bannister et al., Improved optimization for the robust and accu-
rate linear registration and motion correction of brain images, Neuroimage 17(2) (2002)
825–841.
212 C. P. Chen, C. L. Keown & R.-A. M€uller](https://image.slidesharecdn.com/b995a3c2-83bf-4cd0-99c6-18cefff45f42-151209205337-lva1-app6892/85/Autism_risk_factors-8-320.jpg)
![[14] M. Jenkinson and S. Smith, A global optimisation method for robust a±ne registration of
brain images, Med. Image. Anal. 5(2) (2001) 143–156.
[15] J. Carp, Optimizing the order of operations for movement scrubbing: Comment on
Power et al., Neuroimage (2011).
[16] J. D. Power, K. A. Barnes et al., Steps toward optimizing motion artifact removal in
functional connectivity MRI; a reply to Carp, Neuroimage (2012).
[17] T. D. Satterthwaite, M. A. Elliott et al., An improved framework for confound regression
and ¯ltering for control of motion artifact in the preprocessing of resting-state functional
connectivity data, Neuroimage 64 (2013) 240–256.
[18] D. Cordes, V. M. Haughton et al., Frequencies contributing to functional connecti-
vity in the cerebral cortex in resting-state data, AJNR Am J. Neuroradiol 22(7) (2001)
1326–1333.
[19] Y. Zhang, M. Brady et al., Segmentation of brain MR images through a hidden Markov
random ¯eld model and the expectation-maximization algorithm, IEEE. Trans. Med.
Imaging 20(1) (2001) 45–57.
[20] J. D. Power, C. A. L. et al., Functional network organization of the human brain, Neuron
72 (2011) 665–678.
[21] X. Wang, Y. J. , X. Teng, W. Xia and R. Jensen, Feature selection based on rough sets
and particle swarm optimization, Pattern Recognition Letters 28 (2007) 459–471.
[22] V. M. Vapnik, The Nature of Statistical Learning Theory. (Springer, New York, 1995).
[23] J. Kennedy and R. C. Eberhart, Particle swarm optimization, in Proceedings of the IEEE
International Conference on Neural Network, Vol. 4, 1995, pp. 1942–1948.
[24] R. C. Eberhart and J. Kennedy. A new optimizer using particle swarm theory, in
Sixth International Symposium on Micro Machine and Human Science, Nagoya (1995),
pp. 39–43.
[25] I. Guyon and V. Vapnik, Gene selection for cancer classi¯cation using support vector
machines, Machine Learning 46 (2002) 389–422.
[26] A. Irimia, M. C. Chambers, Torgerson and Horn, Circular representation of human
cortical networks for subject and population-level connectomic visualization, Neuro-
image 60(2) (2012) 1340–1351.
[26] A. Di Martino, M. P. Milham et al., The autism brain imaging data exchange: Towards a
large-scale evaluation of the instrinsic brain architecture in atusim, Mol. Psychiatry
(2013).
Towards Understanding Autism Risk Factors 213](https://image.slidesharecdn.com/b995a3c2-83bf-4cd0-99c6-18cefff45f42-151209205337-lva1-app6892/85/Autism_risk_factors-9-320.jpg)

This document describes two machine learning techniques, particle swarm optimization with support vector machines (PSO-SVM) and recursive feature elimination with support vector machines (RFE-SVM), that were used to classify autism neuroimaging data from the Autism Brain Imaging Data Exchange database. PSO-SVM was used to select discriminative features for classification, while RFE-SVM ranked features by importance. Both techniques aimed to improve classification accuracy and reduce overfitting by selecting optimal feature subsets from the high-dimensional neuroimaging data. The results could help develop brain-based diagnostic criteria for autism.


![[IGC 2016] 에픽게임스코리아 신광섭 - 언리얼 엔진4, VR과 AR](https://cdn.slidesharecdn.com/ss_thumbnails/5-161009030855-thumbnail.jpg?width=640&height=640&fit=bounds)


![[IGC 2016] 엔씨소프트 홍상범 - 3D아티스트 위한 프로그램 연동하여 개발 제작 환경 개선하기](https://cdn.slidesharecdn.com/ss_thumbnails/2-161009023903-thumbnail.jpg?width=640&height=640&fit=bounds)
![[IGC 2016] 버프스튜디오 김도형 - 용사는 진행중2 포스트모템](https://cdn.slidesharecdn.com/ss_thumbnails/4-161009034325-thumbnail.jpg?width=640&height=640&fit=bounds)