Download to read offline


![3
CHAPTER 2
METHODS AND MATERIALS
Data were selected from the Autism Brain Imaging Data Exchange (ABIDE,
http://fcon_1000.projects.nitrc.org/indi/abide/; Di Martino, Yan, et al., 2013), a collection of
over 1100 resting-state scans from 17 different sites. In view of the sensitivity of intrinsic
fcMRI analyses to motion artifacts and noise (as described below), we prioritized data quality
over sample size. We excluded any datasets exhibiting artifacts, signal dropout, suboptimal
registration or standardization, or excessive motion (see details below). Sites acquiring fewer
than 150 time points were further excluded. Based on these criteria, we selected a subsample
of 252 participants with low head motion. Groups were matched on age and motion to yield a
final sample of 126 TD and 126 ASD, ranging in age from six to thirty-six years (see
Table 2.1).
Table 2.1. Participant Information
Full Sample ASD
M ± SD
[range]
TD
M ± SD
[range]
p-value
(2-sample t-
test)
N (Female) 126 (18) 126 (31)
Age (years) 17.311 ± 6.00
[8.2 - 35.7]
17.116 ± 5.700
[6.5 – 34]
0.800
Motion (mm) .057 ± .020
[.018-.108]
.058 ± .020
[.020-.125]
0.923
Non-verbal IQ 106.86 ± 17.0
[37-149]
106.28 ± 12.8
[67-155]
0.800
2.1 DATA PREPROCESSING
Data were processed using the Analysis of Functional NeuroImages software
(afni.nimh.nih.gov; Cox, 1996) and FSL 5.0 (www.fmrib.ox.ac.uk/fsl; Smith et al., 2004).
Functional images were slice-time corrected, motion corrected to align to the middle time](https://image.slidesharecdn.com/c88d9772-4e2c-40d0-8f87-6908cf64410d-151209205901-lva1-app6892/85/Chen_Colleen_Thesis_2014-14-320.jpg)


![17
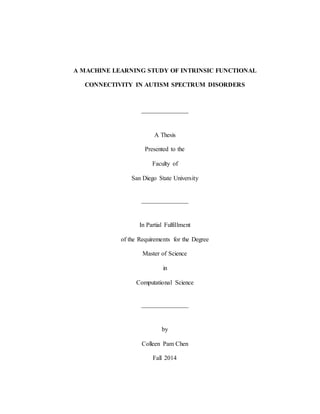
Figure 3.2. Informative features selectedby RF. (A) Pie chart showing the number of
informative ROIs per functional network. (B) Normalized number of informative ROIs
per network (ratio of the number of times network ROIs participate in an informative
connection divided by the total number of ROIs in given network). This number can
exceed1 because a given ROI may participate in several informative connections. (C)
Heatmap of informative connections by functional networks. (D) Number of
informative ROIs per anatomical parcellation. (E) Normalized number of informative
ROIs per anatomical parcel (ratio of the number of times anatomical ROIs participate
in an informative connection divided by the total number of ROIs in given parcel). (F)
Heatmap of informative connections by anatomical parcel. Abbreviated labels: DMN,
default mode network; SMH, somatosensory and motor [hand]; VIS, visual; SAL,
salience; SUB, subcortical; SMM, somatosensory and motor [mouth]; FPTC, frontal
parietal task control; AUD, audio; UN, unknown; VA, ventral attention; COTC,
cingulo opercular task control; DA, dorsal attention; MR, memory retrieval; CEB,
cerebellum.](https://image.slidesharecdn.com/c88d9772-4e2c-40d0-8f87-6908cf64410d-151209205901-lva1-app6892/85/Chen_Colleen_Thesis_2014-28-320.jpg)


![24
Table 4.1. ABIDE Demographic Information
Sites Sample Size Age RMSD NVIQ Gender ADOS_total Handedness
ASD TD ASD
mean (SD)
[range]
TD ASD
mean (SD)
[range]
TD ASD
mean (SD)
[range]
TD Male Female Range
[range]
NA Left Right
Full Sample
NYU (N=70) 36 34 15.6 (6) 16.96 (6.17) .02 (.02) .02 (.02) 108 (15.1) 103 (14.9) 54 16 [5-22] 0 NA NA
[8.5-30] [6.4-30.8] [.03-.09] [.03-.09] [72-149] [67-137]
UM_1 (N=29) 15 14 14.7 (2.1) 15.5 (2.8) .06 (.02) .05 (.02) 112 (19.6) 102.2 (9.4) 17 12 NA 15 5 21
[11.5-18.6] [11-19] [.02-.09] [.02-.08] [81-148] [82-113]
USM (N=29) 19 20 21.9 (6.4) 6.4 (7.2) .05 (.02) .06 (.02) 105.7 (13) 111 (12.5) 29 0 [6-21] 0 NA NA
[11.3-35.7] [13.8-34] [.02-.09] [.03-.09] [75-133] [90-129]
SDSU (N=25) 10 15 14.6 (2.3) 13.4 (2.3) .03 (.01) .04 (.02) 112 (16) 111 (11) 21 4 [4-17] 0 6 19
[9.6-17.7] [8-16.8] [.02-.05] [.02-.07] [86-114] [92-137]
Leuven_1 (N=17) 9 8 22.2 (4.9) 23.75 (2.9) .061 (.02) .065 (.02) 103 (16.4) 114 (18.9) 17 0 NA 9 1 16
[19-32] [21-29] [.04-.09] [.04-.09] [74-120] [93-155]
Leuven_2 (N=17) 8 9 13.8 (1.1) 14.3 (1.4) .07 (.01) .08 (.02) 97.5 (11.8) 101.4 (6.5) 11 6 NA 8 4 13
[12.2-15.3] [12.3-16.6] [.05-.1] [.05-.1] [83-117] [89-109]
PITT (N=14) 8 6 21.2 (8.4) 20.2 (4.1) .07 (.02) .09 (.02) 11.7 (14.2) 115 (5.3) 12 2 [7-19] 1 1 13
[12.6-35.2] [12.8-24.6] [.04-.1] [.07-.1] [93-128] [108-121]
TRINITY (N=12) 4 8 17.2 (3.4) 17.9 (4) .06 (.010) .07 (.01) 121 (7.4) 111 (6.2) 12 0 [7-15] 0 0 12
[13.6-20.8] [12.7-24.8] [.05-.07] [.06-.07] [114-131] [103-121]
YALE (N=12) 6 6 14.6 (1.9) 13.2 (3.4) .06 (.02) .05 (.01) 85 (29) 97 (11.2) 8 4 NA 5 1 11
[11.8-17.2] [8.7-16.7] [.03-.09] [.03-.06] [37-120] [84-115]
KKIN (N=8) 3 5 9.9 (1.51) 9.9 (1.7) .01 (.004) .01 (.02) NA NA 6 2 [10-16] 0 1 7
[8.2-11.1] [8.5-12.8] [.06-.07] [.05-.1]
OLIN (N=8) 4 4 18.3 (4.03) 19.5 (2.4) .09 (.01) .09 (.3) NA NA 6 2 [7-19] 4 0 8
[15-24] [16-21] [.07-.1] [.06-.1]
(table continues)](https://image.slidesharecdn.com/c88d9772-4e2c-40d0-8f87-6908cf64410d-151209205901-lva1-app6892/85/Chen_Colleen_Thesis_2014-35-320.jpg)
![25
Table 4.1. (continued)
Sites Sample Size Age RMSD NVIQ Gender ADOS_total Handedness
ASD TD ASD
mean (SD)
[range]
TD ASD
mean (SD)
[range]
TD ASD
mean (SD)
[range]
TD Male Female Range
[range]
NA Left Right
UM_2 (N=6) 1 5 17.4 (NA) 18.4 (5.9) .08 (NA) .05 (.01) 80 (NA) 102 (6.8) 6 0 NA 1 0 6
[17.4-17.4] [14.5-28.9] [.08-.08] [.03-.06] [80-80] [92-109]
CMU (N=5) 3 2 26.7 (4.5) 26 (.07) .06 (.02) .08 (.01) 113.7 (10.8) 109.5 (0.7) 4 1 [8-16] 0 0 5
[22-31] [21-31] [.04-.07] [.07-.08] [106-126] [109-110]
Training
NYU (N=60) 31 29 15.96 (6.22) 16.96 (6.50) .05 (.02) 0.05 (0.02) 108.03 (15.80) 102.93 (15.17) 46 14 [6-22] 29 NA NA
[8.51 - 29.98] [6.47 - 30.78] [.03 -.09] [0.03 - 0.09] [72.00 - 149.00] [67.00 - 137.00]
UM_1 (N=25) 14 11 14.64 (2.11) 15.28 (2.85) 0.06 (0.02) 0.05 (0.02) 111.43 (19.97) 105.11 (6.72) 15 10 NA 14 5 17
[11.50 - 18.60] [11.00 - 19.20] [0.02 - 0.09] [0.02 - 0.08] [81.00 - 148.00] [92.00 - 113.00]
Leuven_1 (N=17) 9 8 22.22 (4.87) 23.75 (2.92) 0.06 (0.02) 0.07 (0.02) 103.00 (16.42) 113.88] (18.88) 17 0 NA 9 1 16
[19.00 - 32.00] [21.00 - 29.00] [0.04 - 0.09] [0.04 - 0.09] [74.00 - 120.00] [93.00 - 155.00
SDSU (N=17) 9 8 15.19 (1.65) 13.43 (3.35) 0.03 (0.01) 0.04 (0.01) 112.67 (16.77) 110.25 (13.61) 17 0 [4-17] 0 5 12
[12.88 - 17.67] [8.02 - 16.59] [0.02 - 0.05] [0.02 - 0.07] [86.00 - 140.00] [92.00 - 137.00]
USM (N=16) 8 8 23.67 (7.35) 21.60 (6.84) 0.05 (0.02) 0.06 (0.02) 101.75 (6.82) 111.38 (13.22) 16 0 [9-17] 0 NA NA
[15.85 - 35.71] [13.81 - 34.01] [0.02 - 0.07] [0.03 - 0.09] [87.00 - 106.00] [90.00 - 129.00]
Leuven_2 (N=14) 6 8 13.53 (1.23) 14.59 (1.32) 0.07 (0.01) 0.07 (0.01) 96.17 (9.54) 102 (6.70) 8 6 NA 6 3 11
[12.20 - 15.30] [12.30 - 16.60] [0.05 - 0.08] [0.05 - 0.10] [83.00 - 106.00] [89.00 - 109.00]
PITT (N=11) 6 5 23.03 (9.07) 20.01 (4.56) 0.08 (0.02) 0.09 (0.01) 114.67 (14.90) 114.20 (5.07) 10 1 [7-19] 1 1 10
[12.62 - 35.20] [12.83 - 24.60] [0.06 - 0.11] [0.07 - 0.11] [93.00 - 128.00] [108.00- 119.00]
YALE (N=9) 4 5 14.96 (2.39) 12.53 (3.30) 0.07 (0.02) 0.04 (0.01) 84.75 (37.03) 98.20 (12.32) 8 1 NA 3 1 8
[11.83 - 17.17] [8.67 - 16.66] [0.04 - 0.09] [0.03 - 0.06] [37.00 - 120.00] [84.00 - 115.00]
KKI (N=8) 3 5 9.88 (1.51) 9.91 (1.69) 0.07 (0.00) 0.07 (0.02) NA NA 6 2 [10-16] 0 1 7
[8.20 - 11.14] [8.46 - 12.76] [0.06 - 0.07] [0.05 - 0.10]
OLIN (N=7) 3 4 18.3 (4.93) 19.50 (2.38) 0.09 (0.01) 0.09 (0.03) NA NA 5 2 [9-19] 0 0 7
3[15.00- 24.00] [16.00 - 21.00] [0.08 - 0.10] [0.06 - 0.13]
(table continues)](https://image.slidesharecdn.com/c88d9772-4e2c-40d0-8f87-6908cf64410d-151209205901-lva1-app6892/85/Chen_Colleen_Thesis_2014-36-320.jpg)
![26
Table 4.1. (continued)
Sites Sample Size Age RMSD NVIQ Gender ADOS_total Handedness
ASD TD ASD
mean (SD)
[range]
TD ASD
mean (SD)
[range]
TD ASD
mean (SD)
[range]
TD Male Female Range
[range]
NA Left Right
TRINITY (N=7) 3 4 16.46 (3.79) 19.48 (4.53) 0.06 (0.01) 0.06 (0.01) 123.00 (7.21) 112.00 (6.38) 7 0 [7-15] 0 0 7
[13.58 - 20.75] [13.75 - 24.83] [0.05 - 0.07] [0.06 - 0.08]
[117.00 -
131.00] [107.00- 121.00]
CMU (N=5) 3 2 26.67 (4.51) 26.00 (7.07) 0.06 (0.02) 0.08 (0.01) 113.67 (10.79) 109.50 (0.71) 4 1 [8-16] 0 0 5
[22.00 - 31.00] [21.00 - 31.00] [0.04 - 0.08] [0.07 - 0.08]
[106.00 -
126.00] [109.00- 110.00]
UM_2 (N=4) 1 3 17.40 (0.00) 15.23 (0.67) 0.08 (0.00) 0.04 (0.02) 80.00 (0.00) 99.33 (7.02) 4 0 NA 1 0 4
[17.40 - 17.40] [14.50 - 15.80] [0.08 - 0.08] [0.03 - 0.06] [80.00 - 80.00] [92.00 - 106.00]
Validation
USM (N=13) 11 2 20.7 (5.7) 28.2 (5.6) .05 (.02) .06 (.005) 105.9 (17.9) 109.5 (11.3) 12 1 [6-21] 1 NA NA
[11.4-32.8] [22-34] [.03-.09] [.05-.07] [75-133] [100-119]
NYU (N=10) 5 5 13.1 (3.99) 16.4 (4.3) .07 (.02) .05 (.01) 38.8 (11.5) 102.8 (14.7) 2 8 [5-13] 0 NA NA
[8.9-17.9] [9.8-20.0] [.04-.09] [.03-.06] [92-119] [83-117]
SDSU (N=8) 1 7 9.64 13.5 (2.9) 0.025 .04 (.018) 112 111.7 (8.3) 4 4 11 0 1 7
[9.6-16.8] [.02-.07] [103-124]
TRINITY (N=5) 1 4 19.4 16.3 (3.2) 0.057 .066 (.0087) 114 109.8 (6.7) 5 0 13 0 5
[12.7-20.1] [.05-.076] [103-116]
UM_1 (N=4) 1 3 16.1 16.2 (2.7) 0.048 .05 (.01) 125 178 (9.9) 2 2 NA 1 0 4
[13.1-18.2] [.03-.06] [82-96]
Leuven_2 (N=3) 2 1 14.5 (.29) 12.4 .08 (.02) 0.11 101.5 (21.9) 97 3 0 NAN 3 1 2
[14.3-14.7] [.07-.09] [86-117]
PITT (N=3) 2 1 15.6 (1.9) 21.22 .05 (.03) 0.11 103 (9.9) 121 2 1 [12-16] 0 0 3
[14.2-16.9] [.03-.07] [96-110]
YALE (N=3) 2 1 14 (0.53) 16.66 .049 (.02) 0.057 85 (1.4) 93 0 3 NA 2 0 3
[13.66-14.4] [.03-.06] [84-86]
UM_2 (N=2) 0 2 NA 23.2 (7.9) NA .06 (.003) NA 107.5 (2.2) 2 0 NA NA 0 2
[17.6-28.8] [.058-.06] [106-109]
OLIN (N=1) 1 0 18 NA 0.07 NA NA NA 1 0 7 0 0 1](https://image.slidesharecdn.com/c88d9772-4e2c-40d0-8f87-6908cf64410d-151209205901-lva1-app6892/85/Chen_Colleen_Thesis_2014-37-320.jpg)


This study used machine learning techniques to classify functional connectivity data from resting-state fMRI scans as coming from individuals with autism spectrum disorder or typically developing controls. The study selected 252 low-motion scans from the ABIDE dataset, matching 126 ASD and 126 control participants on age, motion, and IQ. Functional connectivity between 220 regions of interest was used as features for three machine learning algorithms: particle swarm optimization with support vector machines, recursive feature elimination with support vector machines, and random forest. Random forest achieved the highest classification accuracy of 91% using the top 100 informative functional connections as features. These connections prominently involved somatosensory, default mode, visual, and subcortical regions. The findings suggest distributed and complex