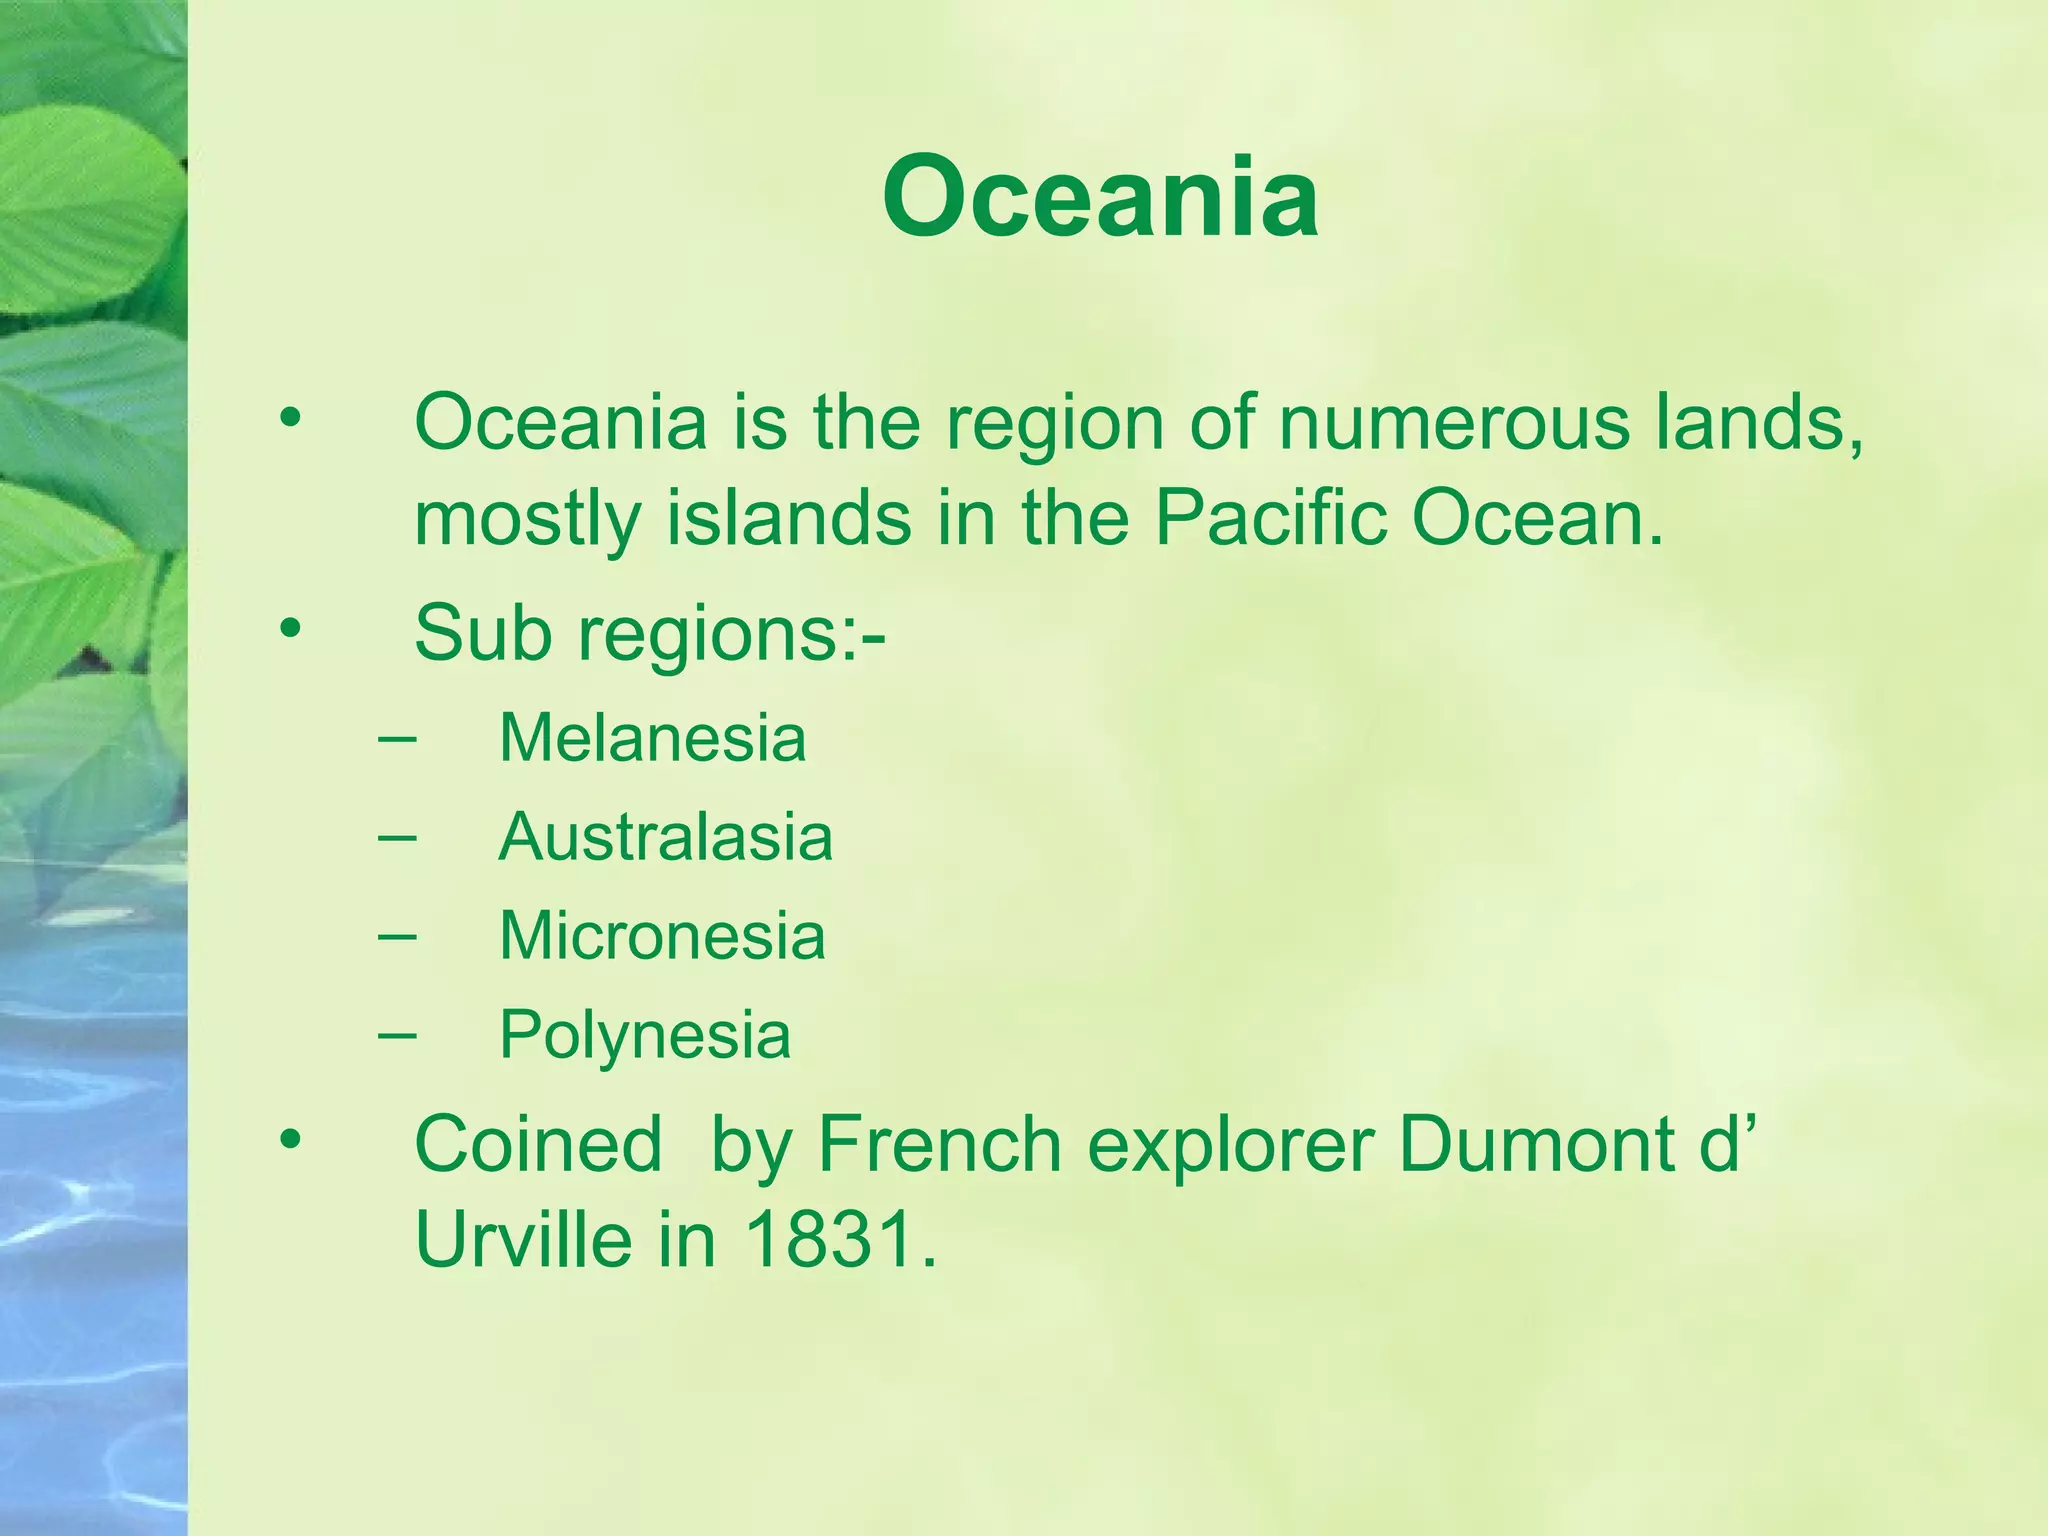
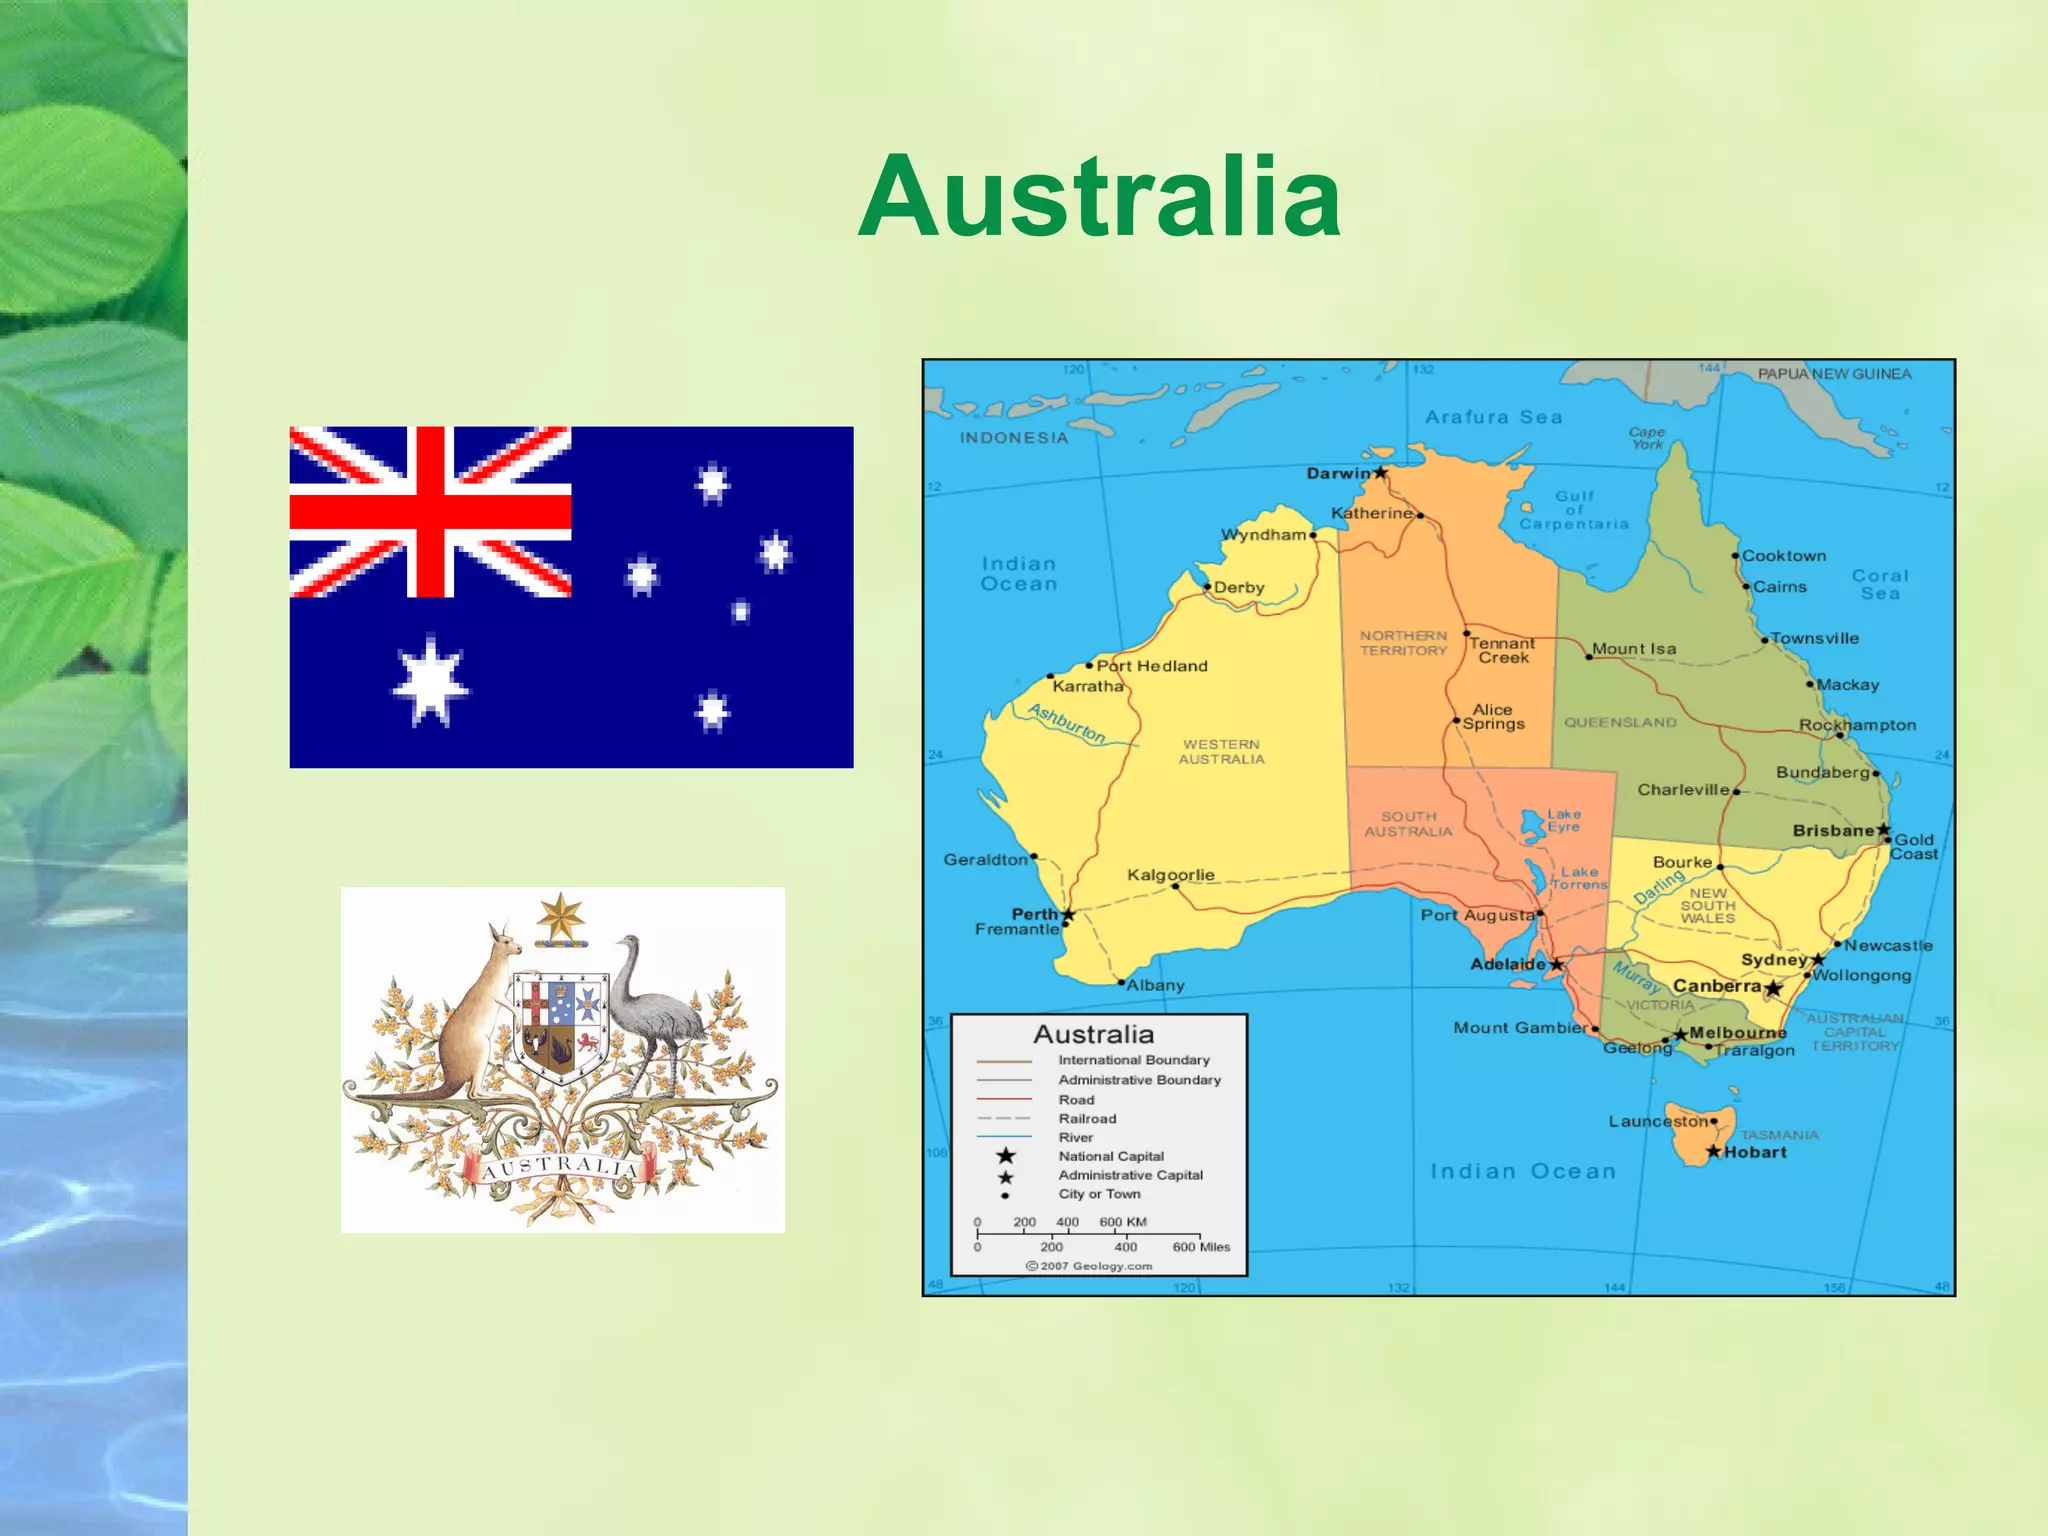
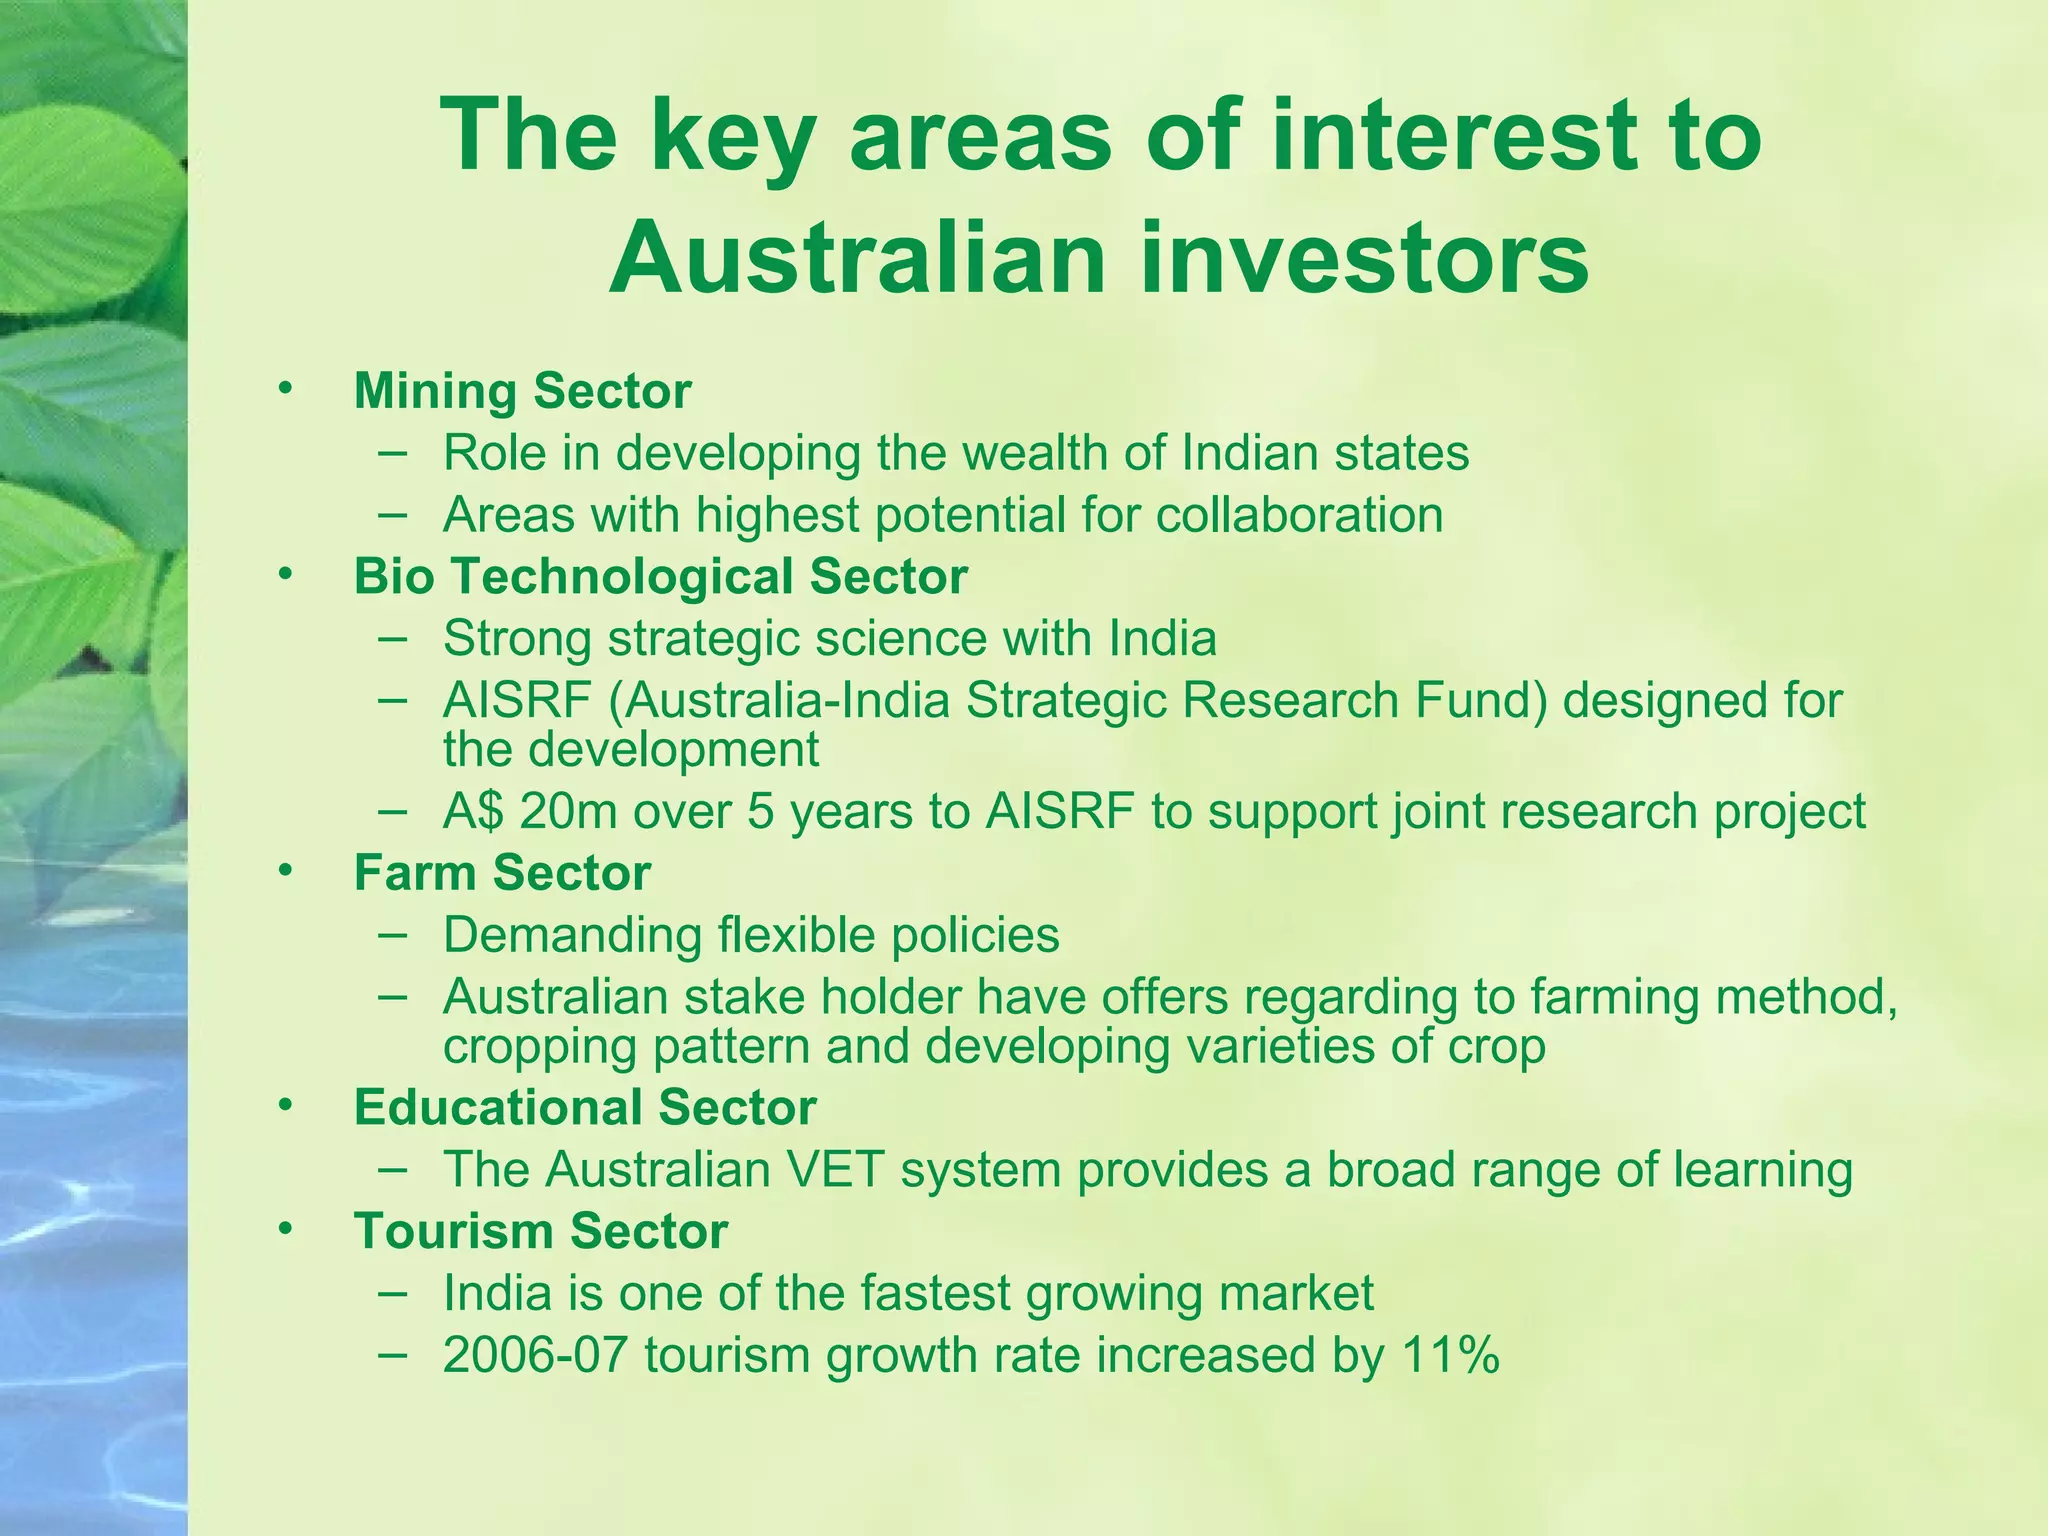
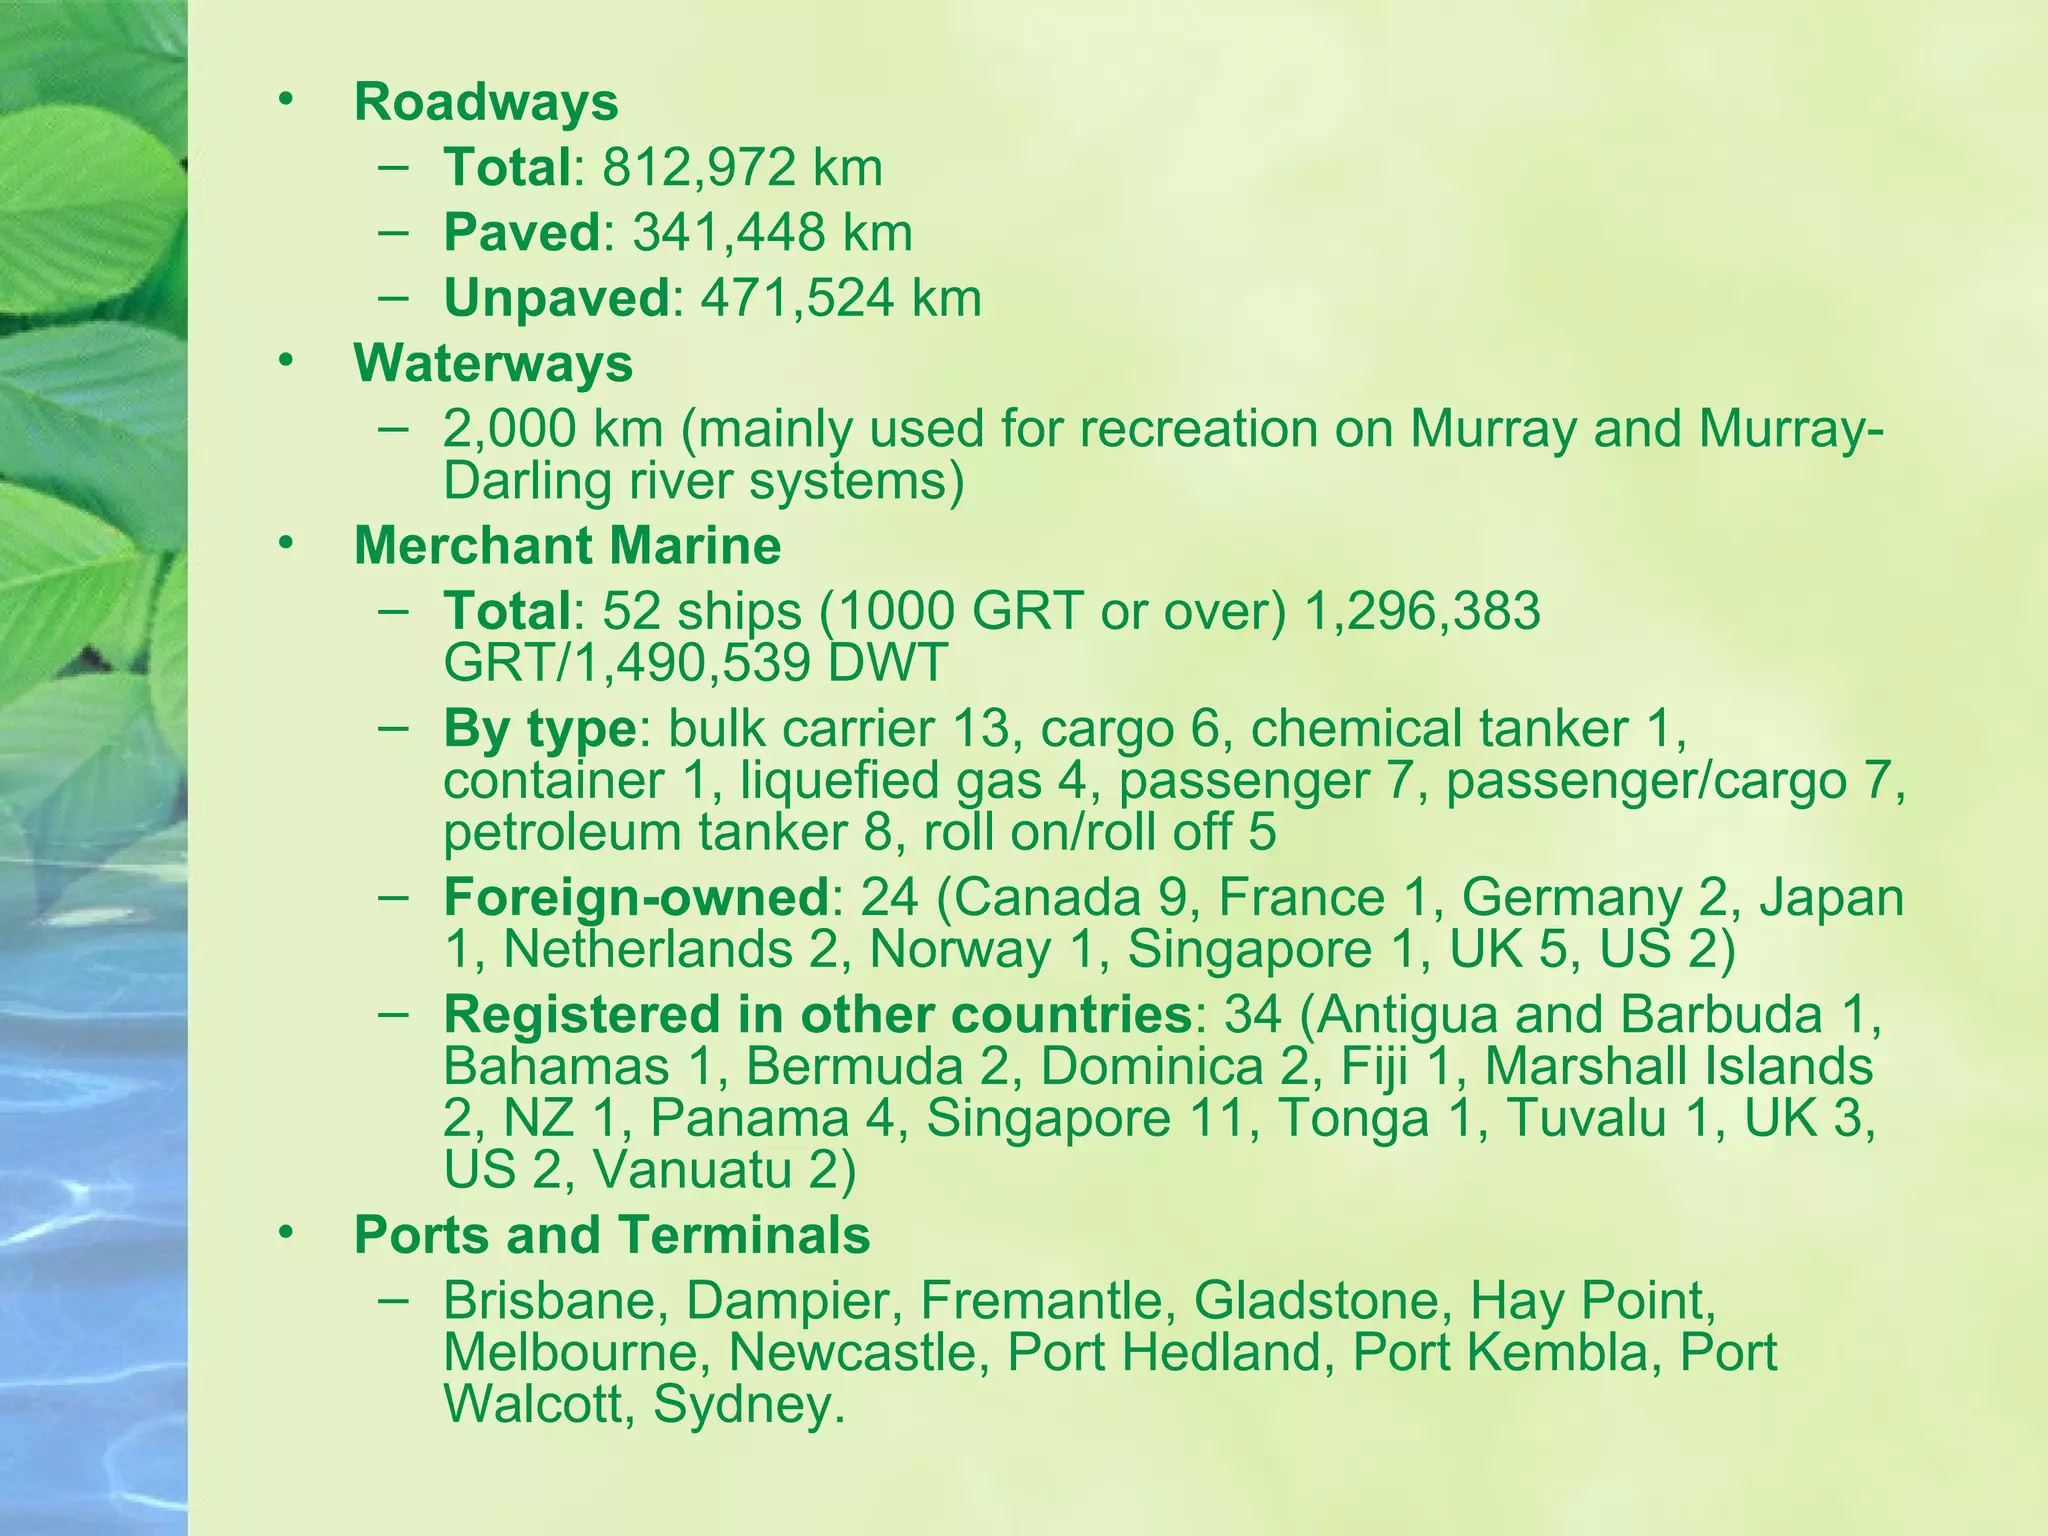
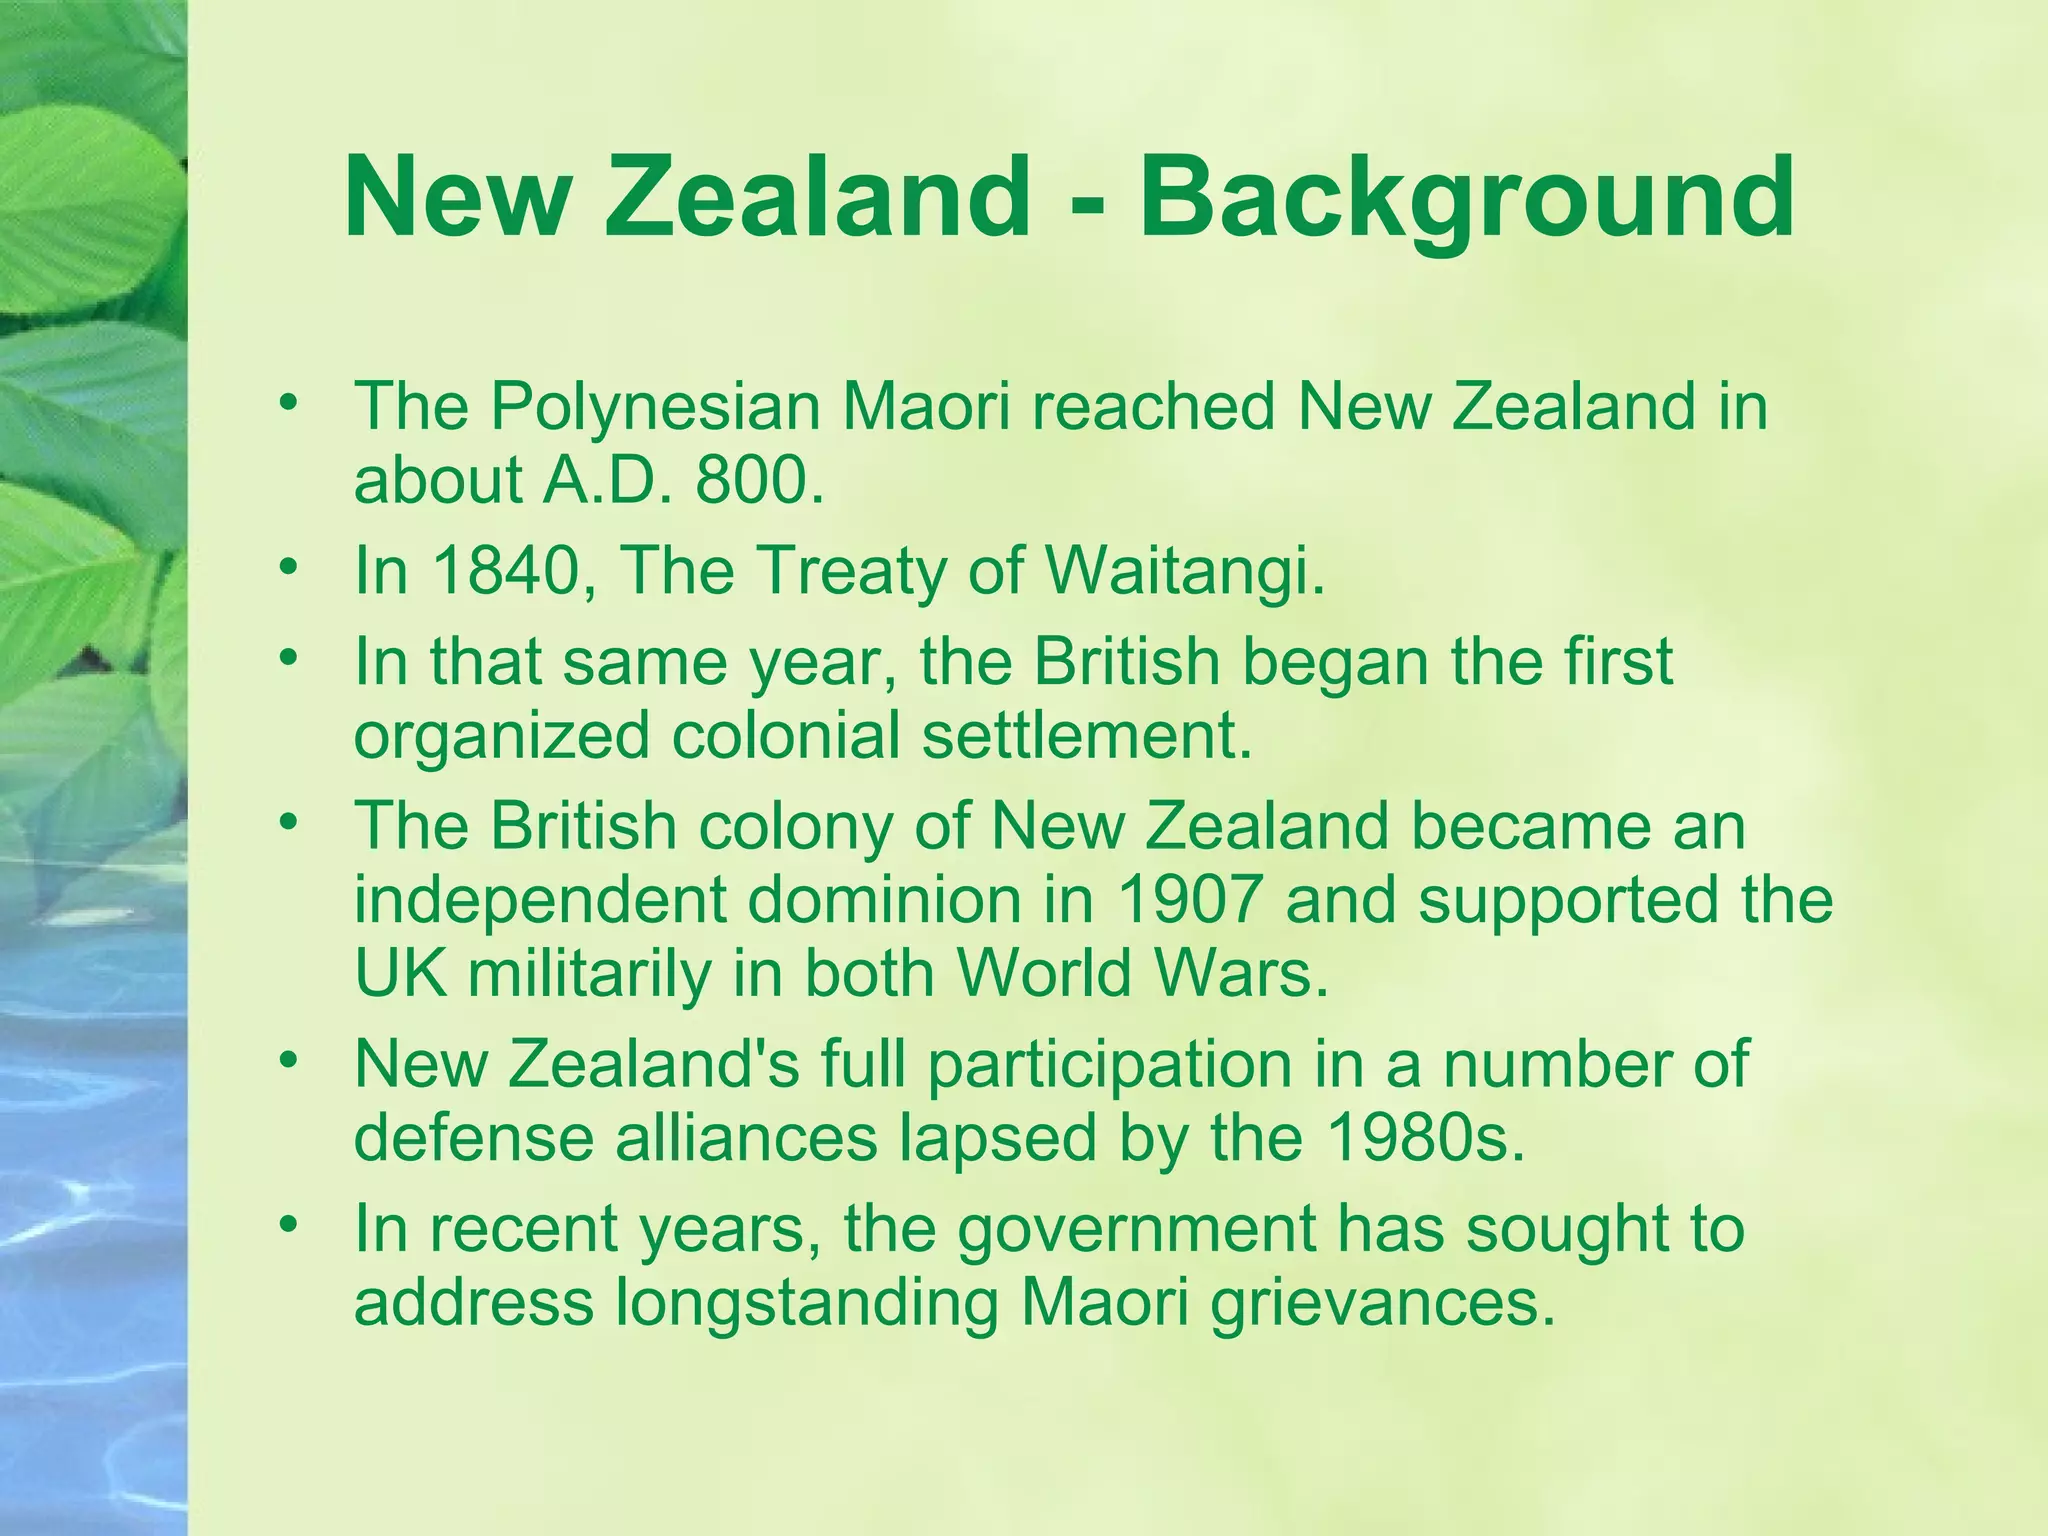
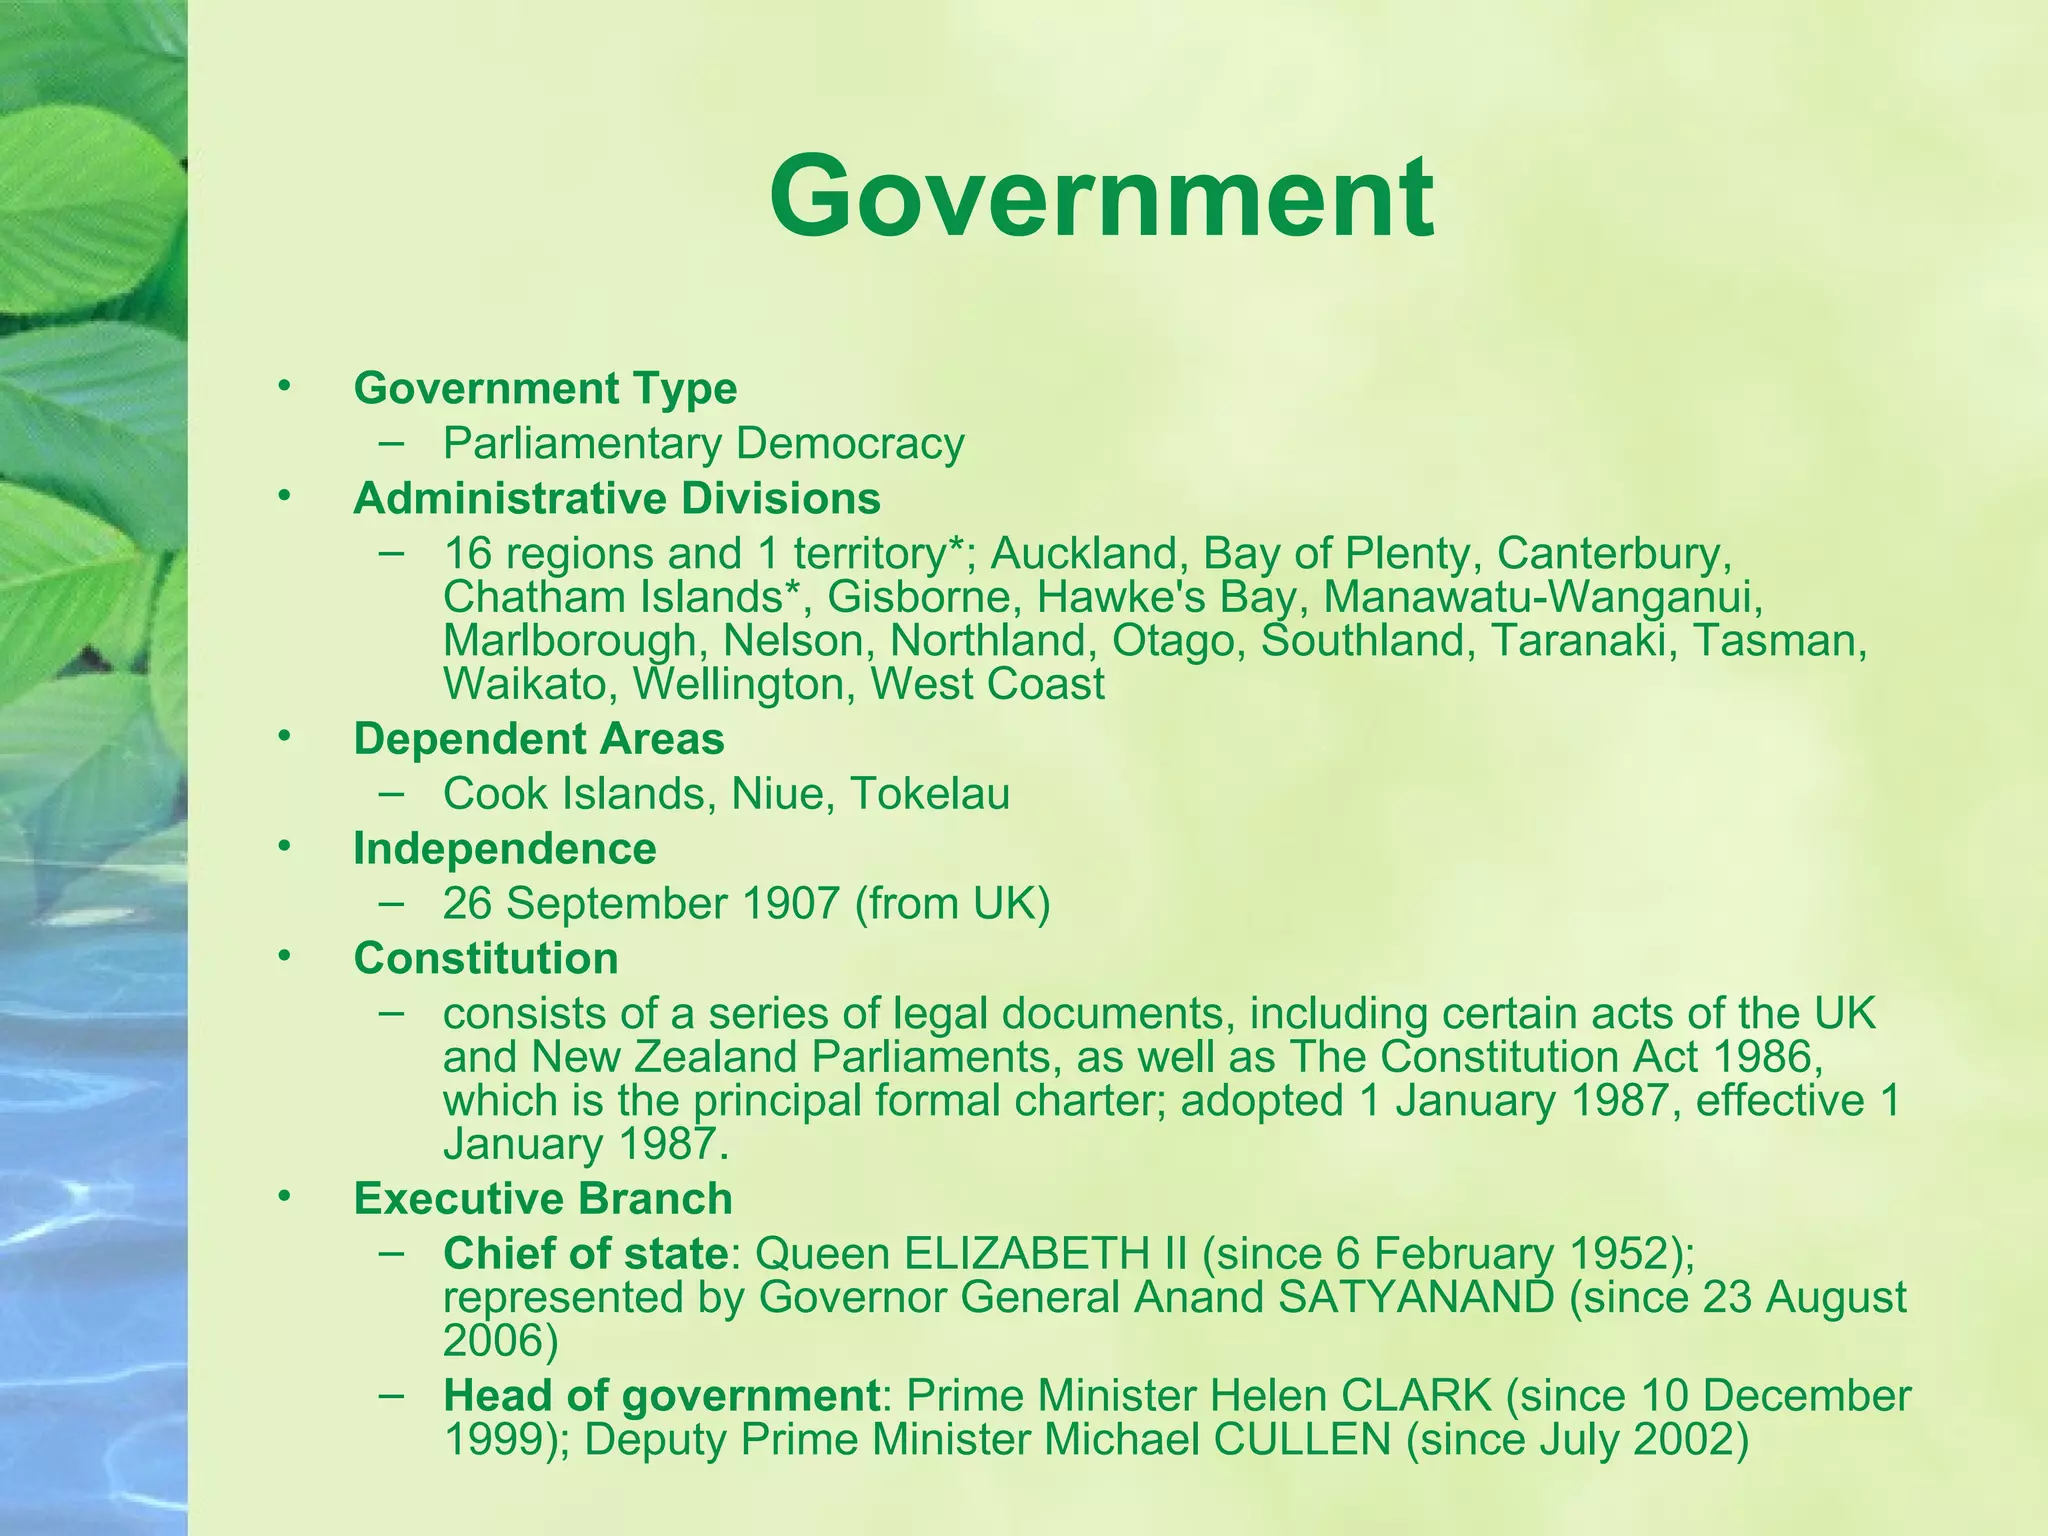
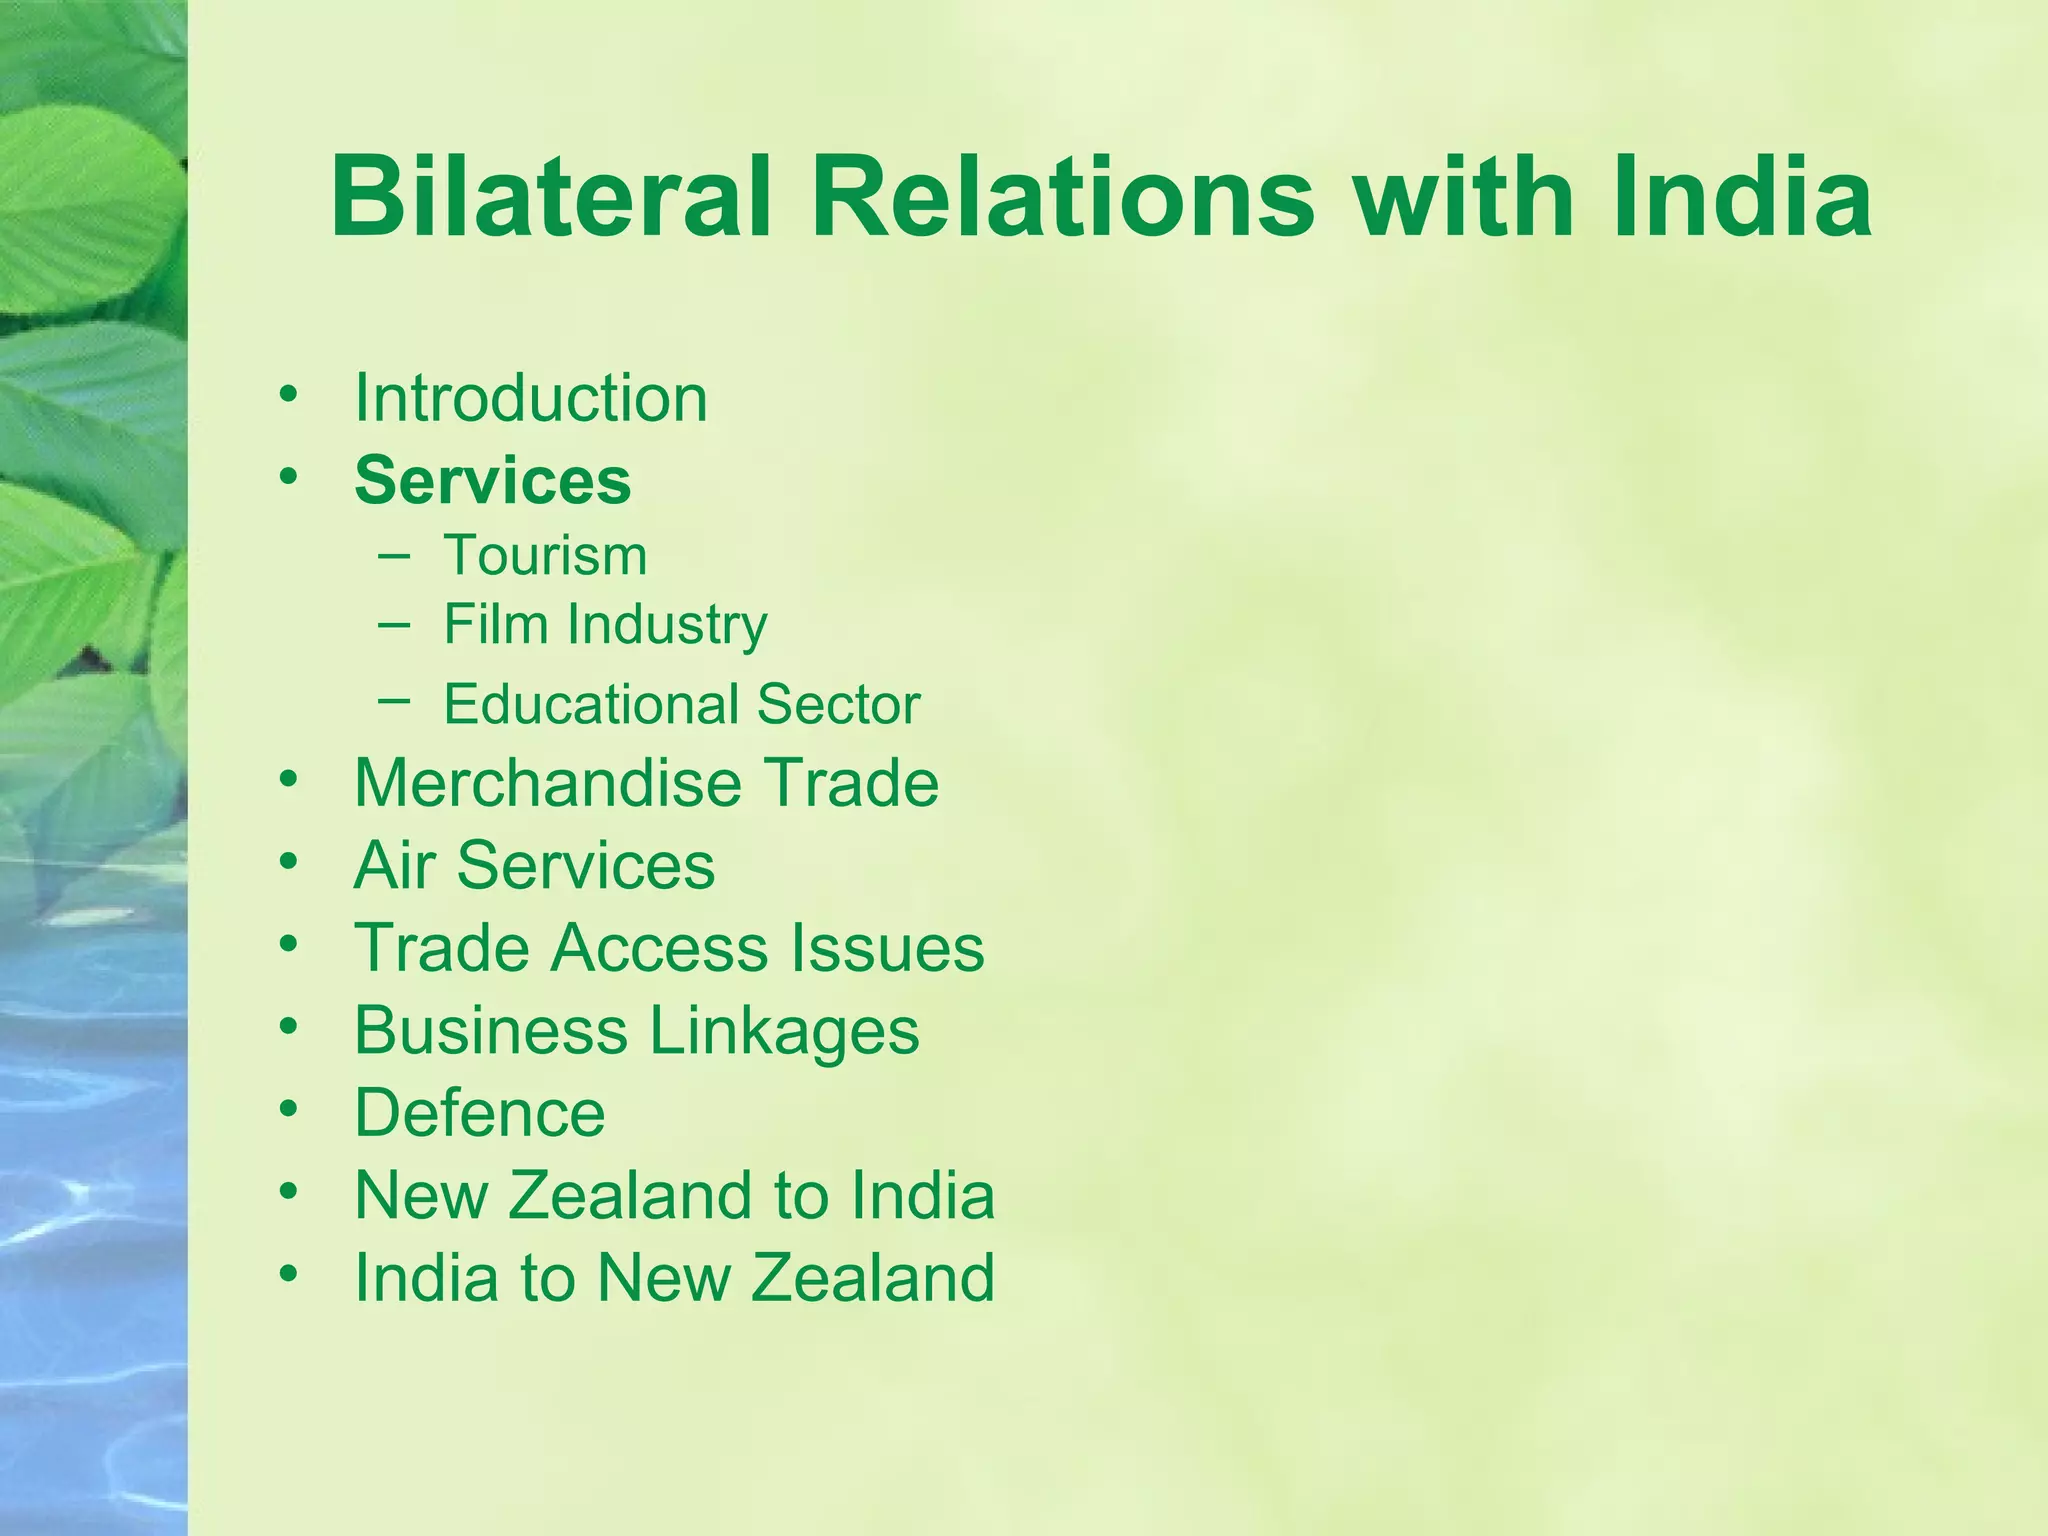
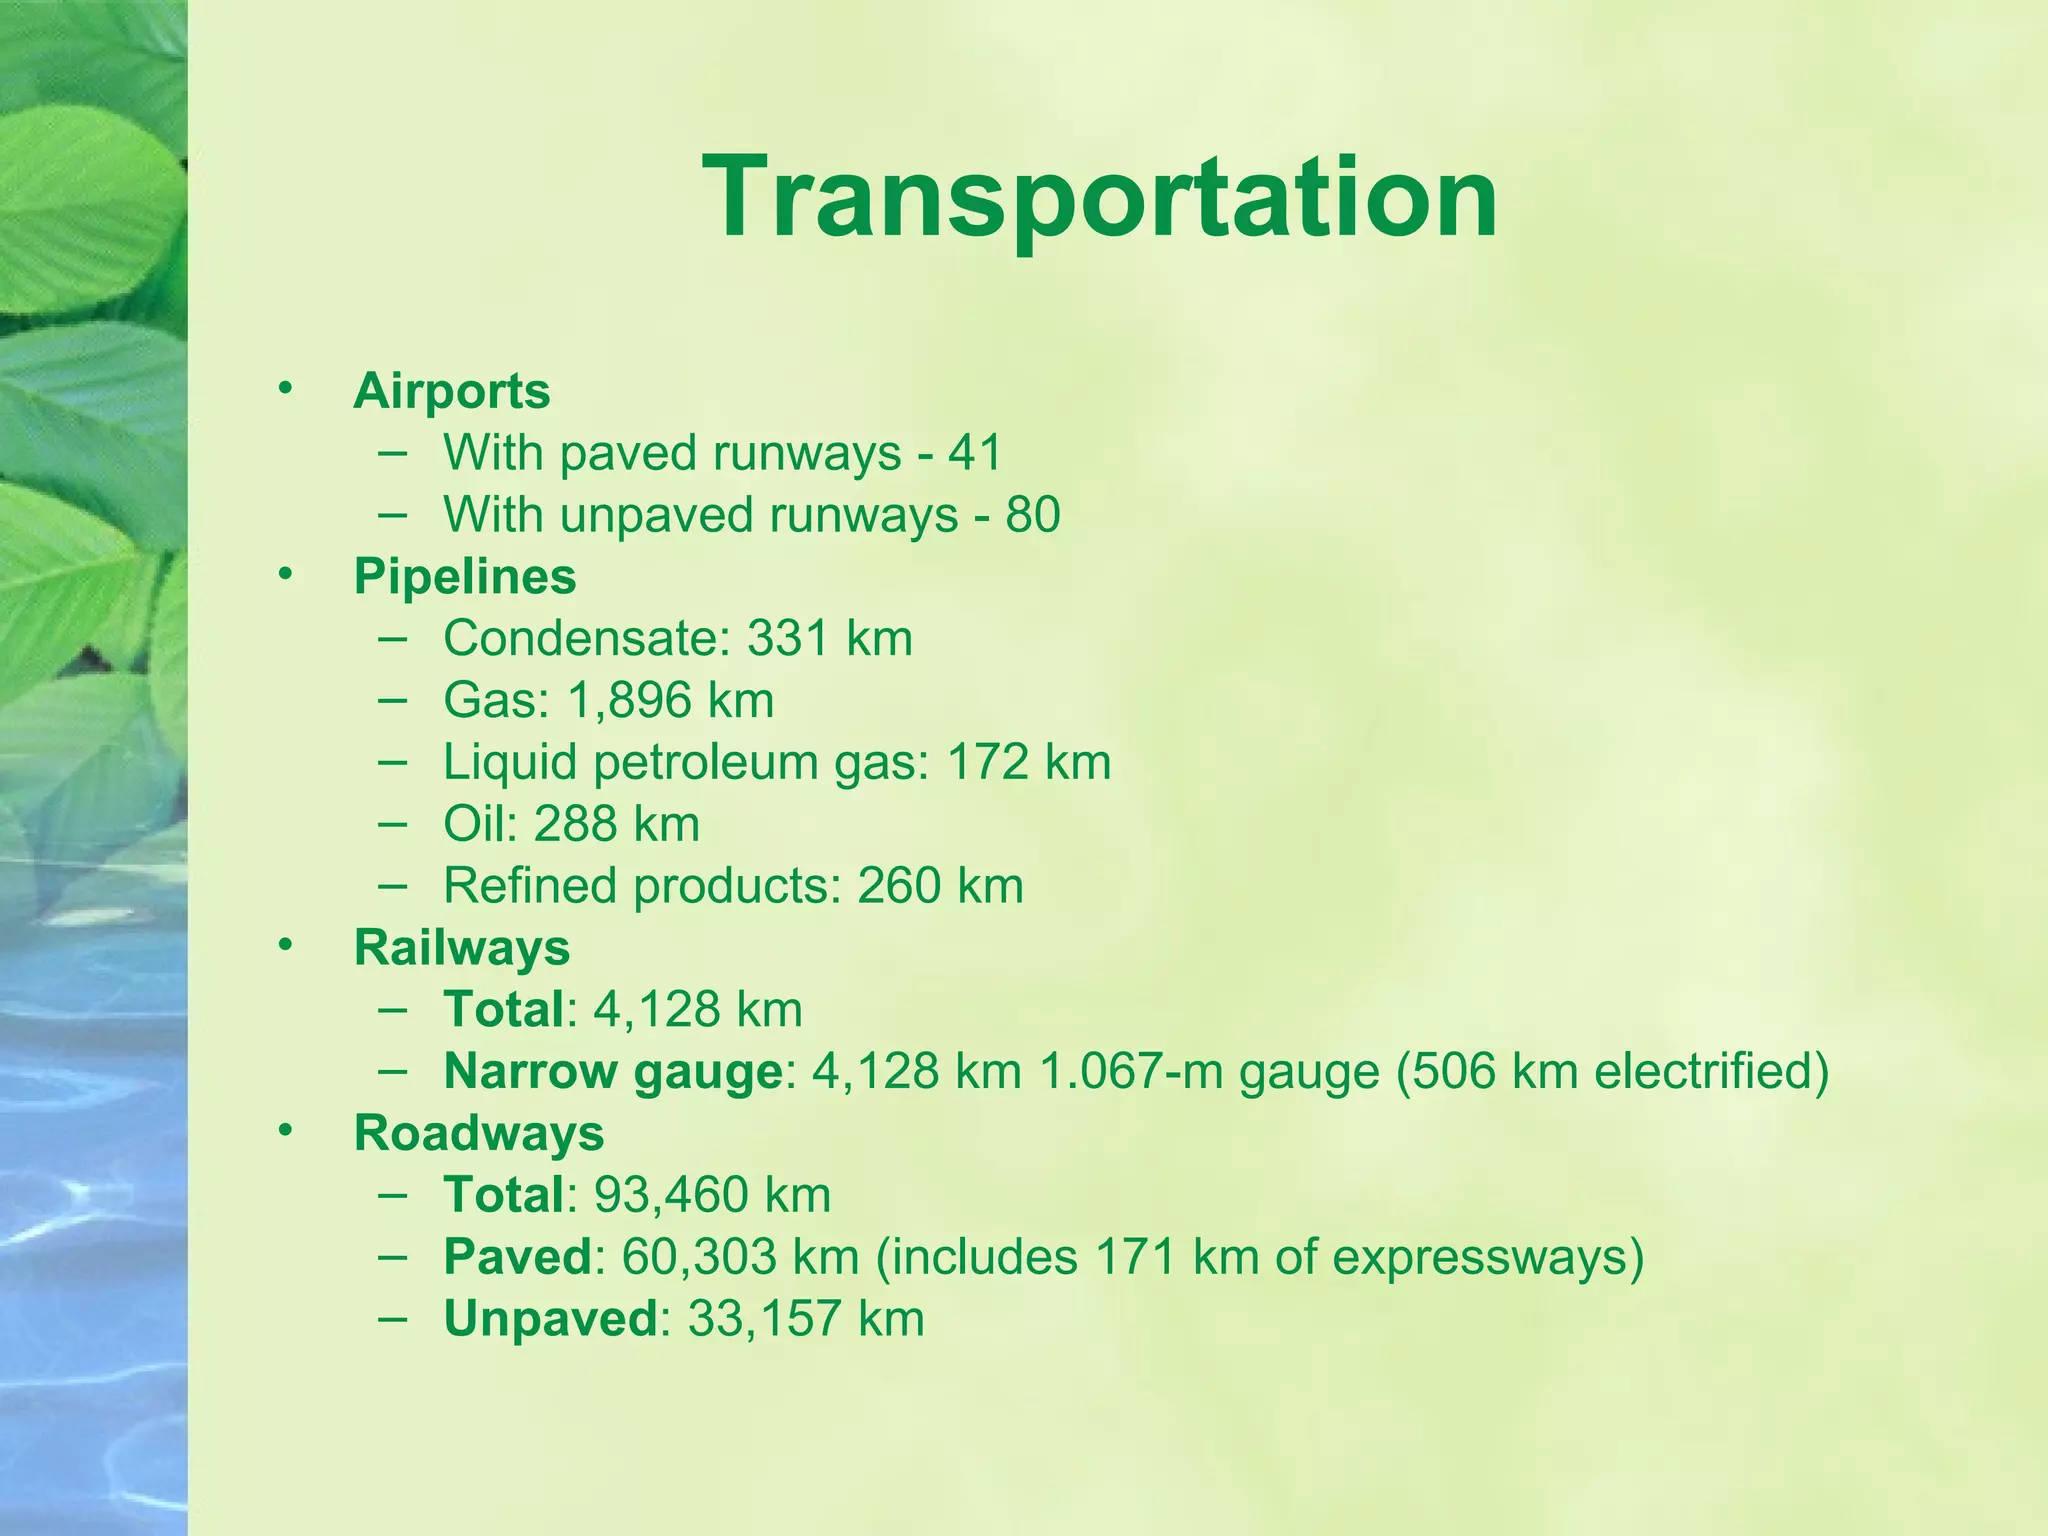
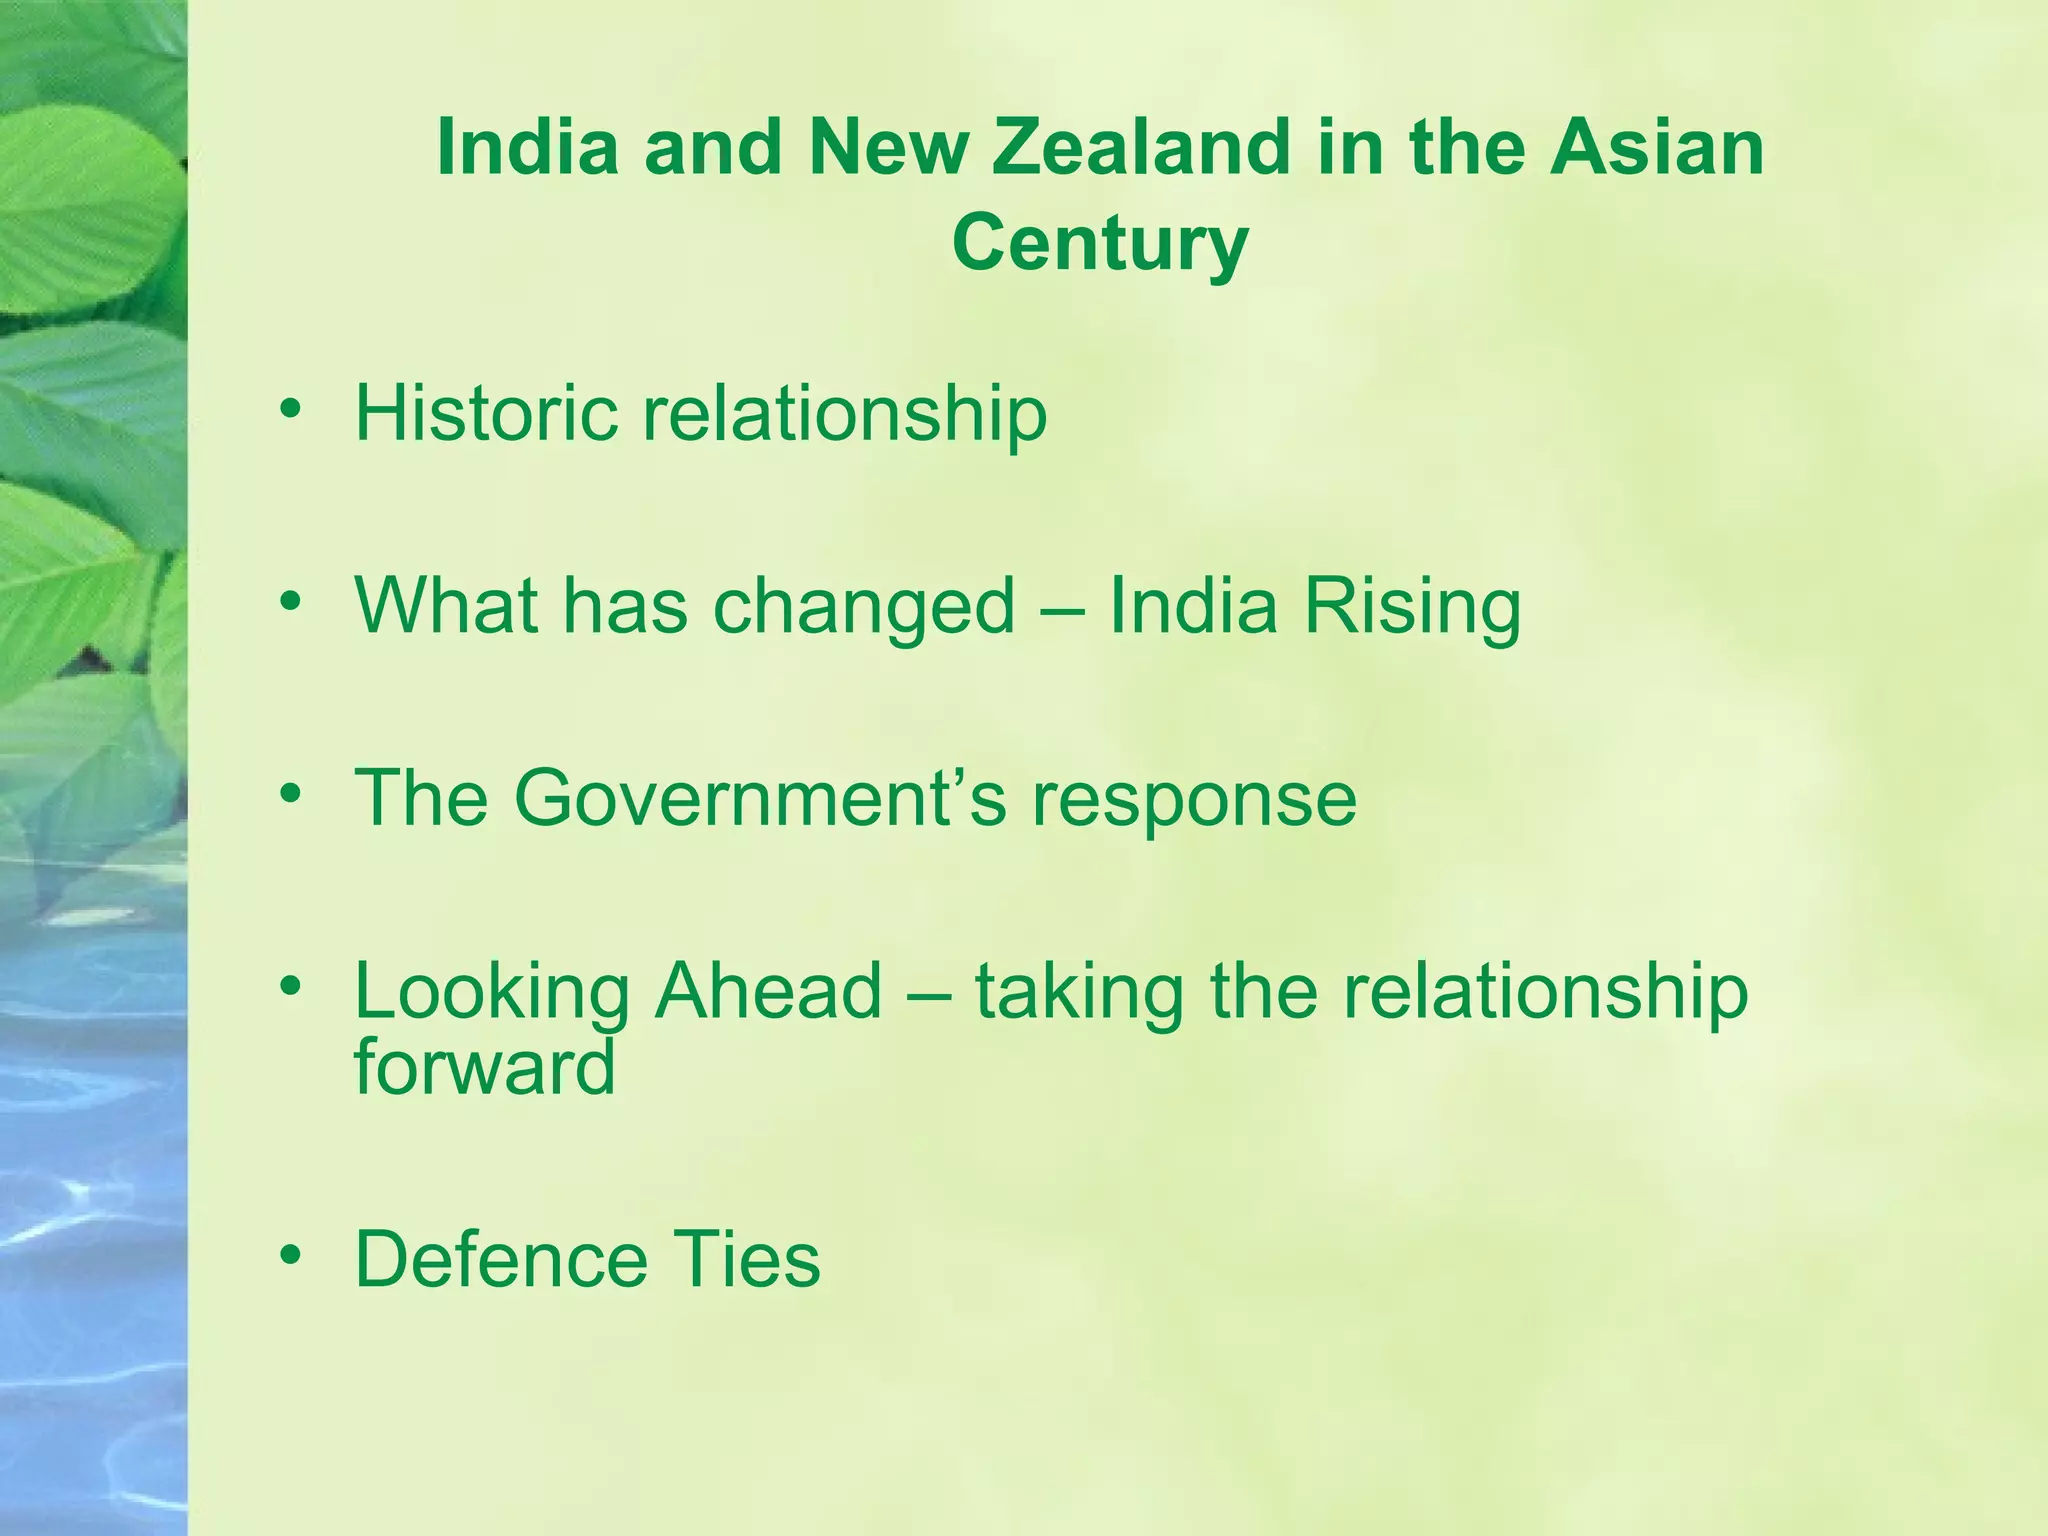
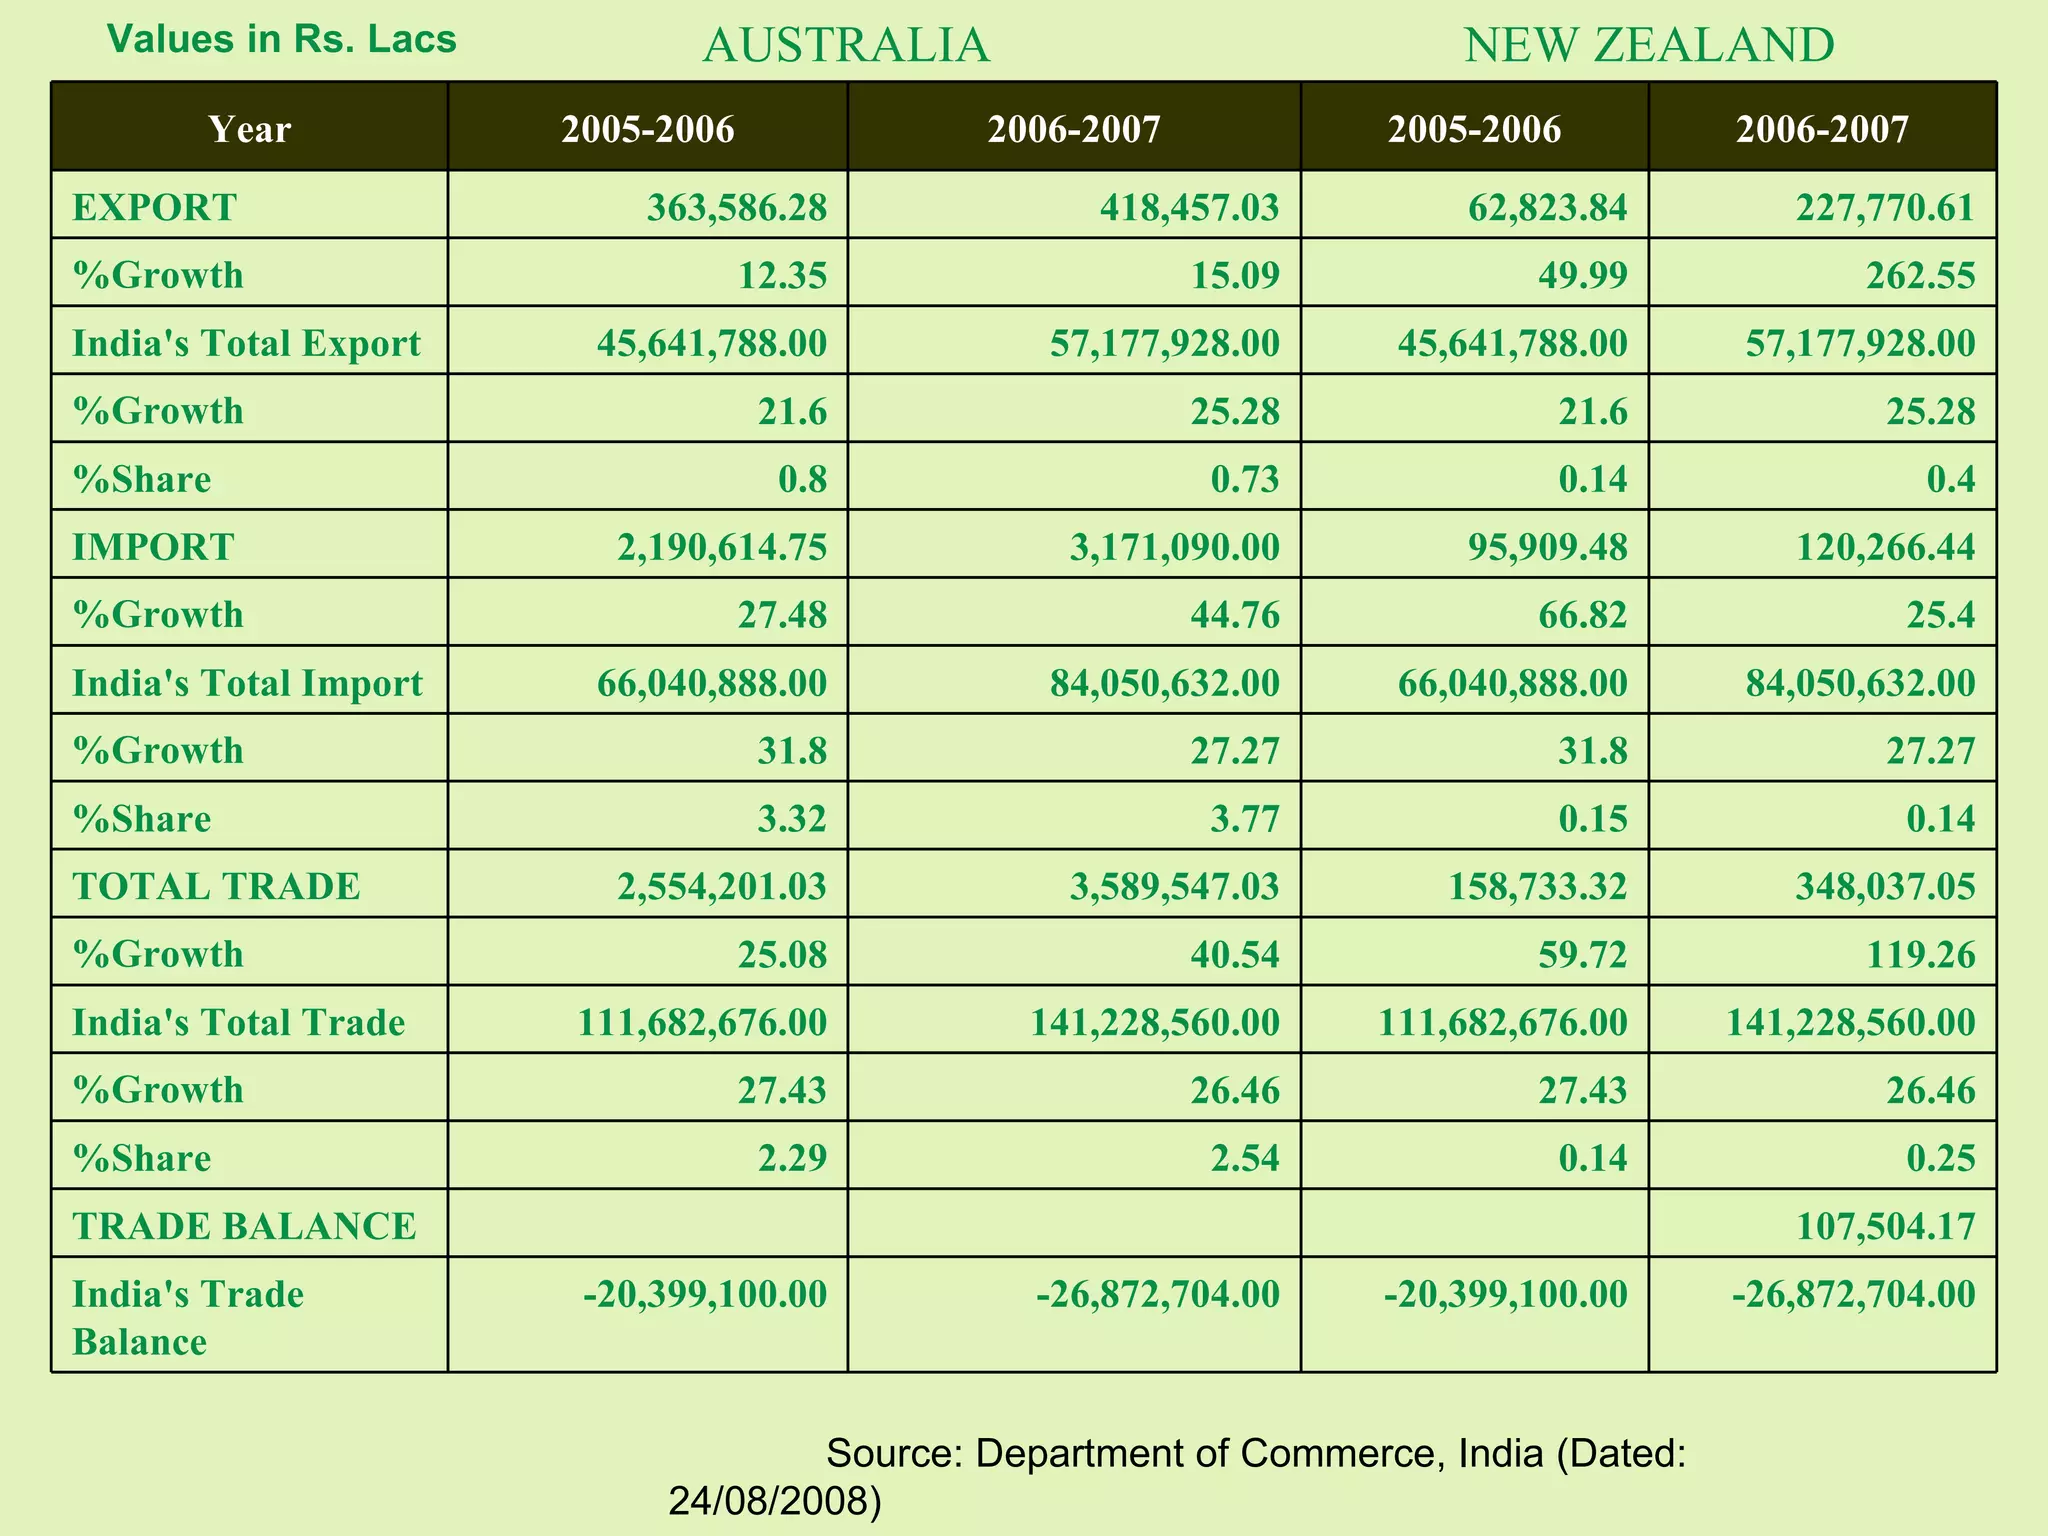
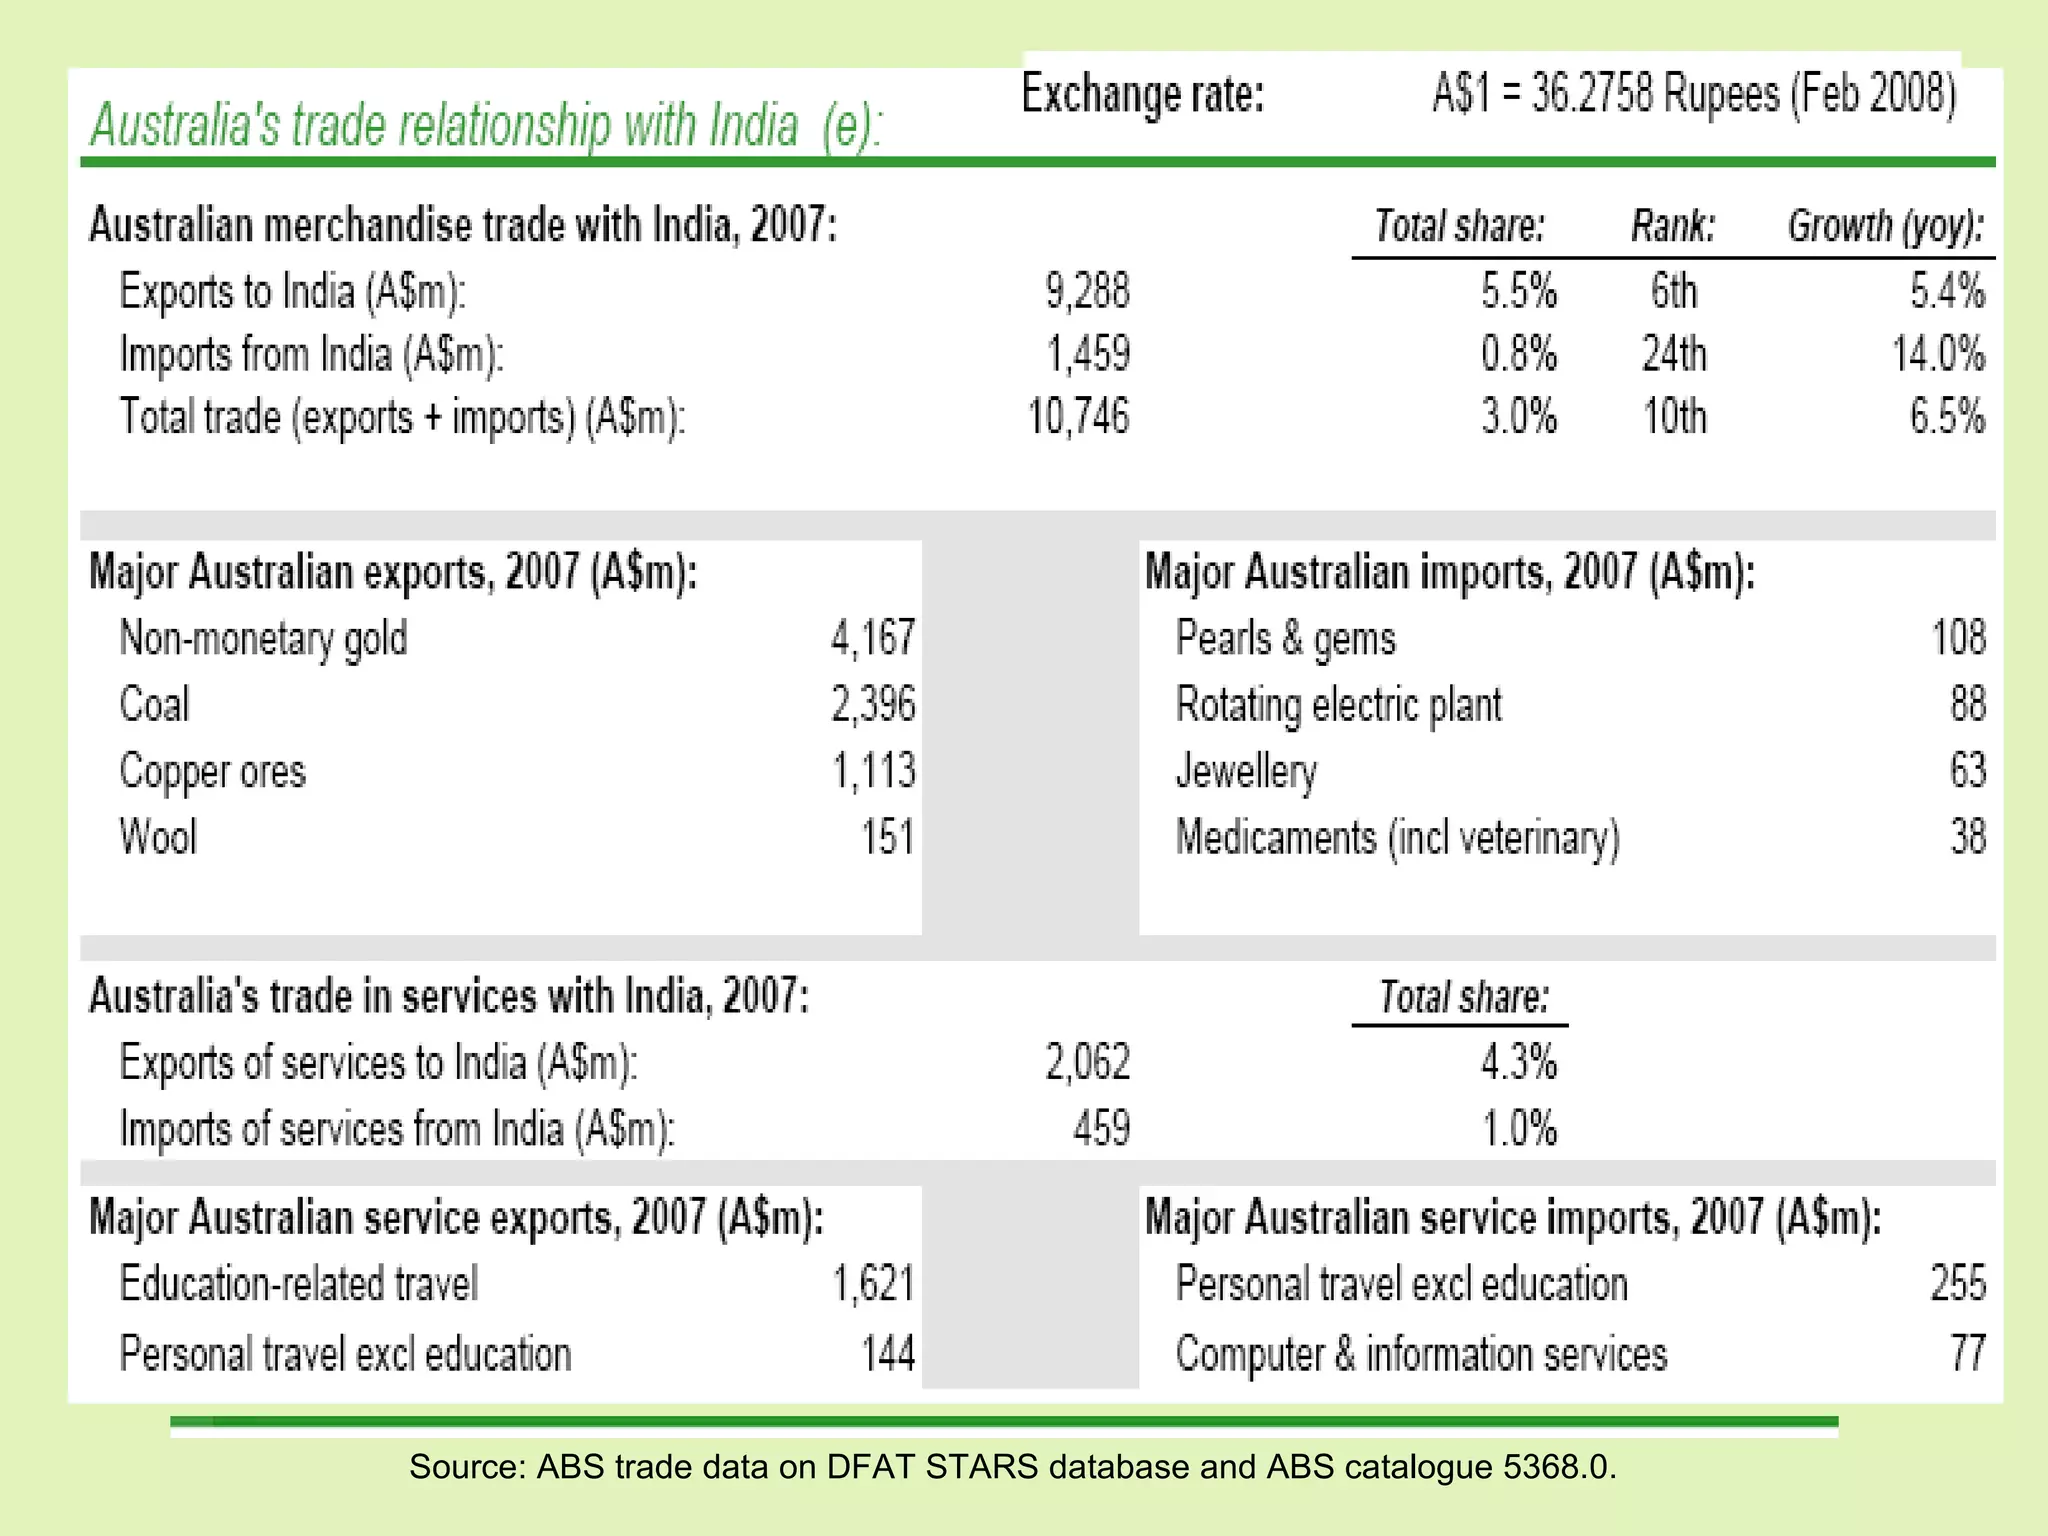
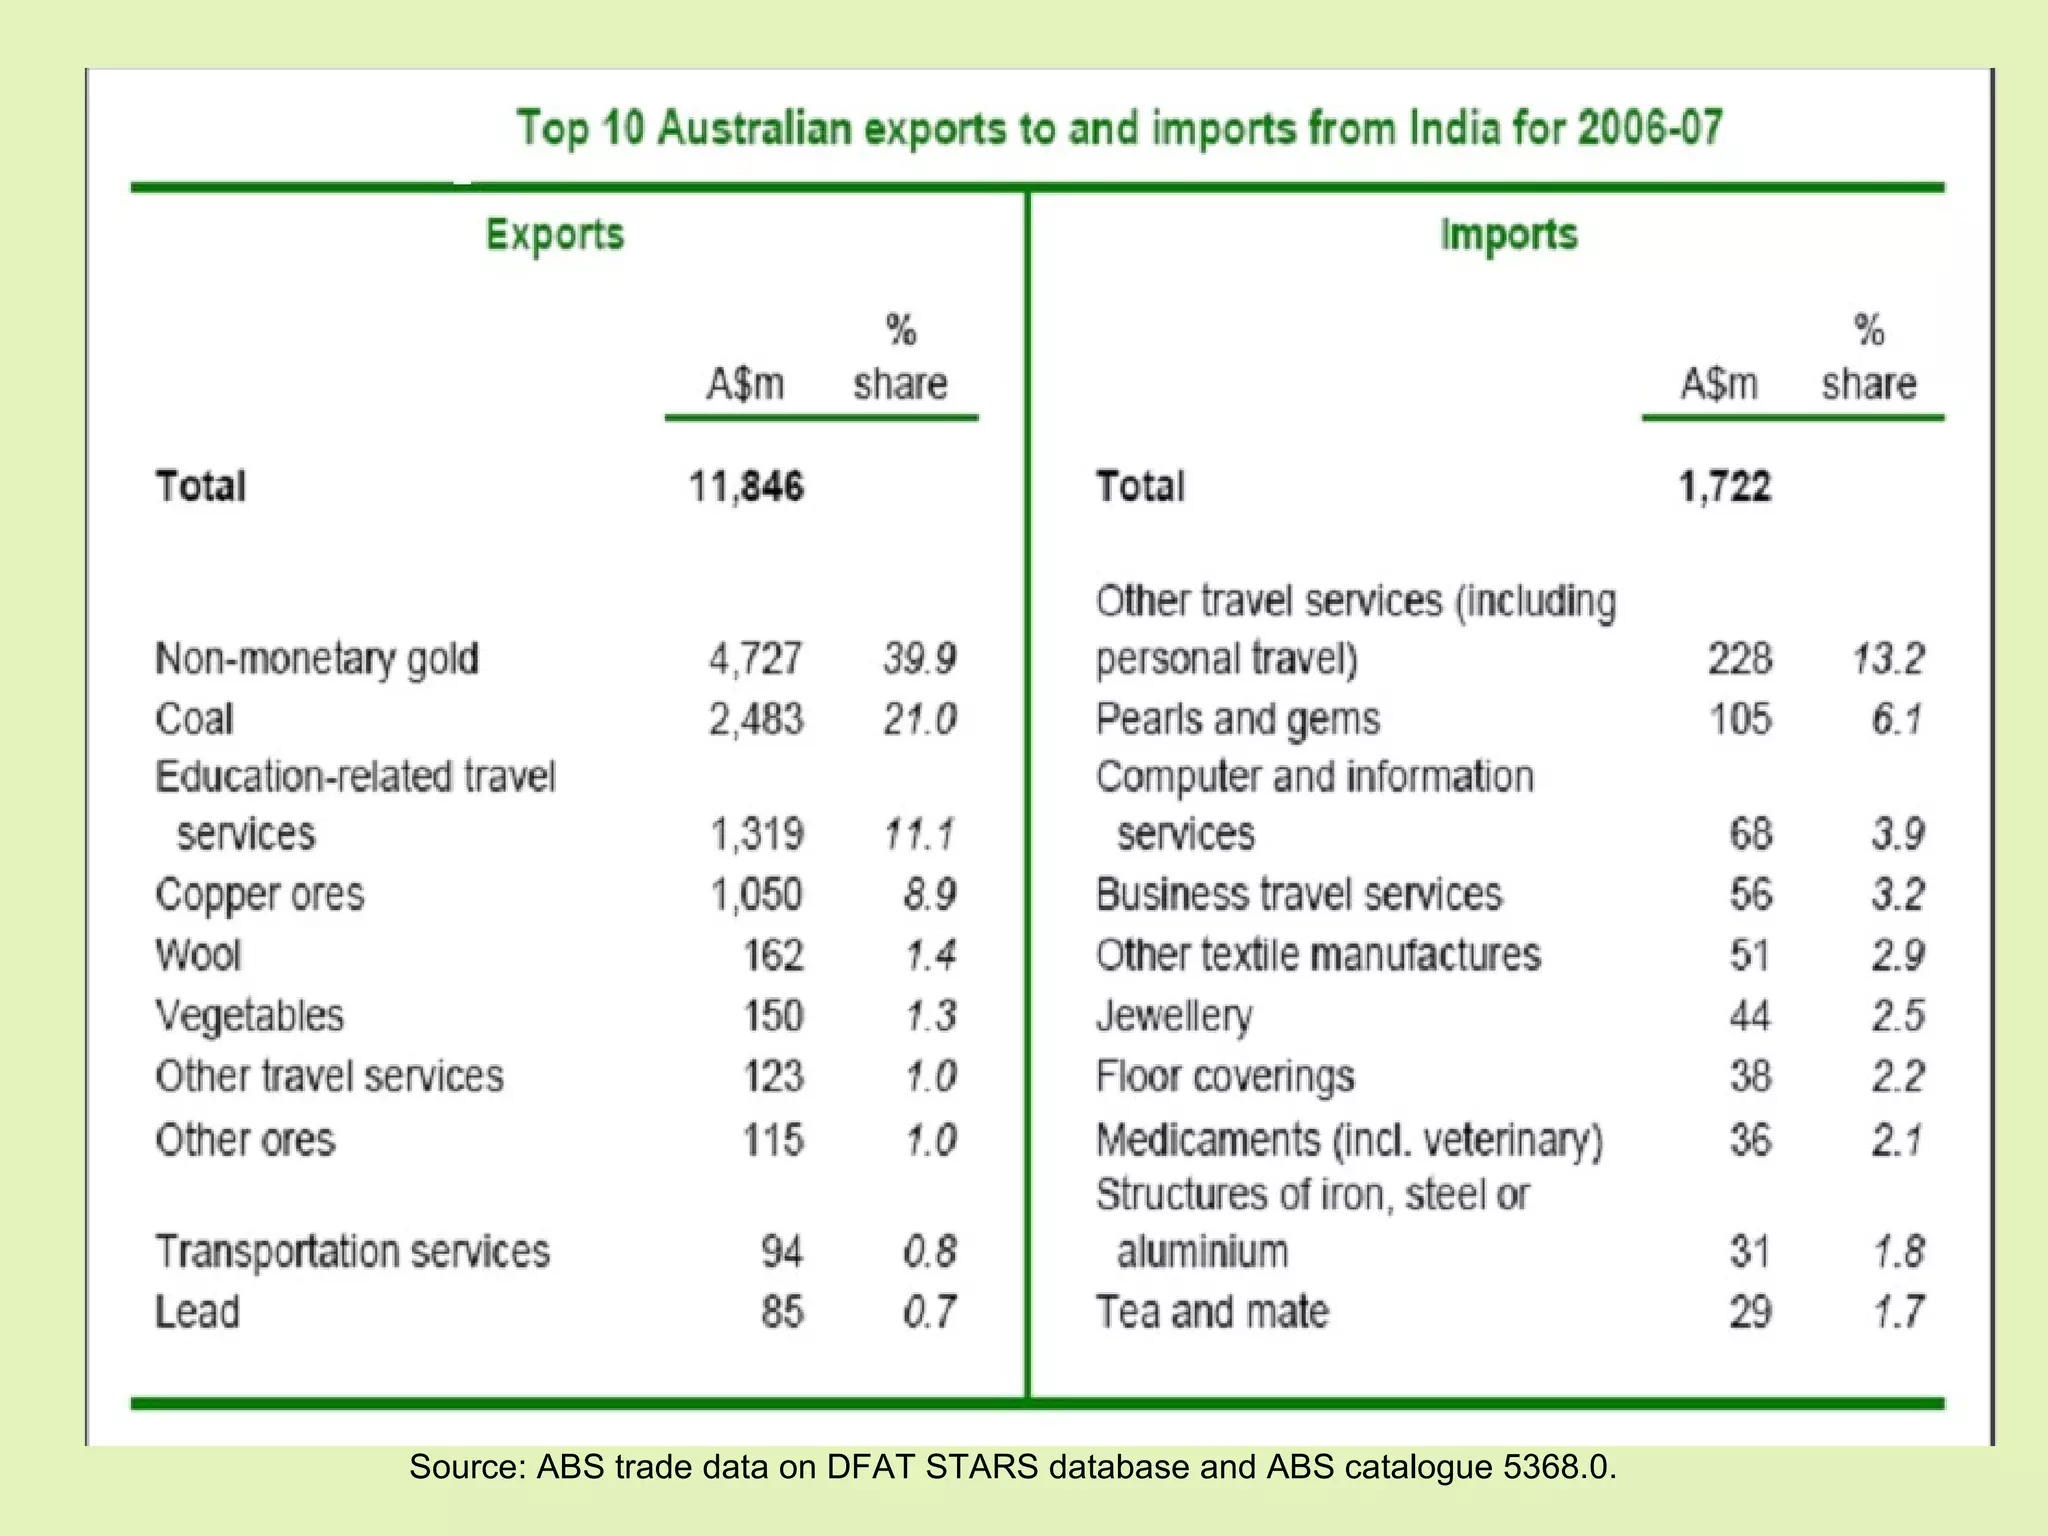
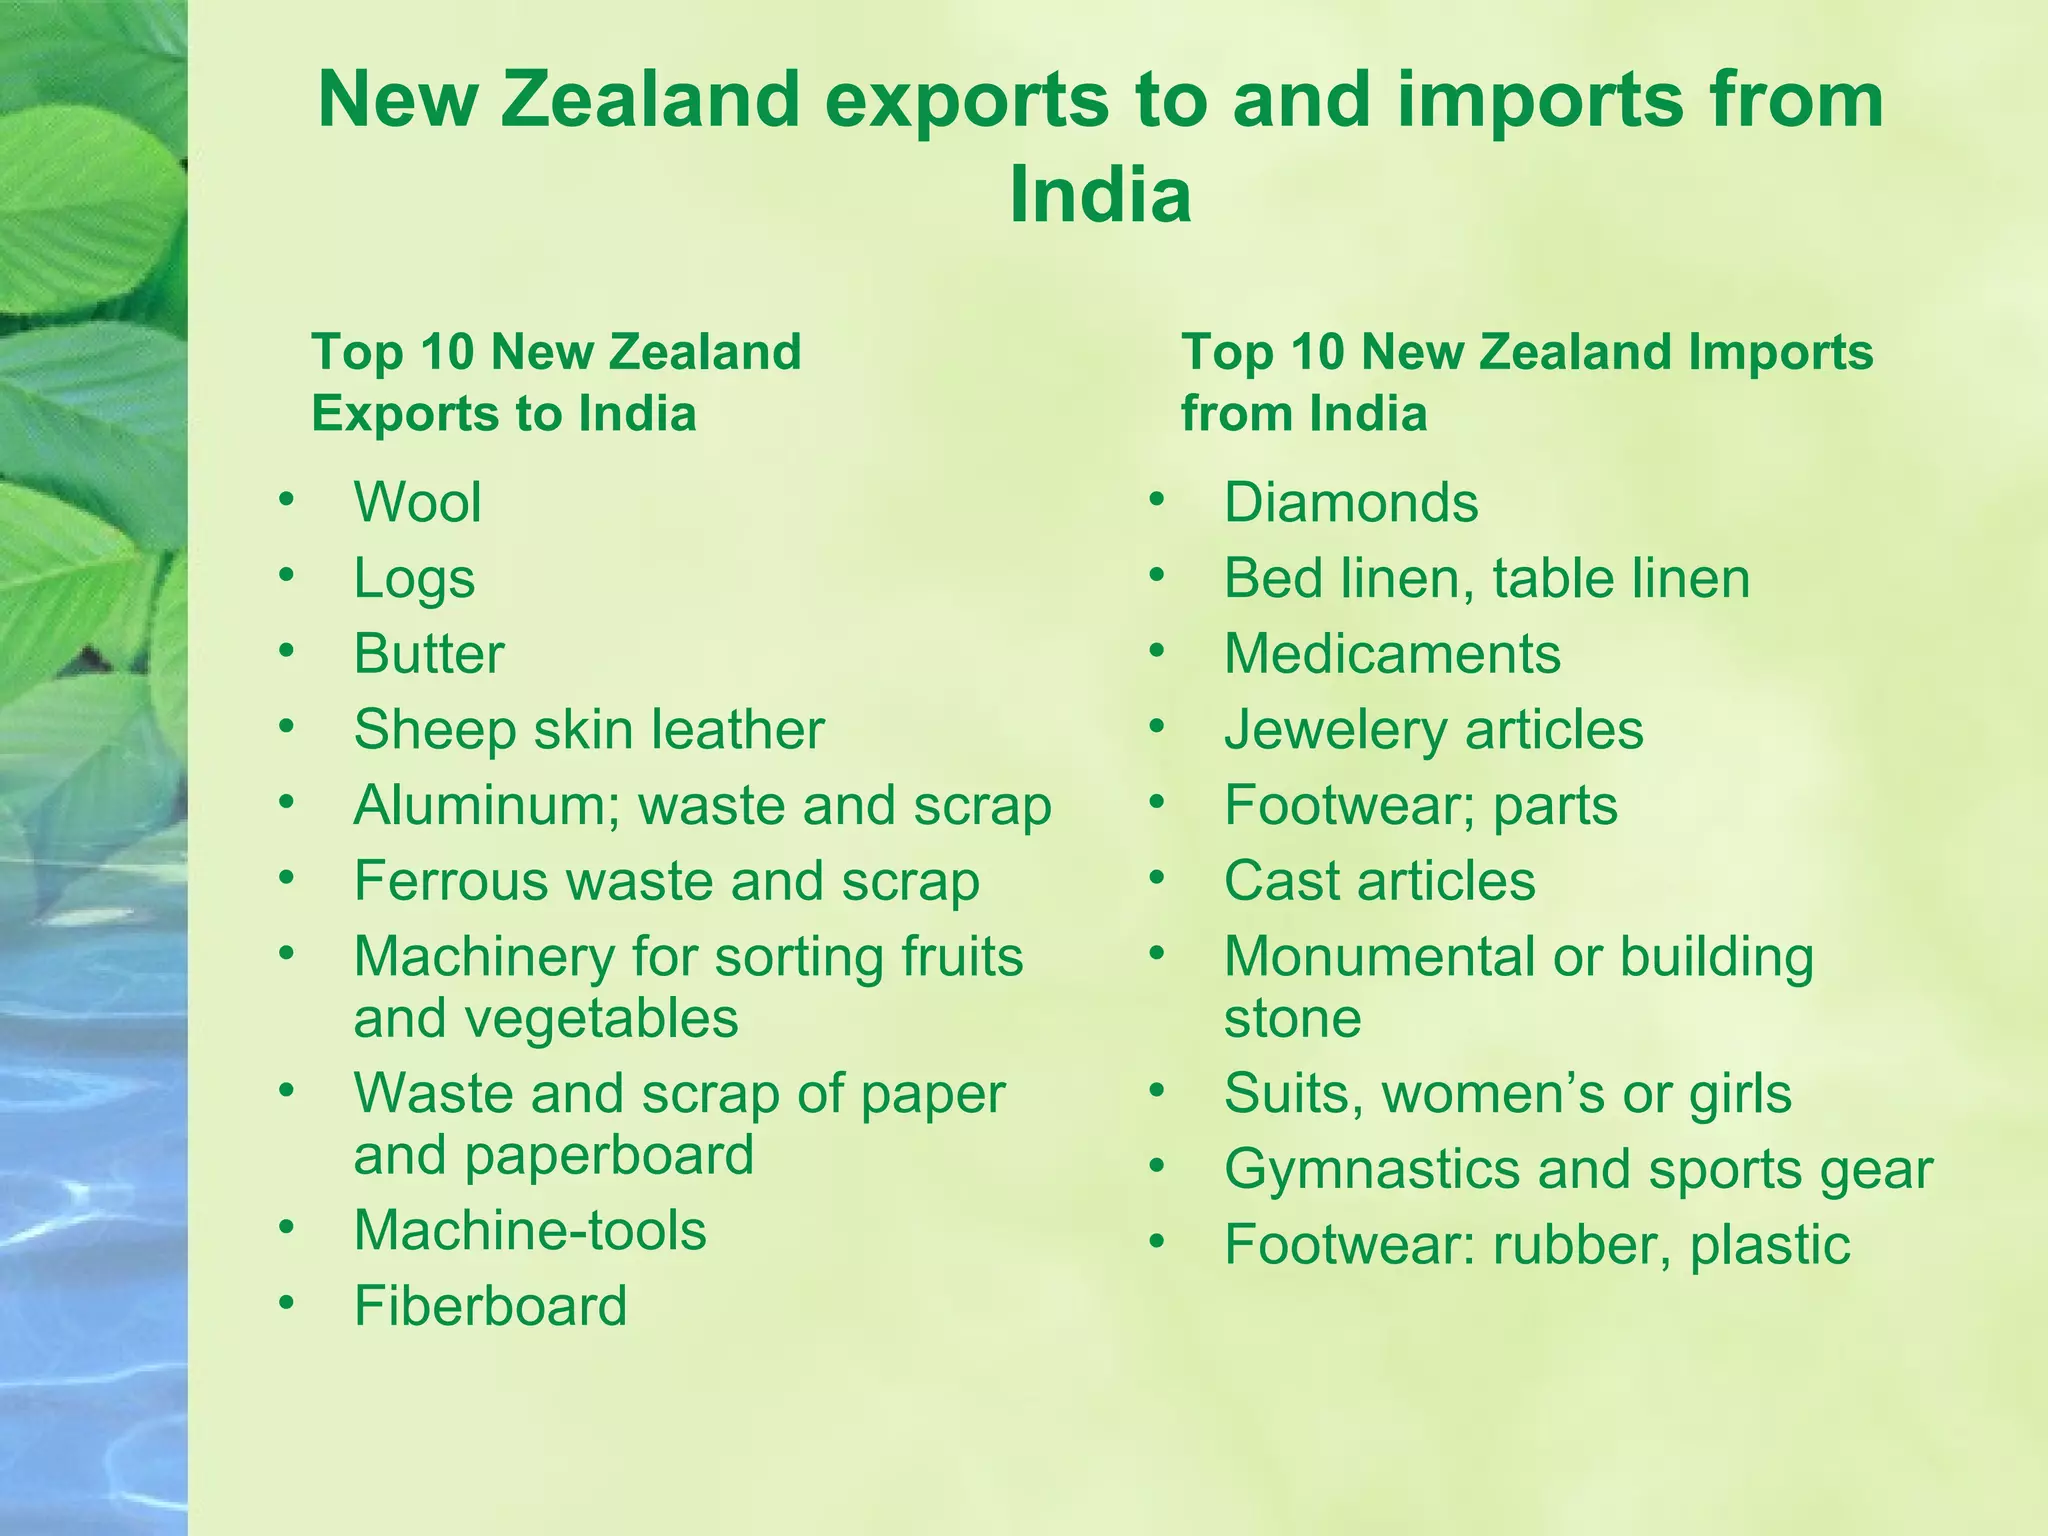
Australasia
Team Members – Group 5 Section A  Aksh Gill – 0811004 Amit Kishore Gupta – 0811007  C. Shivani – 0811019  Hardik Shah – 0811027  Jyoti K – 0811028  Kumari Poonam – 0811031  Nikhil Gupta – 0811037
Oceania Oceania is the region of numerous lands, mostly islands in the Pacific Ocean. Sub regions:- Melanesia Australasia Micronesia Polynesia Coined  by French explorer Dumont d’ Urville in 1831.
Australasia Australasia is a region of Oceania: New Zealand, Australia, and neighboring islands in the Pacific Ocean. Coined by Charles de Brosses in 1756. Geopolitically, Australasia is sometimes used as a term for New Zealand and Australia together; Sometimes Papua New Guinea is encompassed by the term.
Australia
Background Aboriginal settlers arrived from south east Asia about 40,000 years back. Capt. James Cook  took possession in the name of the Great Britain. In 1901, became the Commonwealth of Australia. Recently transformed into an internationally competitive, advanced market economy. Concerns – Depletion of the ozone layer, more frequent droughts, management and conservation of coastal areas, especially the  Great Barrier Reef .
Geography Location Oceania, Australasia, Continent between the Indian Ocean and the South Pacific Ocean. Geographic coordinates 27 00 S, 133 00 E.  Area Total : 7,686,850 sq km Land : 7,617,930 sq km Water : 68,920 sq km Land Boundaries 0 km Coastline 25,760 km
Climate generally arid to semiarid; temperate in south and east; tropical in north.  Terrain mostly low plateau with deserts; fertile plain in southeast.  Elevation Extremes Lowest point : Lake Eyre -15 m  H ighest point : Mount Kosciuszko 2,229 m  Natural Resources Bauxite, Coal, Iron ore, Copper, Tin, Gold, Silver, Uranium, Nickel, Tungsten, Mineral sands, Lead, Zinc, Diamonds, Natural gas, Petroleum.  Land Use Arable land : 6.15% (includes about 27 million hectares of cultivated grassland) Permanent crops : 0.04% Other : 93.81% Irrigated Land 25,450 sq km.
Total Renewable resources 398 cu km.  Fresh Water resources total : 24.06 cu km/yr (15%/10%/75%) per capita : 1,193 cu m/yr Natural Hazards Cyclones along the coast  Severe droughts  Forest fires.  Environment – Current Issues Soil erosion  Industrial development Soil salinity  Desertification Threat to Great Barrier Reef  Limited natural fresh water resources
People Population 20,600,856 (July 2008 est.)  Age Structure 0-14 years : 19.1% (male 2,014,230/female 1,920,604) 15-64 years : 67.5% (male 7,005,588/female 6,895,817) 65 years and over : 13.4% (male 1,226,432/female 1,538,185) (2008 est.)  Median Age Total : 37.4 years Male : 36.6 years Female : 38.3 years (2008 est.) Population Growth Rate 0.801% (2008 est.)
Birth Rate 11.9 births/1,000 population (2008 est.)  Death Rate 7.62 deaths/1,000 population (2008 est.)  Net Migration Rate 3.72 migrant(s)/1,000 population (2008 est.)  Sex Ratio At birth : 1.05 male(s)/female Under 15 years : 1.05 male(s)/female 15-64 years : 1.02 male(s)/female 65 years and over : 0.8 male(s)/female Total population : 0.99 male(s)/female (2008 est.) Infant Mortality Rate Total : 4.51 deaths/1,000 live births Male : 4.89 deaths/1,000 live births Female : 4.11 deaths/1,000 live births (2008 est.) Life Expectancy at birth Total population : 80.73 years Male : 77.86 years Female : 83.75 years (2008 est.)
Ethnic Groups White 92% Asian 7%  Aboriginal and other 1%  Religions Catholic 26.4%  Anglican 20.5%  Other Christian 20.5%  Buddhist 1.9%  Muslim 1.5% Other 1.2%  Unspecified 12.7%  None 15.3%  Languages English 79.1%  Chinese 2.1%  Italian 1.9%  Other 11.1%  Unspecified 5.8%  Literacy Total population: 99% Male: 99% Female: 99%
Diaspora Indian Australians are Australian citizens residents of Indian origin. Fastest growing ethnic group in Australia. Approx. 24% of population is of immigrants. Between 1981-2000, Asian Born population increased from 2,76,000 to over a million.  In 2005-2006,India was the fourth major source of permanent migrants to Australia.
Context Dates back to 19 th  century. Sikhs and Muslims initially entered as operators of camel trains. Three Waves of Migration First Wave  – Large Flow from Jalandhar. Second Wave  – Population rose from 7,500 to 29,212. Third Wave  – Declaration of Whitlam Labour Government. Africanisation Constituent States with largest Indian born residents are New South Wales, Victoria, Western Australia. Significant population of Punjabis among Immigrants.  Transnational Networks Involvement in Socio Cultural Activities and Political Channels. Transnational TV channels like reminiscent and regional channels. Cultural Networks Religious Networks Communication Networks
Facts Making tangible contribution for enhancing bilateral links. External affair minister Mr.Pranab Mukherjee called for youth exchange in various fields to take bilateral partnership forward. India is the third largest source of international immigrants, second largest source of skilled migrants and international students. Young Indians strengthening the Australian economy 15865 professionals.
Government Government Type federal parliamentary democracy.  Administrative Divisions 6 states and 2 territories *; Australian Capital Territory*, New South Wales, Northern Territory*, Queensland, South Australia, Tasmania, Victoria, Western Australia  Dependent Areas Ashmore and Cartier Islands, Christmas Island, Cocos (Keeling) Islands, Coral Sea Islands, Heard Island and McDonald Islands, Norfolk Island, Macquarie Island  Independence 1 January 1901 (federation of UK colonies)  Constitution 9 July 1900, effective 1 January 1901. Executive Branch Chief of state : Queen of Australia ELIZABETH II (since 6 February 1952); represented by Governor General Maj. Gen. (Ret.) Michael JEFFERY (since 11 August 2003) Head of government : Prime Minister Kevin RUDD (since 3 December 2007); Deputy Prime Minister Julia GILLARD (since 3 December 2007)
Economy Currency –  Australian Dollar . GDP  – Around A$1 trillion (2007-2008). GDP Growth rate  – 3.9%. GDP per capita – $32,900. GDP per sector Agricultural 3.8% Industry 26.2% Services 70% Labour Force – 10.66 million Inflation  – 4.5% Unemployment – 4.3% Main Industries.
Exports  – A$215.8 billion. Exports goods  – Coal, Gold, Meat Wool, Alumina, Iron Ore, Wheat, Machinery and Transport equipment. Main export partners  –  Japan  20.3%,  China  11.5%,  South Korea  7.9%,  US  6.7%,  New Zealand  6.5%,  India  5%. Imports  – A$227.8 billion. Import goods  – Machinery and transport equipment, computers and office machines, telecommunications equipments and parts, crude oil and petroleum products. Main import partners  –  US   13.9%,  China  13.7%,  Japan  11%,  Singapore  5.6%,  Germany  5.6%.
Bilateral Relations with India Started in 1801. Constant increase in trade turnover between two countries every corresponding year. Indian Exports to Australia Gems, pearls, and jewelry  Chemicals and its by products  Leather, leather goods, footwear, and travel goods  Agricultural products  Engineering goods and manufactures  Textile, clothing, and make up  Australian Exports to India Coal  Copper and copper ores  Wool  Non- monetary gold  Fresh vegetables  Cotton  Silver, zinc, platinum, and aluminum Indian IT Exports to Australia India Australia tourism Australia India Business Council Higher education in Australia for Indian students
Indian Companies invested in Australia Sterlite Industries Oswal group  Oberoi Hotels International  Asian paints  Aditya Birla Group  Indian IT companies which have set up there offices in Australia are:  Infosys  NIIT  TCS  Kale Consultants  Fujitsu  Pentafour  Satyam  Aptech  Polaris
The key areas of interest to Australian investors Mining Sector Role in developing the wealth of Indian states Areas with highest potential for collaboration Bio Technological Sector Strong strategic science with India AISRF (Australia-India Strategic Research Fund) designed for the development A$ 20m over 5 years to AISRF to support joint research project Farm Sector Demanding flexible policies Australian stake holder have offers regarding to farming method, cropping pattern and developing varieties of crop Educational Sector The Australian VET system provides a broad range of learning Tourism Sector India is one of the fastest growing market 2006-07 tourism growth rate increased by 11%
Information and Communication Sector Major Indian ICT companies like TCS, Infosys etc. are active in Australia NIIT has strong partnership with Australian Consulting Companies Food Processing Sector Australian fruit is finding place in India’s store shelf – Citrus fruit, Plums, etc. Australia has potential to sell its cheese, wine etc. Engineering Process Outsourcing Sector India is fast becoming a major EPO destination  Auto component Sector Large investments from major original equipment manufacturers (OEM) Energy Sector Australia reserves 40% of worlds total Nuclear energy India can get Uranium from Australia Clean Development Technology Sector
Transportation Airports With paved runways - 317 With unpaved runways - 144 Pipelines Condensate/gas 469 km; Gas 26,719 km;  Liquid petroleum gas 240 km;  Oil 3,720 km;  Oil/gas/water 110 km  Railways Total : 38,550 km Broad gauge : 3,727 km 1.600-m gauge Standard gauge : 20,519 km 1.435-m gauge (1,877 km electrified) Narrow gauge : 14,074 km 1.067-m gauge (2,453 km electrified) Dual gauge : 230 km dual gauge
Roadways Total : 812,972 km Paved : 341,448 km Unpaved : 471,524 km  Waterways 2,000 km (mainly used for recreation on Murray and Murray-Darling river systems)  Merchant Marine Total : 52 ships (1000 GRT or over) 1,296,383 GRT/1,490,539 DWT  By type : bulk carrier 13, cargo 6, chemical tanker 1, container 1, liquefied gas 4, passenger 7, passenger/cargo 7, petroleum tanker 8, roll on/roll off 5  Foreign-owned : 24 (Canada 9, France 1, Germany 2, Japan 1, Netherlands 2, Norway 1, Singapore 1, UK 5, US 2)  Registered in other countries : 34 (Antigua and Barbuda 1, Bahamas 1, Bermuda 2, Dominica 2, Fiji 1, Marshall Islands 2, NZ 1, Panama 4, Singapore 11, Tonga 1, Tuvalu 1, UK 3, US 2, Vanuatu 2)  Ports and Terminals Brisbane, Dampier, Fremantle, Gladstone, Hay Point, Melbourne, Newcastle, Port Hedland, Port Kembla, Port Walcott, Sydney.
New Zealand
New Zealand - Background  The Polynesian Maori reached New Zealand in about A.D. 800.  In 1840, The Treaty of Waitangi. In that same year, the British began the first organized colonial settlement.  The British colony of New Zealand became an independent dominion in 1907 and supported the UK militarily in both World Wars.  New Zealand's full participation in a number of defense alliances lapsed by the 1980s.  In recent years, the government has sought to address longstanding Maori grievances.
Geography Location Oceania, Australasia, Islands in the South Pacific Ocean, Southeast of Australia. Geographic Coordinates 41 00 S, 174 00 E Area Total : 268,680 sq km  Land : 268,021 sq km  Water : NA Coastline 15,134 km Climate Temperate with sharp regional contrasts.
Terrain Predominately mountainous with some large coastal plains Elevation Extremes Lowest point: Pacific Ocean 0 m  Highest point: Aoraki-Mount Cook 3,754 m Natural Resources Natural gas, Iron ore, Sand, Coal, Timber, Hydropower, Gold, Limestone Land Use Arable land: 5.54%  Permanent crops: 6.92%  Other: 87.54% Irrigated Land 2,850 sq km Natural Hazards Earthquakes are common, though usually not severe; Volcanic activity. Environment Issues Deforestation; Soil erosion; Native flora and fauna hard-hit by invasive species.
People Population 4,173,460 (July 2008 est.) Age Structure 0-14 years : 20.9% (male 446,883/female 424,240)  15-64 years : 66.5% (male 1,390,669/female 1,385,686)  65 years and over : 12.6% (male 238,560/female 287,422) Median Age Total : 36.3 years  Male : 35.6 years  Female : 37.1 years Population Growth Rate 0.971% (2008 est.)
Birth Rate 14.09 births/1,000 population (2008 est.)  Death Rate 7 deaths/1,000 population (2008 est.)  Net Migration Rate 3.62 migrant(s)/1,000 population (2008 est.)  Sex Ratio At birth : 1.05 male(s)/female Under 15 years : 1.05 male(s)/female 15-64 years : 1 male(s)/female 65 years and over : 0.83 male(s)/female Total population : 0.99 male(s)/female (2008 est.) Infant Mortality Rate Total : 4.99 deaths/1,000 live births Male : 5.62 deaths/1,000 live births Female : 4.33 deaths/1,000 live births (2008 est.) Life Expectancy at birth Total population : 80.24 years Male : 78.33 years Female : 82.25 years (2008 est.)
Ethnic Groups European 69.8% Maori 7.9% Asian 5.7% Pacific islander 4.4% other 0.5% mixed 7.8% unspecified 3.8%  Religions Anglican 14.9% Roman Catholic 12.4% Presbyterian 10.9%  Methodist 2.9% Pentecostal 1.7% Baptist 1.3% other Christian 9.4% other 3.3% unspecified 17.2% none 26%  Languages English (official) Maori (official) Sign Language (official) Literacy Total population : 99% Male : 99% Female : 99%
Diaspora Arrival before 1840 Racism and official opposition Population growth Women’s influence Immigration policy Indo Kiwi Regions with significant population Languages Religion – Worshipping together Home and Family Unity and Diversity Bollywood in New Zealand Arts and Sports
Government Government Type Parliamentary Democracy Administrative Divisions 16 regions and 1 territory*; Auckland, Bay of Plenty, Canterbury, Chatham Islands*, Gisborne, Hawke's Bay, Manawatu-Wanganui, Marlborough, Nelson, Northland, Otago, Southland, Taranaki, Tasman, Waikato, Wellington, West Coast Dependent Areas Cook Islands, Niue, Tokelau Independence 26 September 1907 (from UK) Constitution consists of a series of legal documents, including certain acts of the UK and New Zealand Parliaments, as well as The Constitution Act 1986, which is the principal formal charter; adopted 1 January 1987, effective 1 January 1987. Executive Branch Chief of state : Queen ELIZABETH II (since 6 February 1952); represented by Governor General Anand SATYANAND (since 23 August 2006)  Head of government : Prime Minister Helen CLARK (since 10 December 1999); Deputy Prime Minister Michael CULLEN (since July 2002)
Economy Currency  – New Zealand Dollar. GDP  – $128.141 billion (2007 est.) GDP Growth rate  – 3.0%. GDP per capita  – $30,234. GDP per sector Agricultural 4.6% Industry 27.4% Services 68% Labour Force  – 2.05 million Inflation  – 3.9% Unemployment  – 3.4% Main Industries .
Exports  – $29.2 billion. Exports goods  – tourism destination, dairy products, meat, wood and wood products, fish, machinery. Main export partners  –  Australia  19.6%,  U.S.  14.3%,  Japan  11.4%,  the People's Republic of China  6.3%,  UK  5.1%. Imports  – $35.8 billion. Import goods  – Machinery and equipment, vehicles and aircraft, Petroleum, Electronics, Textiles, Plastics. Main import partners  –  Australia  28.6%,  Japan  10.7%,  U.S.  10%,  the People's Republic of China  6.6%,  Germany  4.2%,  Singapore  4.1% .
Bilateral Relations with India Introduction Services Tourism Film Industry Educational Sector   Merchandise Trade Air Services Trade Access Issues  Business Linkages  Defence New Zealand to India India to New Zealand
The key areas of interest to New Zealand investors Agricultural Sector Scope for bilateral corporation India is world’s largest milk producer & New Zealand is world-class food & beverage producer Tourism and Film Making India is no.1 film producer In 2006-07 120 Indian crews have chosen New Zealand for their movies Education Sector India is one of the New Zealand’s core education market  Bio Technological Sector India has 850 biotech companies & 100 national laboratories Wood Processing Sector New Zealand is a major supplier of forest product – Sawn timber, moulding, etc.  Information Technology Sector New Zealand ICT companies are making partnership with Indian companies for expanding the global network of Indian ICT business  Aviation sector India’s turnover is US$ 3.5billion & expected growth of 20% over the next five years  Health Care Sector World class hospitals & treatment at a fraction of what it costs in Europe & USA with comparable success rate & higher service level
Transportation Airports With paved runways - 41 With unpaved runways - 80 Pipelines Condensate: 331 km Gas: 1,896 km Liquid petroleum gas: 172 km Oil: 288 km Refined products: 260 km Railways Total : 4,128 km  Narrow gauge : 4,128 km 1.067-m gauge (506 km electrified) Roadways Total : 93,460 km  Paved : 60,303 km (includes 171 km of expressways)  Unpaved : 33,157 km
Merchant Marine Total : 13 ships (1000 GRT or over) 135,325 GRT/126,527 DWT  By type : bulk carrier 3, cargo 2, chemical tanker 1, passenger/cargo 4, petroleum tanker 1, roll on/roll off 2  Foreign-owned : 3 (Australia 1, Germany 1, South Africa 1)  Registered in other countries : 5 (Antigua and Barbuda 2, Cook Islands 1, France 1, UK 1) Ports and Terminals Auckland, Lyttelton, Marsden Point, Tauranga, Wellington, Whangarei.
India’s Foreign Policy and Relations with Australia India - Its Part in Australia’s Foreign Policy Pre 1991 Early Bilateral Trade Effect of NAM on Australia-India Relations Warming of Australia-India Relations Australia’s India Relations Post 1991 Trade and Other Initiatives The Midnight Hour Report Australia India - New Horizons Promotion Academic-Educational Links Australia-India Complementarities Lack of Cultural and Commercial Awareness Ongoing Issues - Economic, Political, Social, Cultural
India and New Zealand in the Asian Century Historic relationship What has changed – India Rising The Government’s response Looking Ahead – taking the relationship forward Defence Ties
India’s Trade with Australia and New Zealand
Source: Department of Commerce, India (Dated: 24/08/2008) -26,872,704.00 -20,399,100.00 -26,872,704.00 -20,399,100.00 India's Trade Balance  107,504.17          TRADE BALANCE  0.25 0.14 2.54 2.29 %Share  26.46 27.43 26.46 27.43 %Growth 141,228,560.00 111,682,676.00 141,228,560.00 111,682,676.00 India's Total Trade  119.26 59.72 40.54 25.08 %Growth 348,037.05 158,733.32 3,589,547.03 2,554,201.03 TOTAL TRADE  0.14 0.15 3.77 3.32 %Share  27.27 31.8 27.27 31.8 %Growth 84,050,632.00 66,040,888.00 84,050,632.00 66,040,888.00 India's Total Import  25.4 66.82 44.76 27.48 %Growth 120,266.44 95,909.48 3,171,090.00 2,190,614.75 IMPORT  0.4 0.14 0.73 0.8 %Share  25.28 21.6 25.28 21.6 %Growth 57,177,928.00 45,641,788.00 57,177,928.00 45,641,788.00 India's Total Export  262.55 49.99 15.09 12.35 %Growth 227,770.61 62,823.84 418,457.03 363,586.28 EXPORT  2006-2007 2005-2006 2006-2007 2005-2006 Year    NEW ZEALAND AUSTRALIA Values in Rs. Lacs
Source: ABS trade data on DFAT STARS database and ABS catalogue 5368.0.
New Zealand exports to and imports from India Wool  Logs  Butter  Sheep skin leather  Aluminum; waste and scrap  Ferrous waste and scrap  Machinery for sorting fruits and vegetables  Waste and scrap of paper and paperboard  Machine-tools  Fiberboard  Diamonds  Bed linen, table linen  Medicaments  Jewelery articles  Footwear; parts  Cast articles  Monumental or building stone  Suits, women’s or girls  Gymnastics and sports gear  Footwear: rubber, plastic  Top 10 New Zealand Exports to India Top 10 New Zealand Imports from India
Bibliography http://www.commerce.nic.in http://www. dfat.gov.au https://www.cia.gov/library/publications/the-world-factbook/geos/as.html https://www.cia.gov/library/publications/the-world-factbook/geos/nz.html http://business.mapsofindia.com/trade-relations/india-australia/ http://encarta.msn.com/encyclopedia_761570609/Australasia.html http://encarta.msn.com/encyclopedia_761568792/Australia.html http://encarta.msn.com/encyclopedia_761568792/New_Zealand.html http://en.wikipedia.org/wiki/Australasia http://en.wikipedia.org/wiki/Oceania http://en.wikipedia.org/wiki/Australia http://en.wikipedia.org/wiki/New_Zealand http://www.mfat.govt.nz/Countries/Asia-South-and-Southeast/India.php
Thank You.. Any Queries?

Australasia

  • 1.
  • 2.
    Team Members –Group 5 Section A Aksh Gill – 0811004 Amit Kishore Gupta – 0811007 C. Shivani – 0811019 Hardik Shah – 0811027 Jyoti K – 0811028 Kumari Poonam – 0811031 Nikhil Gupta – 0811037
  • 3.
    Oceania Oceania isthe region of numerous lands, mostly islands in the Pacific Ocean. Sub regions:- Melanesia Australasia Micronesia Polynesia Coined by French explorer Dumont d’ Urville in 1831.
  • 4.
    Australasia Australasia isa region of Oceania: New Zealand, Australia, and neighboring islands in the Pacific Ocean. Coined by Charles de Brosses in 1756. Geopolitically, Australasia is sometimes used as a term for New Zealand and Australia together; Sometimes Papua New Guinea is encompassed by the term.
  • 5.
  • 6.
    Background Aboriginal settlersarrived from south east Asia about 40,000 years back. Capt. James Cook took possession in the name of the Great Britain. In 1901, became the Commonwealth of Australia. Recently transformed into an internationally competitive, advanced market economy. Concerns – Depletion of the ozone layer, more frequent droughts, management and conservation of coastal areas, especially the Great Barrier Reef .
  • 7.
    Geography Location Oceania,Australasia, Continent between the Indian Ocean and the South Pacific Ocean. Geographic coordinates 27 00 S, 133 00 E. Area Total : 7,686,850 sq km Land : 7,617,930 sq km Water : 68,920 sq km Land Boundaries 0 km Coastline 25,760 km
  • 8.
    Climate generally aridto semiarid; temperate in south and east; tropical in north. Terrain mostly low plateau with deserts; fertile plain in southeast. Elevation Extremes Lowest point : Lake Eyre -15 m H ighest point : Mount Kosciuszko 2,229 m Natural Resources Bauxite, Coal, Iron ore, Copper, Tin, Gold, Silver, Uranium, Nickel, Tungsten, Mineral sands, Lead, Zinc, Diamonds, Natural gas, Petroleum. Land Use Arable land : 6.15% (includes about 27 million hectares of cultivated grassland) Permanent crops : 0.04% Other : 93.81% Irrigated Land 25,450 sq km.
  • 9.
    Total Renewable resources398 cu km. Fresh Water resources total : 24.06 cu km/yr (15%/10%/75%) per capita : 1,193 cu m/yr Natural Hazards Cyclones along the coast Severe droughts Forest fires. Environment – Current Issues Soil erosion Industrial development Soil salinity Desertification Threat to Great Barrier Reef Limited natural fresh water resources
  • 10.
    People Population 20,600,856(July 2008 est.) Age Structure 0-14 years : 19.1% (male 2,014,230/female 1,920,604) 15-64 years : 67.5% (male 7,005,588/female 6,895,817) 65 years and over : 13.4% (male 1,226,432/female 1,538,185) (2008 est.) Median Age Total : 37.4 years Male : 36.6 years Female : 38.3 years (2008 est.) Population Growth Rate 0.801% (2008 est.)
  • 11.
    Birth Rate 11.9births/1,000 population (2008 est.) Death Rate 7.62 deaths/1,000 population (2008 est.) Net Migration Rate 3.72 migrant(s)/1,000 population (2008 est.) Sex Ratio At birth : 1.05 male(s)/female Under 15 years : 1.05 male(s)/female 15-64 years : 1.02 male(s)/female 65 years and over : 0.8 male(s)/female Total population : 0.99 male(s)/female (2008 est.) Infant Mortality Rate Total : 4.51 deaths/1,000 live births Male : 4.89 deaths/1,000 live births Female : 4.11 deaths/1,000 live births (2008 est.) Life Expectancy at birth Total population : 80.73 years Male : 77.86 years Female : 83.75 years (2008 est.)
  • 12.
    Ethnic Groups White92% Asian 7% Aboriginal and other 1% Religions Catholic 26.4% Anglican 20.5% Other Christian 20.5% Buddhist 1.9% Muslim 1.5% Other 1.2% Unspecified 12.7% None 15.3% Languages English 79.1% Chinese 2.1% Italian 1.9% Other 11.1% Unspecified 5.8% Literacy Total population: 99% Male: 99% Female: 99%
  • 13.
    Diaspora Indian Australiansare Australian citizens residents of Indian origin. Fastest growing ethnic group in Australia. Approx. 24% of population is of immigrants. Between 1981-2000, Asian Born population increased from 2,76,000 to over a million. In 2005-2006,India was the fourth major source of permanent migrants to Australia.
  • 14.
    Context Dates backto 19 th century. Sikhs and Muslims initially entered as operators of camel trains. Three Waves of Migration First Wave – Large Flow from Jalandhar. Second Wave – Population rose from 7,500 to 29,212. Third Wave – Declaration of Whitlam Labour Government. Africanisation Constituent States with largest Indian born residents are New South Wales, Victoria, Western Australia. Significant population of Punjabis among Immigrants. Transnational Networks Involvement in Socio Cultural Activities and Political Channels. Transnational TV channels like reminiscent and regional channels. Cultural Networks Religious Networks Communication Networks
  • 15.
    Facts Making tangiblecontribution for enhancing bilateral links. External affair minister Mr.Pranab Mukherjee called for youth exchange in various fields to take bilateral partnership forward. India is the third largest source of international immigrants, second largest source of skilled migrants and international students. Young Indians strengthening the Australian economy 15865 professionals.
  • 16.
    Government Government Typefederal parliamentary democracy. Administrative Divisions 6 states and 2 territories *; Australian Capital Territory*, New South Wales, Northern Territory*, Queensland, South Australia, Tasmania, Victoria, Western Australia Dependent Areas Ashmore and Cartier Islands, Christmas Island, Cocos (Keeling) Islands, Coral Sea Islands, Heard Island and McDonald Islands, Norfolk Island, Macquarie Island Independence 1 January 1901 (federation of UK colonies) Constitution 9 July 1900, effective 1 January 1901. Executive Branch Chief of state : Queen of Australia ELIZABETH II (since 6 February 1952); represented by Governor General Maj. Gen. (Ret.) Michael JEFFERY (since 11 August 2003) Head of government : Prime Minister Kevin RUDD (since 3 December 2007); Deputy Prime Minister Julia GILLARD (since 3 December 2007)
  • 17.
    Economy Currency – Australian Dollar . GDP – Around A$1 trillion (2007-2008). GDP Growth rate – 3.9%. GDP per capita – $32,900. GDP per sector Agricultural 3.8% Industry 26.2% Services 70% Labour Force – 10.66 million Inflation – 4.5% Unemployment – 4.3% Main Industries.
  • 18.
    Exports –A$215.8 billion. Exports goods – Coal, Gold, Meat Wool, Alumina, Iron Ore, Wheat, Machinery and Transport equipment. Main export partners – Japan 20.3%, China 11.5%, South Korea 7.9%, US 6.7%, New Zealand 6.5%, India 5%. Imports – A$227.8 billion. Import goods – Machinery and transport equipment, computers and office machines, telecommunications equipments and parts, crude oil and petroleum products. Main import partners – US 13.9%, China 13.7%, Japan 11%, Singapore 5.6%, Germany 5.6%.
  • 19.
    Bilateral Relations withIndia Started in 1801. Constant increase in trade turnover between two countries every corresponding year. Indian Exports to Australia Gems, pearls, and jewelry Chemicals and its by products Leather, leather goods, footwear, and travel goods Agricultural products Engineering goods and manufactures Textile, clothing, and make up Australian Exports to India Coal Copper and copper ores Wool Non- monetary gold Fresh vegetables Cotton Silver, zinc, platinum, and aluminum Indian IT Exports to Australia India Australia tourism Australia India Business Council Higher education in Australia for Indian students
  • 20.
    Indian Companies investedin Australia Sterlite Industries Oswal group Oberoi Hotels International Asian paints Aditya Birla Group Indian IT companies which have set up there offices in Australia are: Infosys NIIT TCS Kale Consultants Fujitsu Pentafour Satyam Aptech Polaris
  • 21.
    The key areasof interest to Australian investors Mining Sector Role in developing the wealth of Indian states Areas with highest potential for collaboration Bio Technological Sector Strong strategic science with India AISRF (Australia-India Strategic Research Fund) designed for the development A$ 20m over 5 years to AISRF to support joint research project Farm Sector Demanding flexible policies Australian stake holder have offers regarding to farming method, cropping pattern and developing varieties of crop Educational Sector The Australian VET system provides a broad range of learning Tourism Sector India is one of the fastest growing market 2006-07 tourism growth rate increased by 11%
  • 22.
    Information and CommunicationSector Major Indian ICT companies like TCS, Infosys etc. are active in Australia NIIT has strong partnership with Australian Consulting Companies Food Processing Sector Australian fruit is finding place in India’s store shelf – Citrus fruit, Plums, etc. Australia has potential to sell its cheese, wine etc. Engineering Process Outsourcing Sector India is fast becoming a major EPO destination Auto component Sector Large investments from major original equipment manufacturers (OEM) Energy Sector Australia reserves 40% of worlds total Nuclear energy India can get Uranium from Australia Clean Development Technology Sector
  • 23.
    Transportation Airports Withpaved runways - 317 With unpaved runways - 144 Pipelines Condensate/gas 469 km; Gas 26,719 km; Liquid petroleum gas 240 km; Oil 3,720 km; Oil/gas/water 110 km Railways Total : 38,550 km Broad gauge : 3,727 km 1.600-m gauge Standard gauge : 20,519 km 1.435-m gauge (1,877 km electrified) Narrow gauge : 14,074 km 1.067-m gauge (2,453 km electrified) Dual gauge : 230 km dual gauge
  • 24.
    Roadways Total :812,972 km Paved : 341,448 km Unpaved : 471,524 km Waterways 2,000 km (mainly used for recreation on Murray and Murray-Darling river systems) Merchant Marine Total : 52 ships (1000 GRT or over) 1,296,383 GRT/1,490,539 DWT By type : bulk carrier 13, cargo 6, chemical tanker 1, container 1, liquefied gas 4, passenger 7, passenger/cargo 7, petroleum tanker 8, roll on/roll off 5 Foreign-owned : 24 (Canada 9, France 1, Germany 2, Japan 1, Netherlands 2, Norway 1, Singapore 1, UK 5, US 2) Registered in other countries : 34 (Antigua and Barbuda 1, Bahamas 1, Bermuda 2, Dominica 2, Fiji 1, Marshall Islands 2, NZ 1, Panama 4, Singapore 11, Tonga 1, Tuvalu 1, UK 3, US 2, Vanuatu 2) Ports and Terminals Brisbane, Dampier, Fremantle, Gladstone, Hay Point, Melbourne, Newcastle, Port Hedland, Port Kembla, Port Walcott, Sydney.
  • 25.
  • 26.
    New Zealand -Background The Polynesian Maori reached New Zealand in about A.D. 800. In 1840, The Treaty of Waitangi. In that same year, the British began the first organized colonial settlement. The British colony of New Zealand became an independent dominion in 1907 and supported the UK militarily in both World Wars. New Zealand's full participation in a number of defense alliances lapsed by the 1980s. In recent years, the government has sought to address longstanding Maori grievances.
  • 27.
    Geography Location Oceania,Australasia, Islands in the South Pacific Ocean, Southeast of Australia. Geographic Coordinates 41 00 S, 174 00 E Area Total : 268,680 sq km Land : 268,021 sq km Water : NA Coastline 15,134 km Climate Temperate with sharp regional contrasts.
  • 28.
    Terrain Predominately mountainouswith some large coastal plains Elevation Extremes Lowest point: Pacific Ocean 0 m Highest point: Aoraki-Mount Cook 3,754 m Natural Resources Natural gas, Iron ore, Sand, Coal, Timber, Hydropower, Gold, Limestone Land Use Arable land: 5.54% Permanent crops: 6.92% Other: 87.54% Irrigated Land 2,850 sq km Natural Hazards Earthquakes are common, though usually not severe; Volcanic activity. Environment Issues Deforestation; Soil erosion; Native flora and fauna hard-hit by invasive species.
  • 29.
    People Population 4,173,460(July 2008 est.) Age Structure 0-14 years : 20.9% (male 446,883/female 424,240) 15-64 years : 66.5% (male 1,390,669/female 1,385,686) 65 years and over : 12.6% (male 238,560/female 287,422) Median Age Total : 36.3 years Male : 35.6 years Female : 37.1 years Population Growth Rate 0.971% (2008 est.)
  • 30.
    Birth Rate 14.09births/1,000 population (2008 est.) Death Rate 7 deaths/1,000 population (2008 est.) Net Migration Rate 3.62 migrant(s)/1,000 population (2008 est.) Sex Ratio At birth : 1.05 male(s)/female Under 15 years : 1.05 male(s)/female 15-64 years : 1 male(s)/female 65 years and over : 0.83 male(s)/female Total population : 0.99 male(s)/female (2008 est.) Infant Mortality Rate Total : 4.99 deaths/1,000 live births Male : 5.62 deaths/1,000 live births Female : 4.33 deaths/1,000 live births (2008 est.) Life Expectancy at birth Total population : 80.24 years Male : 78.33 years Female : 82.25 years (2008 est.)
  • 31.
    Ethnic Groups European69.8% Maori 7.9% Asian 5.7% Pacific islander 4.4% other 0.5% mixed 7.8% unspecified 3.8% Religions Anglican 14.9% Roman Catholic 12.4% Presbyterian 10.9% Methodist 2.9% Pentecostal 1.7% Baptist 1.3% other Christian 9.4% other 3.3% unspecified 17.2% none 26% Languages English (official) Maori (official) Sign Language (official) Literacy Total population : 99% Male : 99% Female : 99%
  • 32.
    Diaspora Arrival before1840 Racism and official opposition Population growth Women’s influence Immigration policy Indo Kiwi Regions with significant population Languages Religion – Worshipping together Home and Family Unity and Diversity Bollywood in New Zealand Arts and Sports
  • 33.
    Government Government TypeParliamentary Democracy Administrative Divisions 16 regions and 1 territory*; Auckland, Bay of Plenty, Canterbury, Chatham Islands*, Gisborne, Hawke's Bay, Manawatu-Wanganui, Marlborough, Nelson, Northland, Otago, Southland, Taranaki, Tasman, Waikato, Wellington, West Coast Dependent Areas Cook Islands, Niue, Tokelau Independence 26 September 1907 (from UK) Constitution consists of a series of legal documents, including certain acts of the UK and New Zealand Parliaments, as well as The Constitution Act 1986, which is the principal formal charter; adopted 1 January 1987, effective 1 January 1987. Executive Branch Chief of state : Queen ELIZABETH II (since 6 February 1952); represented by Governor General Anand SATYANAND (since 23 August 2006) Head of government : Prime Minister Helen CLARK (since 10 December 1999); Deputy Prime Minister Michael CULLEN (since July 2002)
  • 34.
    Economy Currency – New Zealand Dollar. GDP – $128.141 billion (2007 est.) GDP Growth rate – 3.0%. GDP per capita – $30,234. GDP per sector Agricultural 4.6% Industry 27.4% Services 68% Labour Force – 2.05 million Inflation – 3.9% Unemployment – 3.4% Main Industries .
  • 35.
    Exports –$29.2 billion. Exports goods – tourism destination, dairy products, meat, wood and wood products, fish, machinery. Main export partners – Australia 19.6%, U.S. 14.3%, Japan 11.4%, the People's Republic of China 6.3%, UK 5.1%. Imports – $35.8 billion. Import goods – Machinery and equipment, vehicles and aircraft, Petroleum, Electronics, Textiles, Plastics. Main import partners – Australia 28.6%, Japan 10.7%, U.S. 10%, the People's Republic of China 6.6%, Germany 4.2%, Singapore 4.1% .
  • 36.
    Bilateral Relations withIndia Introduction Services Tourism Film Industry Educational Sector Merchandise Trade Air Services Trade Access Issues Business Linkages Defence New Zealand to India India to New Zealand
  • 37.
    The key areasof interest to New Zealand investors Agricultural Sector Scope for bilateral corporation India is world’s largest milk producer & New Zealand is world-class food & beverage producer Tourism and Film Making India is no.1 film producer In 2006-07 120 Indian crews have chosen New Zealand for their movies Education Sector India is one of the New Zealand’s core education market Bio Technological Sector India has 850 biotech companies & 100 national laboratories Wood Processing Sector New Zealand is a major supplier of forest product – Sawn timber, moulding, etc. Information Technology Sector New Zealand ICT companies are making partnership with Indian companies for expanding the global network of Indian ICT business Aviation sector India’s turnover is US$ 3.5billion & expected growth of 20% over the next five years Health Care Sector World class hospitals & treatment at a fraction of what it costs in Europe & USA with comparable success rate & higher service level
  • 38.
    Transportation Airports Withpaved runways - 41 With unpaved runways - 80 Pipelines Condensate: 331 km Gas: 1,896 km Liquid petroleum gas: 172 km Oil: 288 km Refined products: 260 km Railways Total : 4,128 km Narrow gauge : 4,128 km 1.067-m gauge (506 km electrified) Roadways Total : 93,460 km Paved : 60,303 km (includes 171 km of expressways) Unpaved : 33,157 km
  • 39.
    Merchant Marine Total: 13 ships (1000 GRT or over) 135,325 GRT/126,527 DWT By type : bulk carrier 3, cargo 2, chemical tanker 1, passenger/cargo 4, petroleum tanker 1, roll on/roll off 2 Foreign-owned : 3 (Australia 1, Germany 1, South Africa 1) Registered in other countries : 5 (Antigua and Barbuda 2, Cook Islands 1, France 1, UK 1) Ports and Terminals Auckland, Lyttelton, Marsden Point, Tauranga, Wellington, Whangarei.
  • 40.
    India’s Foreign Policyand Relations with Australia India - Its Part in Australia’s Foreign Policy Pre 1991 Early Bilateral Trade Effect of NAM on Australia-India Relations Warming of Australia-India Relations Australia’s India Relations Post 1991 Trade and Other Initiatives The Midnight Hour Report Australia India - New Horizons Promotion Academic-Educational Links Australia-India Complementarities Lack of Cultural and Commercial Awareness Ongoing Issues - Economic, Political, Social, Cultural
  • 41.
    India and NewZealand in the Asian Century Historic relationship What has changed – India Rising The Government’s response Looking Ahead – taking the relationship forward Defence Ties
  • 42.
    India’s Trade withAustralia and New Zealand
  • 43.
    Source: Department ofCommerce, India (Dated: 24/08/2008) -26,872,704.00 -20,399,100.00 -26,872,704.00 -20,399,100.00 India's Trade Balance 107,504.17       TRADE BALANCE 0.25 0.14 2.54 2.29 %Share 26.46 27.43 26.46 27.43 %Growth 141,228,560.00 111,682,676.00 141,228,560.00 111,682,676.00 India's Total Trade 119.26 59.72 40.54 25.08 %Growth 348,037.05 158,733.32 3,589,547.03 2,554,201.03 TOTAL TRADE 0.14 0.15 3.77 3.32 %Share 27.27 31.8 27.27 31.8 %Growth 84,050,632.00 66,040,888.00 84,050,632.00 66,040,888.00 India's Total Import 25.4 66.82 44.76 27.48 %Growth 120,266.44 95,909.48 3,171,090.00 2,190,614.75 IMPORT 0.4 0.14 0.73 0.8 %Share 25.28 21.6 25.28 21.6 %Growth 57,177,928.00 45,641,788.00 57,177,928.00 45,641,788.00 India's Total Export 262.55 49.99 15.09 12.35 %Growth 227,770.61 62,823.84 418,457.03 363,586.28 EXPORT 2006-2007 2005-2006 2006-2007 2005-2006 Year   NEW ZEALAND AUSTRALIA Values in Rs. Lacs
  • 44.
    Source: ABS tradedata on DFAT STARS database and ABS catalogue 5368.0.
  • 45.
    Source: ABS tradedata on DFAT STARS database and ABS catalogue 5368.0.
  • 46.
    New Zealand exportsto and imports from India Wool Logs Butter Sheep skin leather Aluminum; waste and scrap Ferrous waste and scrap Machinery for sorting fruits and vegetables Waste and scrap of paper and paperboard Machine-tools Fiberboard Diamonds Bed linen, table linen Medicaments Jewelery articles Footwear; parts Cast articles Monumental or building stone Suits, women’s or girls Gymnastics and sports gear Footwear: rubber, plastic Top 10 New Zealand Exports to India Top 10 New Zealand Imports from India
  • 47.
    Bibliography http://www.commerce.nic.in http://www.dfat.gov.au https://www.cia.gov/library/publications/the-world-factbook/geos/as.html https://www.cia.gov/library/publications/the-world-factbook/geos/nz.html http://business.mapsofindia.com/trade-relations/india-australia/ http://encarta.msn.com/encyclopedia_761570609/Australasia.html http://encarta.msn.com/encyclopedia_761568792/Australia.html http://encarta.msn.com/encyclopedia_761568792/New_Zealand.html http://en.wikipedia.org/wiki/Australasia http://en.wikipedia.org/wiki/Oceania http://en.wikipedia.org/wiki/Australia http://en.wikipedia.org/wiki/New_Zealand http://www.mfat.govt.nz/Countries/Asia-South-and-Southeast/India.php
  • 48.