June 2013 Multifamily Housing Activity Report – Boston, MA Real Estate
•
0 likes•378 views

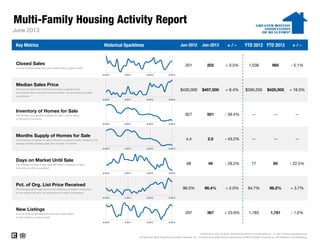
The report summarizes multi-family housing activity in Greater Boston between June 2012 and June 2013. Key metrics such as percentage of list price received, new listings, months supply of homes, and days on market saw improvements from the previous year. Median sales price increased 19.3% and inventory of homes for sale decreased 39.4%, while closed sales declined slightly by 5.1%. The data is broken down further between 2-family and 3-family properties in various cities and towns.

Recommended
Recommended
More Related Content
What's hot
What's hot (7)
Similar to June 2013 Multifamily Housing Activity Report – Boston, MA Real Estate
Similar to June 2013 Multifamily Housing Activity Report – Boston, MA Real Estate (17)
More from Unit Realty Group
More from Unit Realty Group (20)
Recently uploaded
Recently uploaded (20)
June 2013 Multifamily Housing Activity Report – Boston, MA Real Estate
- 1. Multi-Family Housing Activity Report Key Metrics Historical Sparklines Jun-2012 Jun-2013 + / – YTD 2012 YTD 2013 + / – Pct. of Org. List Price Received The average percentage found when dividing a property's sales price by the original list price, not accounting for seller concessions. 96.5% 98.4% + 2.0% 94.7% 60 98.2% Current as of July 16, 2013. Multi-family activity is comprised of 2-, 3- and 4-family properties only. All data from MLS Property Information Network, Inc. Provided by Greater Boston Association of REALTORS®. Powered by 10K Research and Marketing. -- + 3.7% New Listings A count of the properties that have been newly listed on the market in a given month. 297 367 + 23.6% 1,783 1,761 - 1.2% - 22.5% Months Supply of Homes for Sale The inventory of homes for sale at the end of a given month, divided by the average monthly pending sales from the last 12 months. 4.4 2.5 Days on Market Until Sale The average number of days between when a property is listed and when an offer is accepted. 68 49 - 28.2% 77 Inventory of Homes for Sale The number of properties available for sale in active status at the end of the month. 827 501 - 39.4% -- -- $457,500 + 6.4% $356,250 $425,000 + 19.3% -- -- --- 43.2% June 2013 Closed Sales A count of actual sales that have closed within a given month. 201 202 + 0.5% 985 - 5.1% Median Sales Price The point at which half of the homes sold in a given month were priced higher and one half priced lower, not accounting for seller concessions. $430,000 1,038 6-2010 6-2011 6-2012 6-2013 6-2010 6-2011 6-2012 6-2013 6-2010 6-2011 6-2012 6-2013 6-2010 6-2011 6-2012 6-2013 6-2010 6-2011 6-2012 6-2013 6-2010 6-2011 6-2012 6-2013 6-2010 6-2011 6-2012 6-2013 5B5B
- 2. All data from MLS Property Information Network, Inc. Provided by Greater Boston Association of REALTORS®. Powered by 10K Research and Marketing. Multi-Family Housing Activity Report – 2-Family Properties 6-2012 6-2013 + / – 6-2012 6-2013 + / – 6-2012 6-2013 + / – 6-2012 6-2013 + / – Acton 0 2 -- $0 $496,250 -- 0 105 -- 0 1 -- Arlington 5 7 + 40.0% $533,000 $650,000 + 22.0% 80 6 - 92.8% 6 3 - 50.0% Ashland 0 0 -- $0 $0 -- 0 0 -- 3 1 - 66.7% Attleboro 2 5 + 150.0% $71,750 $131,000 + 82.6% 57 159 + 181.1% 19 10 - 47.4% Bedford 1 0 - 100.0% $420,000 $0 - 100.0% 46 0 - 100.0% 2 0 - 100.0% Bellingham 1 1 0.0% $225,000 $240,000 + 6.7% 69 106 + 53.6% 2 1 - 50.0% Belmont 6 3 - 50.0% $550,750 $570,000 + 3.5% 25 24 - 3.4% 3 3 0.0% Boston 29 29 0.0% $428,000 $430,000 + 0.5% 42 42 - 0.4% 135 72 - 46.7% Boxborough 0 0 -- $0 $0 -- 0 0 -- 0 0 -- Brookline 2 1 - 50.0% $1,174,725 $1,500,000 + 27.7% 6 7 + 27.3% 8 7 - 12.5% Burlington 0 0 -- $0 $0 -- 0 0 -- 1 0 - 100.0% Cambridge 8 0 - 100.0% $764,000 $0 - 100.0% 26 0 - 100.0% 11 9 - 18.2% Canton 0 0 -- $0 $0 -- 0 0 -- 0 3 -- Carlisle 0 0 -- $0 $0 -- 0 0 -- 1 0 - 100.0% Chelsea 4 2 - 50.0% $231,600 $304,500 + 31.5% 208 71 - 66.0% 15 10 - 33.3% Concord 0 0 -- $0 $0 -- 0 0 -- 4 2 - 50.0% Dedham 2 1 - 50.0% $342,500 $395,000 + 15.3% 98 1 - 99.0% 12 6 - 50.0% Dover 0 0 -- $0 $0 -- 0 0 -- 1 1 0.0% Everett 3 7 + 133.3% $282,000 $380,000 + 34.8% 9 45 + 404.8% 13 14 + 7.7% Foxborough 0 1 -- $0 $410,000 -- 0 12 -- 1 1 0.0% Framingham 2 4 + 100.0% $184,500 $294,500 + 59.6% 15 88 + 488.3% 9 5 - 44.4% Franklin 2 0 - 100.0% $190,000 $0 - 100.0% 104 0 - 100.0% 4 2 - 50.0% Holliston 0 1 -- $0 $200,000 -- 0 42 -- 1 1 0.0% Hopkinton 0 0 -- $0 $0 -- 0 0 -- 0 1 -- Hudson 0 3 -- $0 $187,500 -- 0 87 -- 7 6 - 14.3% Lexington 2 1 - 50.0% $478,000 $881,500 + 84.4% 44 53 + 20.5% 2 3 + 50.0% Lincoln 0 0 -- $0 $0 -- 0 0 -- 2 0 - 100.0% Malden 11 5 - 54.5% $367,000 $420,000 + 14.4% 77 180 + 133.5% 25 20 - 20.0% Mansfield 0 0 -- $0 $0 -- 0 0 -- 0 4 -- Marlborough 2 1 - 50.0% $135,000 $146,000 + 8.1% 40 25 - 37.5% 14 3 - 78.6% Maynard 2 1 - 50.0% $286,000 $238,000 - 16.8% 42 64 + 52.4% 2 5 + 150.0% Medfield 0 0 -- $0 $0 -- 0 0 -- 2 0 - 100.0% Medford 6 10 + 66.7% $390,000 $523,500 + 34.2% 22 15 - 32.8% 19 10 - 47.4% Medway 0 0 -- $0 $0 -- 0 0 -- 3 1 - 66.7% Milford 1 0 - 100.0% $227,500 $0 - 100.0% 274 0 - 100.0% 14 6 - 57.1% Millis 0 0 -- $0 $0 -- 0 0 -- 1 1 0.0% Milton 2 1 - 50.0% $440,000 $529,000 + 20.2% 226 4 - 98.2% 10 4 - 60.0% Natick 3 0 - 100.0% $458,000 $0 - 100.0% 165 0 - 100.0% 8 5 - 37.5% Needham 1 1 0.0% $545,000 $470,000 - 13.8% 63 18 - 71.4% 3 2 - 33.3% Newton 7 9 + 28.6% $635,000 $740,000 + 16.5% 81 20 - 74.9% 23 12 - 47.8% June 2013 InventoryClosed Sales Days on MarketMedian Sales Price
- 3. All data from MLS Property Information Network, Inc. Provided by Greater Boston Association of REALTORS®. Powered by 10K Research and Marketing. Multi-Family Housing Activity Report – 2-Family Properties (cont.) 6-2012 6-2013 + / – 6-2012 6-2013 + / – 6-2012 6-2013 + / – 6-2012 6-2013 + / – Norfolk 0 0 -- $0 $0 -- 0 0 -- 2 0 - 100.0% North Attleboro 0 1 -- $0 $141,000 -- 0 21 -- 8 5 - 37.5% Norwood 0 0 -- $0 $0 -- 0 0 -- 3 5 + 66.7% Plainville 1 0 - 100.0% $340,000 $0 - 100.0% 49 0 - 100.0% 2 0 - 100.0% Quincy 6 14 + 133.3% $453,000 $450,000 - 0.7% 77 38 - 51.0% 27 25 - 7.4% Revere 9 8 - 11.1% $290,000 $402,420 + 38.8% 35 83 + 134.6% 30 18 - 40.0% Saugus 1 0 - 100.0% $225,000 $0 - 100.0% 51 0 - 100.0% 8 4 - 50.0% Sharon 0 0 -- $0 $0 -- 0 0 -- 2 2 0.0% Sherborn 0 0 -- $0 $0 -- 0 0 -- 1 0 - 100.0% Somerville 11 12 + 9.1% $540,000 $621,000 + 15.0% 60 27 - 55.7% 32 15 - 53.1% Southborough 0 0 -- $0 $0 -- 0 0 -- 0 4 -- Stow 0 0 -- $0 $0 -- 0 0 -- 2 0 - 100.0% Sudbury 0 0 -- $0 $0 -- 0 0 -- 0 1 -- Walpole 0 0 -- $0 $0 -- 0 0 -- 4 4 0.0% Waltham 2 3 + 50.0% $420,000 $493,000 + 17.4% 42 46 + 10.8% 13 6 - 53.8% Watertown 4 6 + 50.0% $533,500 $635,000 + 19.0% 24 41 + 74.0% 15 6 - 60.0% Wayland 0 0 -- $0 $0 -- 0 0 -- 2 0 - 100.0% Wellesley 1 0 - 100.0% $810,000 $0 - 100.0% 27 0 - 100.0% 2 0 - 100.0% Weston 0 0 -- $0 $0 -- 0 0 -- 1 0 - 100.0% Westwood 0 0 -- $0 $0 -- 0 0 -- 0 0 -- Winchester 0 1 -- $0 $635,000 -- 0 5 -- 7 3 - 57.1% Winthrop 1 3 + 200.0% $225,000 $425,000 + 88.9% 306 35 - 88.7% 4 2 - 50.0% Woburn 1 2 + 100.0% $630,000 $371,950 - 41.0% 108 4 - 96.8% 6 5 - 16.7% Wrentham 0 0 -- $0 $0 -- 0 0 -- 0 2 -- Greater Boston 141 146 +3.5% $420,000 $457,500 +8.9% 62 48 -22.8% 557 338 -39.3% Note: The "Greater Boston" figures are not a compilation or total of the individual areas. Days on Market Inventory June 2013 Closed Sales Median Sales Price
- 4. All data from MLS Property Information Network, Inc. Provided by Greater Boston Association of REALTORS®. Powered by 10K Research and Marketing. Multi-Family Housing Activity Report – 3-Family Properties 6-2012 6-2013 + / – 6-2012 6-2013 + / – 6-2012 6-2013 + / – 6-2012 6-2013 + / – Acton 0 0 -- $0 $0 -- 0 0 -- 0 0 -- Arlington 0 0 -- $0 $0 -- 0 0 -- 1 0 - 100.0% Ashland 0 0 -- $0 $0 -- 0 0 -- 5 2 - 60.0% Attleboro 2 4 + 100.0% $99,200 $215,000 + 116.7% 8 61 + 713.3% 11 4 - 63.6% Bedford 0 0 -- $0 $0 -- 0 0 -- 0 1 -- Bellingham 0 0 -- $0 $0 -- 0 0 -- 0 1 -- Belmont 0 0 -- $0 $0 -- 0 0 -- 0 0 -- Boston 22 20 - 9.1% $434,500 $474,750 + 9.3% 62 26 - 58.8% 122 66 - 45.9% Boxborough 0 0 -- $0 $0 -- 0 0 -- 0 0 -- Brookline 1 1 0.0% $1,275,000 $952,575 - 25.3% 7 5 - 28.6% 3 4 + 33.3% Burlington 0 0 -- $0 $0 -- 0 0 -- 0 0 -- Cambridge 0 2 -- $0 $1,378,000 -- 0 18 -- 4 6 + 50.0% Canton 0 0 -- $0 $0 -- 0 0 -- 0 1 -- Carlisle 0 0 -- $0 $0 -- 0 0 -- 0 0 -- Chelsea 1 1 0.0% $314,000 $360,000 + 14.6% 190 93 - 51.1% 15 8 - 46.7% Concord 0 0 -- $0 $0 -- 0 0 -- 0 0 -- Dedham 0 0 -- $0 $0 -- 0 0 -- 0 0 -- Dover 0 0 -- $0 $0 -- 0 0 -- 0 0 -- Everett 2 4 + 100.0% $404,000 $419,500 + 3.8% 39 24 - 39.1% 15 5 - 66.7% Foxborough 0 0 -- $0 $0 -- 0 0 -- 0 0 -- Framingham 2 0 - 100.0% $334,950 $0 - 100.0% 209 0 - 100.0% 2 2 0.0% Franklin 0 0 -- $0 $0 -- 0 0 -- 3 0 - 100.0% Holliston 0 0 -- $0 $0 -- 0 0 -- 1 1 0.0% Hopkinton 0 0 -- $0 $0 -- 0 0 -- 1 0 - 100.0% Hudson 0 0 -- $0 $0 -- 0 0 -- 3 3 0.0% Lexington 0 0 -- $0 $0 -- 0 0 -- 0 1 -- Lincoln 0 0 -- $0 $0 -- 0 0 -- 0 0 -- Malden 2 0 - 100.0% $301,000 $0 - 100.0% 65 0 - 100.0% 2 7 + 250.0% Mansfield 1 0 - 100.0% $339,900 $0 - 100.0% 28 0 - 100.0% 0 1 -- Marlborough 0 0 -- $0 $0 -- 0 0 -- 4 2 - 50.0% Maynard 0 0 -- $0 $0 -- 0 0 -- 0 0 -- Medfield 0 0 -- $0 $0 -- 0 0 -- 0 0 -- Medford 1 0 - 100.0% $427,000 $0 - 100.0% 57 0 - 100.0% 3 0 - 100.0% Medway 0 0 -- $0 $0 -- 0 0 -- 0 0 -- Milford 0 1 -- $0 $125,000 -- 0 339 -- 2 3 + 50.0% Millis 0 0 -- $0 $0 -- 0 0 -- 0 0 -- Milton 0 0 -- $0 $0 -- 0 0 -- 1 1 0.0% Natick 0 0 -- $0 $0 -- 0 0 -- 1 1 0.0% Needham 1 0 - 100.0% $485,000 $0 - 100.0% 11 0 - 100.0% 2 0 - 100.0% Newton 1 0 - 100.0% $690,000 $0 - 100.0% 58 0 - 100.0% 1 1 0.0% June 2013 Closed Sales Median Sales Price Days on Market Inventory
- 5. All data from MLS Property Information Network, Inc. Provided by Greater Boston Association of REALTORS®. Powered by 10K Research and Marketing. Multi-Family Housing Activity Report – 3-Family Properties (cont.) 6-2012 6-2013 + / – 6-2012 6-2013 + / – 6-2012 6-2013 + / – 6-2012 6-2013 + / – Norfolk 0 0 -- $0 $0 -- 0 0 -- 0 0 -- North Attleboro 1 1 0.0% $260,000 $280,000 +7.7% 698 49 -93.0% 5 2 -60.0% Norwood 0 0 -- $0 $0 -- 0 0 -- 1 1 0.0% Plainville 0 0 -- $0 $0 -- 0 0 -- 0 1 -- Quincy 4 1 -75.0% $438,500 $581,000 +32.5% 52 11 -78.9% 4 5 +25.0% Revere 2 2 0.0% $297,500 $279,000 -6.2% 16 10 -37.5% 6 4 -33.3% Saugus 0 0 -- $0 $0 -- 0 0 -- 1 0 -100.0% Sharon 0 0 -- $0 $0 -- 0 0 -- 0 0 -- Sherborn 0 0 -- $0 $0 -- 0 0 -- 0 0 -- Somerville 9 4 -55.6% $629,900 $602,500 -4.3% 60 7 -89.1% 7 6 -14.3% Southborough 0 0 -- $0 $0 -- 0 0 -- 0 0 -- Stow 0 0 -- $0 $0 -- 0 0 -- 0 0 -- Sudbury 0 0 -- $0 $0 -- 0 0 -- 0 0 -- Walpole 0 1 -- $0 $369,900 -- 0 21 -- 1 1 0.0% Waltham 0 1 -- $0 $577,000 -- 0 16 -- 1 1 0.0% Watertown 0 1 -- $0 $742,000 -- 0 1 -- 2 0 -100.0% Wayland 0 0 -- $0 $0 -- 0 0 -- 0 0 -- Wellesley 0 0 -- $0 $0 -- 0 0 -- 0 1 -- Weston 0 0 -- $0 $0 -- 0 0 -- 0 0 -- Westwood 0 0 -- $0 $0 -- 0 0 -- 0 0 -- Winchester 0 0 -- $0 $0 -- 0 0 -- 0 0 -- Winthrop 0 1 -- $0 $476,000 -- 0 11 -- 1 1 0.0% Woburn 0 1 -- $0 $439,000 -- 0 25 -- 1 0 -100.0% Wrentham 0 0 -- $0 $0 -- 0 0 -- 1 1 0.0% Greater Boston 52 46 -11.5% $439,950 $464,750 +5.6% 74 33 -55.7% 232 134 -42.2% Note: The "Greater Boston" figures are not a compilation or total of the individual areas. Closed Sales Median Sales Price Days on Market Inventory June 2013
- 6. All data from MLS Property Information Network, Inc. Provided by Greater Boston Association of REALTORS®. Powered by 10K Research and Marketing. Multi-Family Housing Activity Report – 4-Family Properties 6-2012 6-2013 + / – 6-2012 6-2013 + / – 6-2012 6-2013 + / – 6-2012 6-2013 + / – Acton 0 0 -- $0 $0 -- 0 0 -- 0 0 -- Arlington 0 0 -- $0 $0 -- 0 0 -- 0 0 -- Ashland 0 0 -- $0 $0 -- 0 0 -- 0 0 -- Attleboro 0 0 -- $0 $0 -- 0 0 -- 3 3 0.0% Bedford 0 0 -- $0 $0 -- 0 0 -- 0 0 -- Bellingham 0 0 -- $0 $0 -- 0 0 -- 0 0 -- Belmont 0 0 -- $0 $0 -- 0 0 -- 0 0 -- Boston 1 3 + 200.0% $1,460,000 $450,000 - 69.2% 107 11 - 89.7% 10 6 - 40.0% Boxborough 0 0 -- $0 $0 -- 0 0 -- 0 0 -- Brookline 1 0 - 100.0% $2,000,000 $0 - 100.0% 3 0 - 100.0% 0 0 -- Burlington 0 0 -- $0 $0 -- 0 0 -- 0 0 -- Cambridge 0 1 -- $0 $1,925,000 -- 0 78 -- 1 1 0.0% Canton 0 0 -- $0 $0 -- 0 0 -- 0 0 -- Carlisle 0 0 -- $0 $0 -- 0 0 -- 0 0 -- Chelsea 0 1 -- $0 $355,000 -- 0 20 -- 1 1 0.0% Concord 0 0 -- $0 $0 -- 0 0 -- 0 0 -- Dedham 0 0 -- $0 $0 -- 0 0 -- 0 0 -- Dover 0 0 -- $0 $0 -- 0 0 -- 0 0 -- Everett 0 0 -- $0 $0 -- 0 0 -- 1 0 - 100.0% Foxborough 0 0 -- $0 $0 -- 0 0 -- 0 0 -- Framingham 0 0 -- $0 $0 -- 0 0 -- 2 2 0.0% Franklin 0 0 -- $0 $0 -- 0 0 -- 0 1 -- Holliston 0 3 -- $0 $345,000 -- 0 391 -- 4 0 - 100.0% Hopkinton 0 1 -- $0 $487,400 -- 0 32 -- 0 0 -- Hudson 0 0 -- $0 $0 -- 0 0 -- 0 0 -- Lexington 0 0 -- $0 $0 -- 0 0 -- 0 0 -- Lincoln 0 0 -- $0 $0 -- 0 0 -- 0 0 -- Malden 0 0 -- $0 $0 -- 0 0 -- 1 0 - 100.0% Mansfield 0 0 -- $0 $0 -- 0 0 -- 0 2 -- Marlborough 0 0 -- $0 $0 -- 0 0 -- 3 2 - 33.3% Maynard 0 0 -- $0 $0 -- 0 0 -- 0 0 -- Medfield 0 0 -- $0 $0 -- 0 0 -- 0 1 -- Medford 1 0 - 100.0% $473,500 $0 - 100.0% 70 0 - 100.0% 0 0 -- Medway 0 0 -- $0 $0 -- 0 0 -- 0 0 -- Milford 1 0 - 100.0% $245,000 $0 - 100.0% 237 0 - 100.0% 1 1 0.0% Millis 0 0 -- $0 $0 -- 0 0 -- 0 0 -- Milton 0 0 -- $0 $0 -- 0 0 -- 0 0 -- Natick 0 0 -- $0 $0 -- 0 0 -- 0 0 -- Needham 0 0 -- $0 $0 -- 0 0 -- 0 0 -- Newton 0 1 -- $0 $759,000 -- 0 3 -- 2 1 - 50.0% June 2013 Closed Sales Median Sales Price Days on Market Inventory
- 7. All data from MLS Property Information Network, Inc. Provided by Greater Boston Association of REALTORS®. Powered by 10K Research and Marketing. Multi-Family Housing Activity Report – 4-Family Properties (cont.) 6-2012 6-2013 + / – 6-2012 6-2013 + / – 6-2012 6-2013 + / – 6-2012 6-2013 + / – Norfolk 0 0 -- $0 $0 -- 0 0 -- 0 1 -- North Attleboro 0 0 -- $0 $0 -- 0 0 -- 1 1 0.0% Norwood 0 0 -- $0 $0 -- 0 0 -- 0 0 -- Plainville 0 0 -- $0 $0 -- 0 0 -- 2 0 -100.0% Quincy 2 0 -100.0% $465,000 $0 -100.0% 147 0 -100.0% 5 4 -20.0% Revere 0 0 -- $0 $0 -- 0 0 -- 1 2 +100.0% Saugus 0 0 -- $0 $0 -- 0 0 -- 0 0 -- Sharon 0 0 -- $0 $0 -- 0 0 -- 0 0 -- Sherborn 0 0 -- $0 $0 -- 0 0 -- 0 0 -- Somerville 1 0 -100.0% $775,000 $0 -100.0% 290 0 -100.0% 4 0 -100.0% Southborough 0 0 -- $0 $0 -- 0 0 -- 0 0 -- Stow 0 0 -- $0 $0 -- 0 0 -- 0 0 -- Sudbury 0 0 -- $0 $0 -- 0 0 -- 0 0 -- Walpole 0 0 -- $0 $0 -- 0 0 -- 0 0 -- Waltham 1 0 -100.0% $460,000 $0 -100.0% 57 0 -100.0% 0 1 -- Watertown 0 0 -- $0 $0 -- 0 0 -- 0 0 -- Wayland 0 0 -- $0 $0 -- 0 0 -- 0 0 -- Wellesley 0 0 -- $0 $0 -- 0 0 -- 0 0 -- Weston 0 0 -- $0 $0 -- 0 0 -- 0 0 -- Westwood 0 0 -- $0 $0 -- 0 0 -- 0 0 -- Winchester 0 0 -- $0 $0 -- 0 0 -- 0 0 -- Winthrop 0 0 -- $0 $0 -- 0 0 -- 0 0 -- Woburn 0 0 -- $0 $0 -- 0 0 -- 1 0 -100.0% Wrentham 0 0 -- $0 $0 -- 0 0 -- 0 0 -- Greater Boston 8 10 +25.0% $486,750 $402,500 -17.3% 132 134 +1.4% 38 29 -23.7% Note: The "Greater Boston" figures are not a compilation or total of the individual areas. Closed Sales Median Sales Price Days on Market Inventory June 2013