SlideShare a Scribd company logo
1 of 21
Download to read offline
asiamoney.com 1
2011 2010 FIRM %
1 2 UBS 13.25%
2 1 CLSA 12.84%
3 5 Citi 7.71%
4 4 Bank of America - Merrill Lynch 7.34%
5 – HSBC 7.19%
6 9 Goldman Sachs 6.58%
7 3 Morgan Stanley 6.55%
8 6 Deutsche Bank 5.87%
9 8 Credit Suisse 5.52%
10 7 J.P. Morgan 4.71%
Overall combined research & sales for Australia
2011 2010 FIRM %
1 1 Macquarie 18.36%
2 2 UBS 14.67%
3 7 CLSA 10.14%
4 3 J.P. Morgan 9.63%
5 4 Goldman Sachs 7.90%
6 6 Credit Suisse 7.23%
7 9 BankofAmerica-MerrillLynch 6.56%
8 10 Citi 6.10%
9 5 DeutscheBank 4.88%
10 8 Morgan Stanley 4.29%
Overall combined research & sales for Japan
2011 2010 FIRM %
1 1 Nomura 25.17%
2 2 CLSA 8.12%
3 10 BankofAmerica-MerrillLynch 7.66%
4 3 Daiwa* 7.40%
5 – Mizuho 6.62%
6 6 Morgan Stanley 6.49%
7 5 UBS 6.13%
8 7 Goldman Sachs 4.79%
9 8 Citi 3.91%
10 4 J.P.Morgan 3.88%
* Daiwa Institute of Research
Overall regional research for Asia (ex Australia & Japan)
2011 2010 FIRM %
1 2 UBS 13.75%
2 1 CLSA 11.84%
3 3 BankofAmerica-MerrillLynch 7.62%
4 9 Goldman Sachs 6.83%
5 8 Citi 6.63%
6 7 Deutsche Bank 6.39%
7 6 MorganStanley 6.14%
8 – HSBC 5.98%
9 4 J.P. Morgan 5.55%
10 5 Credit Suisse 5.31%
Overall regional sales for Asia (ex Australia & Japan)
2011 2010 FIRM %
1 1 CLSA 13.45%
2 2 UBS 12.94%
3 5 Citi 8.37%
4 – HSBC 7.93%
5 4 BankofAmerica-MerrillLynch 7.17%
6 3 Morgan Stanley 6.80%
7 9 GoldmanSachs 6.43%
8 8 Credit Suisse 5.64%
9 6 Deutsche Bank 5.56%
10 7 J.P. Morgan 4.19%
Overallcombinedregionalresearch&salesforAsia(exAustralia& Japan)
BROKERSPOLL
HEDGE FUND SERVICES
BEST FOR OVERALL SERVICES TO HEDGE FUNDS
2011 2010 Firm %
1 1 UBS 11.04%
2 3 Morgan Stanley 10.05%
3 5 Goldman Sachs 9.62%
4 2 Deutsche Bank 8.87%
5 8 Bank of America - Merrill Lynch 8.01%
6 6 CLSA 7.86%
7 4 Credit Suisse 6.07%
8 – HSBC 5.06%
9 7 Citi 4.73%
10 – CICC 3.87%
BEST FOR CLIENT SERVICE COVERAGE
2011 2010* Firm %
1 – Morgan Stanley 10.16%
2 – UBS 9.69%
3 – Goldman Sachs 9.12%
4 – Bank of America - Merrill Lynch 8.70%
5 – Deutsche Bank 7.55%
BEST BESPOKE RESEARCH
2011 2010* Firm %
1 – CLSA 13.37%
2 – UBS 8.91%
3 – Morgan Stanley 8.58%
4 – Goldman Sachs 8.22%
5 – Deutsche Bank 6.79%
BEST TRADING EXECUTION – CASH
2011 2010* Firm %
1 – UBS 12.58%
2 – Morgan Stanley 9.89%
3 – Deutsche Bank 9.10%
4 – Credit Suisse 8.38%
5 – Bank of America - Merrill Lynch 7.42%
BEST TRADING EXECUTION – DERIVATIVES
2011 2010* Firm %
1 – UBS 14.40%
2 – Deutsche Bank 10.87%
3 – Goldman Sachs 10.09%
4 – Bank of America - Merrill Lynch 9.65%
5 – Morgan Stanley 9.34%
BEST SALES PEOPLE SERVICING HEDGE FUNDS
2011 2010 Name Firm %
1 1 Andrew Reeves Deutsche Bank 1.97%
2 – Henry Wang Deutsche Bank 1.41%
3 – Arthur Chen Citi 1.33%
4 – Curtis Man UBS 1.22%
5 – Gordon Lu CICC 1.11%
BEST SALES-TRADERS SERVICING HEDGE FUNDS
2011 2010 Name Firm %
1 – Andrew Reeves Deutsche Bank 1.97%
2 – Charles Pratt Credit Suisse 1.91%
=3 1 Jerry Yoon RBS 1.46%
=3 – Lo Lee UBS 1.46%
5 – Josie Fung Morgan Stanley 1.40%
* Results not published in 2010
PRIME BROKING
BEST FOR OVERALL SERVICES IN PRIME BROKING
2011 2010 Firm %
1 1 UBS 16.62%
2 3 Goldman Sachs 14.89%
3 4 Deutsche Bank 14.42%
4 2 Morgan Stanley 14.32%
5 6 Credit Suisse 7.89%
6 10 Bank of America - Merrill Lynch 6.57%
7 – Citi 3.84%
8 – HSBC 2.81%
9 – CICC 2.68%
10 5 J.P. Morgan 2.12%
BEST PRODUCT INNOVATION FOR PRIME BROKING
2011 2010 Firm %
1 2 Morgan Stanley 16.52%
2 1 UBS 15.94%
3 4 Deutsche Bank 14.82%
4 3 Goldman Sachs 14.80%
5 5 Credit Suisse 9.20%
BEST PRICING FOR PRIME BROKING
2011 2010 Firm %
1 1 UBS 17.58%
2 3 Deutsche Bank 13.69%
3 2 Morgan Stanley 13.05%
4 4 Goldman Sachs 10.53%
5 5 Credit Suisse 9.37%
BEST RISK MANAGEMENT ADVISORY
2011 2010 Firm %
1 4 Goldman Sachs 19.43%
2 1 UBS 18.42%
3 3 Deutsche Bank 16.84%
4 2 Morgan Stanley 13.97%
5 5 Credit Suisse 7.11%
BEST CLIENT SERVICE FOR PRIME BROKING
2011 2010 Firm %
1 2 Morgan Stanley 17.00%
2 1 UBS 16.48%
3 4 Goldman Sachs 16.02%
4 3 Deutsche Bank 14.87%
5 – Bank of America - Merrill Lynch 7.32%
2 NOVEMBER2011 ASIAMONEY
asiamoney.com 3
REGIONAL (INDIVIDUAL)ASIA EX JAPAN
BEST STRATEGIST
Rank Name Firm %
1 Christopher Wood CLSA 16.21%
2 Jun Ma Deutsche Bank 10.61%
3 Sean Darby Nomura 7.69%
BEST ECONOMIST
Rank Name Firm %
1 Jun Ma Deutsche Bank 19.72%
2 Jonathan Anderson UBS 11.81%
3 Tao Wang UBS 6.95%
BEST QUANTITATIVE / TECHNICAL ANALYST
Rank Name Firm %
1 Laurence Balanco CLSA 12.91%
2 Shanle Wu UBS 6.93%
3 Steven Malin J.P. Morgan 6.70%
BEST ANALYST FOR BANKS
Rank Name Firm %
1 Ning Ma Goldman Sachs 27.85%
2 Lucy Feng Nomura 7.45%
3 Winnie Wu BoA - Merrill Lynch 3.75%
BEST ANALYST FOR CONGLOMERATES
Rank Name Firm %
1 Christie Ju Jefferies 44.69%
2 Julian Bu Jefferies 4.93%
3 Simon Cheung Goldman Sachs 4.66%
BEST ANALYST FOR CONSUMER DISCRETIONARY
Rank Name Firm %
1 Frank Li J.P. Morgan 21.84%
2 Xiaopo Wei CLSA 19.09%
3 Heather Hsu CLSA 4.85%
BEST ANALYST FOR CONSUMER STAPLES
Rank Name Firm %
1 Jessie Guo Jefferies 25.69%
2 Xiaopo Wei CLSA 15.53%
3 Heather Hsu CLSA 5.04%
BEST ANALYST FOR ENERGY
Rank Name Firm %
1 Laban Yu Jefferies 22.45%
2 Graham Cunningham Citi 12.96%
3 Thomas Wong BoA - Merrill Lynch 6.59%
BEST ANALYST FOR INSURANCE
Rank Name Firm %
1 Bob Leung UBS 26.01%
2 Ben Lin Morgan Stanley 16.13%
3 Karen Chan BoA - Merrill Lynch 13.60%
BEST ANALYST FOR MATERIALS
Rank Name Firm %
1 Trina Chen Credit Suisse 23.88%
2 Andrew Dale Macquarie 6.45%
3 Richard Leung CLSA 4.45%
REGIONAL (TEAM)ASIA EX JAPAN
BEST TEAM FOR STRATEGY
Rank Firm %
1 CLSA 19.41%
2 UBS 15.29%
3 Deutsche Bank 13.15%
BEST TEAM FOR ECONOMIC RESEARCH
Rank Firm %
1 UBS 24.93%
2 Deutsche Bank 22.39%
3 CLSA 8.88%
BEST TEAM FOR QUANTITATIVE / TECHNICAL ANALYSIS
Rank Firm %
1 CLSA 17.46%
2 UBS 11.95%
3 J.P. Morgan 11.41%
BEST TEAM FOR BANKS
Rank Firm %
1 Goldman Sachs 30.76%
2 Nomura 8.21%
3 UBS 6.58%
BEST TEAM FOR CONGLOMERATES
Rank Firm %
1 Jefferies 55.39%
2 Goldman Sachs 6.56%
3 BoA - Merrill Lynch 4.52%
BEST TEAM FOR CONSUMER DISCRETIONARY
Rank Firm %
1 CLSA 27.99%
2 J.P. Morgan 24.16%
3 UBS 6.98%
BEST TEAM FOR CONSUMER STAPLES
Rank Firm %
1 Jefferies 26.14%
2 CLSA 22.83%
3 UBS 7.12%
BEST TEAM FOR ENERGY
Rank Firm %
1 Jefferies 22.45%
2 Citi 14.99%
3 UBS 14.52%
BEST TEAM FOR INSURANCE
Rank Firm %
1 UBS 26.66%
2 Morgan Stanley 16.58%
3 BoA - Merrill Lynch 15.03%
BEST TEAM FOR MATERIALS
Rank Firm %
1 Credit Suisse 25.22%
2 UBS 15.84%
3 Macquarie 10.09%
BEST TEAM FOR REAL ESTATE
Rank Firm %
1 Jefferies 41.48%
2 Citi 9.71%
3 UBS 5.83%
4 NOVEMBER2011 ASIAMONEY
BEST ANALYST FOR REAL ESTATE
Rank Name Firm %
1 Christie Ju Jefferies 41.32%
2 Oscar Choi Citi 8.22%
3 Tony Tsang Deutsche Bank 4.54%
BEST ANALYST FOR SEMICONDUCTORS & SEMICONDUCTOR EQUIPMENT
Rank Name Firm %
1 Jonah Cheng UBS 36.28%
2 Kirk Yang Barclays Capital 4.97%
3 Eric Chen Daiwa 4.03%
BEST ANALYST FOR TECHNOLOGY HARDWARE & EQUIPMENT
Rank Name Firm %
1 Jonah Cheng UBS 22.57%
2 Kirk Yang Barclays Capital 9.19%
3 Arthur Hsieh UBS 8.38%
BEST ANALYST FOR TELECOMMUNICATION SERVICES
Rank Name Firm %
1 Cynthia Meng Jefferies 31.74%
2 Jinjin Wang UBS 14.20%
3 Steven Zhang DBS Vickers 2.63%
BEST ANALYST FOR UTILITIES
Rank Name Firm %
1 Pierre Lau Citi 23.30%
2 Ivan Lee Nomura 14.57%
3 Dave Dai Daiwa 8.08%
BEST REGIONAL SALESPERSON
Rank Name Firm %
1 Peili Wang HSBC 2.08%
2 Ronald Cheung UBS 1.71%
3 Curtis Man UBS 1.64%
BEST REGIONAL SALES TRADER
Rank Name Firm %
1 Eric Fang UBS 5.20%
2 Kenyon Tse UBS 2.49%
=3 Andrew Reeves Deutsche Bank 1.75%
=3 John Chapman HSBC 1.75%
REGIONAL (INDIVIDUAL) CONT.
ASIA EX JAPAN
REGIONAL (TEAM) CONT.
ASIA EX JAPAN
BEST TEAM FOR SEMICONDUCTORS & SEMICONDUCTOR EQUIPMENT
Rank Firm %
1 UBS 40.39%
2 Barclays Capital 7.63%
3 Daiwa 6.18%
BEST TEAM FOR TECHNOLOGY HARDWARE & EQUIPMENT
Rank Firm %
1 UBS 35.16%
2 Barclays Capital 10.10%
3 Goldman Sachs 8.07%
BEST TEAM FOR TELECOMMUNICATION SERVICES
Rank Firm %
1 Jefferies 32.39%
2 UBS 16.77%
3 Goldman Sachs 5.14%
BEST TEAM FOR UTILITIES
Rank Firm %
1 Citi 23.73%
2 Nomura 14.91%
3 UBS 14.36%
BEST TEAM FOR REGIONAL SALES
Rank Firm %
1 UBS 17.33%
2 CLSA 12.16%
3 HSBC 10.99%
BEST TEAM FOR REGIONAL SALES TRADING
Rank Firm %
1 UBS 15.95%
2 HSBC 13.29%
3 CLSA 9.50%
MOST IMPROVED BROKERAGE OVER THE LAST 12 MONTHS
Rank Firm %
1 UBS 14.03%
2 HSBC 7.61%
3 Samsung 6.44%
BEST OVERALL SALES SERVICES
Rank Firm %
1 CLSA 15.84%
2 UBS 12.74%
3 HSBC 8.53%
BEST REGIONAL BROKERAGE FOR EXECUTION
Rank Firm %
1 UBS 13.80%
2 CLSA 11.35%
3 Deutsche Bank 10.25%
MOST INDEPENDENT RESEARCH
Rank Firm %
1 CLSA 30.19%
2 UBS 8.76%
3 HSBC 6.30%
LEAST INDEPENDENT RESEARCH
Rank Firm %
1 Goldman Sachs 37.98%
2 Morgan Stanley 11.26%
3 UBS 8.86%
asiamoney.com 5
AUSTRALIA
BEST LOCAL BROKERAGE
Rank Firm %
1 Macquarie 55.40%
2 Bell Porter 6.79%
3 Patersons 6.15%
BEST FOR OVERALL COUNTRY RESEARCH
Rank Firm %
1 Macquarie 20.65%
2 UBS 16.18%
3 Goldman Sachs 11.57%
BEST ANALYST
Rank Name Firm %
1 Stuart Baker Morgan Stanley 7.18%
2 Neale Goldston-Morris Macquarie 4.54%
3 Lou Pirenc Morgan Stanley 4.06%
BEST RESEARCH COVERAGE
Sector Firm
Strategy Macquarie
Macroeconomics UBS
Small caps Deutsche Bank
Banks CLSA
Energy Morgan Stanley
Food & staples retailing BoA - Merrill Lynch
Materials UBS
Real Estate J.P. Morgan
BEST OVERALL SALES SERVICES
Rank Firm %
1 Macquarie 16.83%
2 UBS 13.66%
3 CLSA 10.61%
BEST SALESPERSON
Rank Name Firm %
1 Maureen Baker CLSA 7.75%
2 Gavan Carroll Credit Suisse 4.06%
3 Phil Montgomerie BoA - Merrill Lynch 2.61%
BEST EXECUTION
Rank Firm %
1 Macquarie 19.53%
2 UBS 15.99%
3 Citi 12.15%
BEST IN SALES TRADING
Rank Firm %
1 Macquarie 19.96%
2 UBS 17.06%
3 Citi 13.34%
MOST IMPROVED BROKERAGE OVER THE LAST 12 MONTHS
Rank Firm %
1 CLSA 18.44%
2 BoA - Merrill Lynch 13.72%
3 UBS 11.58%
BEST FOR EVENTS AND/OR CONFERENCES
Rank Firm %
1 Macquarie 29.31%
2 UBS 14.61%
3 BoA - Merrill Lynch 10.66%
BEST FOR ROADSHOWS AND COMPANY VISITS
Rank Firm %
1 UBS 19.95%
2 Macquarie 19.70%
3 J.P. Morgan 12.27%
MOST INDEPENDENT RESEARCH BROKERAGE
Rank Firm %
1 CLSA 32.67%
2 Morgan Stanley 10.46%
3 J.P. Morgan 8.99%
6 NOVEMBER2011 ASIAMONEY
BEST LOCAL BROKERAGE
Rank Firm %
1 CICC 41.86%
2 CITICS 18.33%
3 SWS 14.40%
BEST FOR OVERALL COUNTRY RESEARCH
Rank Firm %
1 CICC 19.82%
2 UBS 10.05%
3 SWS 7.15%
BEST ANALYST
Rank Name Firm %
1 Jun Ma Deutsche Bank 7.39%
2 Guo Hai Yan CICC 5.99%
3 Gao Zheng CICC 3.46%
BEST RESEARCH COVERAGE
Sector Firm
Strategy UBS
Macroeconomics Deutsche Bank
Small caps SWS
Banks CICC
Energy CICC
Insurance CICC
Materials CICC
Telecommunication services CICC
BEST OVERALL SALES SERVICES
Rank Firm %
1 CICC 17.19%
2 UBS 9.55%
3 CLSA 7.48%
BEST SALESPERSON
Rank Name Firm %
1 Arthur Chen Citi 6.25%
2 Jimmy Zhu Credit Suisse 3.99%
3 Henry Wang Deutsche Bank 2.63%
BEST EXECUTION
Rank Firm %
1 CICC 15.55%
2 UBS 13.38%
3 Morgan Stanley 6.61%
BEST IN SALES TRADING
Rank Firm %
1 CICC 16.21%
2 UBS 13.90%
3 Goldman Sachs 7.17%
MOST IMPROVED BROKERAGE OVER THE LAST 12 MONTHS
Rank Firm %
1 UBS 20.48%
2 CICC 9.34%
3 SWS 7.98%
BEST FOR EVENTS AND/OR CONFERENCES
Rank Firm %
1 UBS 14.58%
2 CLSA 14.17%
3 CICC 10.44%
BEST FOR ROADSHOWS AND COMPANY VISITS
Rank Firm %
1 CICC 13.62%
2 UBS 10.40%
3 CLSA 7.82%
MOST INDEPENDENT RESEARCH BROKERAGE
Rank Firm %
1 CLSA 23.51%
2 CICC 17.53%
3 SWS 10.65%
CHINA
asiamoney.com 7
BEST LOCAL BROKERAGE
Rank Firm %
1 HSBC 36.25%
2 CCBI 21.88%
3 Standard Chartered 13.51%
BEST FOR OVERALL COUNTRY RESEARCH
Rank Firm %
1 CLSA 10.41%
2 Citi 8.58%
3 HSBC 8.18%
BEST ANALYST
Rank Name Firm %
1 Jim Tang SWS 3.10%
2 Oscar Choi Citi 2.34%
3 Guo Hai Yan CICC 2.30%
BEST RESEARCH COVERAGE
Sector Firm
Strategy UBS
Macroeconomics Deutsche Bank
Small caps Citi
Banks Goldman Sachs
Capital goods SWS
Insurance BoA - Merrill Lynch
Real estate Citi
Utilities Citi
BEST OVERALL SALES SERVICES
Rank Firm %
1 CLSA 8.71%
2 Citi 8.31%
3 UBS 8.09%
BEST SALESPERSON
Rank Name Firm %
1 Arthur Chen Citi 6.52%
2 Jimmy Zhu Credit Suisse 3.79%
3 Philip Chan SWS 2.33%
BEST EXECUTION
Rank Firm %
1 UBS 12.48%
2 CLSA 6.94%
3 Citi 6.79%
BEST IN SALES TRADING
Rank Firm %
1 UBS 11.09%
2 Citi 7.99%
3 CLSA 7.65%
MOST IMPROVED BROKERAGE OVER THE LAST 12 MONTHS
Rank Firm %
1 CCBI 9.18%
2 SWS 8.98%
3 HSBC 6.88%
BEST FOR EVENTS AND/OR CONFERENCES
Rank Firm %
1 CLSA 17.85%
2 UBS 9.68%
3 Citi 8.11%
BEST OR ROADSHOWS AND COMPANY VISITS
Rank Firm %
1 CLSA 8.84%
2 UBS 8.39%
3 BoA - Merrill Lynch 7.53%
MOST INDEPENDENT RESEARCH BROKERAGE
Rank Firm %
1 CLSA 26.10%
2 SWS 7.93%
3 HSBC 7.77%
HONG KONG
8 NOVEMBER2011 ASIAMONEY
BEST LOCAL BROKERAGE
Rank Firm %
1 Kotak 20.31%
2 Motilal Oswal 14.67%
3 Edelweiss 10.60%
BEST FOR OVERALL COUNTRY RESEARCH
Rank Firm %
1 CLSA 23.15%
2 Kotak 9.25%
3 Morgan Stanley 6.82%
BEST ANALYST
Rank Name Firm %
1 Sanjeev Prasad Kotak 6.61%
2 Nikhil Vora IDFC 5.23%
3 Neelkanth Mishra Credit Suisse 3.03%
BEST RESEARCH COVERAGE
Sector Firm
Strategy CLSA
Macroeconomics Morgan Stanley
Small caps B&K
Banks CLSA
Capital goods Citi / Kotak
Energy Kotak
Materials Macquarie
Software & services CLSA
BEST OVERALL SALES SERVICES
Rank Firm %
1 CLSA 13.29%
2 Citi 6.55%
3 Kotak 6.40%
BEST SALESPERSON
Rank Name Firm %
1 Sujay Kamath CLSA 3.68%
2 Pawan Nahar CLSA 2.46%
3 Navin Roy Macquarie 2.29%
BEST EXECUTION
Rank Firm %
1 CLSA 13.22%
2 Citi 6.70%
3 IIFL 6.40%
BEST IN SALES TRADING
Rank Firm %
1 CLSA 16.74%
2 Citi 8.23%
3 IIFL 6.68%
MOST IMPROVED BROKERAGE OVER THE LAST 12 MONTHS
Rank Firm %
1 Religare 9.08%
2 Ambit Capital 6.58%
3 UBS 6.20%
BEST FOR EVENTS AND/OR CONFERENCES
Rank Firm %
1 CLSA 15.37%
2 Motilal Oswal 14.26%
3 Morgan Stanley 7.20%
BEST FOR ROADSHOWS AND COMPANY VISITS
Rank Firm %
1 CLSA 9.06%
2 Enam 8.03%
3 Morgan Stanley 6.14%
MOST INDEPENDENT RESEARCH BROKERAGE
Rank Firm %
1 CLSA 34.73%
2 Kotak 10.97%
3 Edelweiss 5.43%
INDIA
asiamoney.com 9
BEST LOCAL BROKERAGE
Rank Firm %
1 Mandiri 45.06%
2 Danareksa 27.04%
3 Bahana 19.76%
BEST FOR OVERALL COUNTRY RESEARCH
Rank Firm %
1 Deutsche Bank 19.40%
2 CLSA 17.39%
3 UBS 12.46%
BEST ANALYST
Rank Name Firm %
1 Heriyanto Irawan Deutsche Bank 11.19%
2 Erwan Teguh CIMB 10.42%
3 Joshua Tanja UBS 5.95%
BEST RESEARCH COVERAGE
Sector Firm
Strategy Deutsche Bank
Macroeconomics UBS
Small caps CIMB
Automobiles & components Deutsche Bank
Banks Deutsche Bank
Food, beverages & tobacco Deutsche Bank
Materials Deutsche Bank
Telecommunication services Deutsche Bank
BEST OVERALL SALES SERVICES
Rank Firm %
1 CLSA 21.86%
2 CIMB 12.46%
3 Deutsche Bank 12.05%
BEST SALESPERSON
Rank Name Firm %
1 Wuddy Warsono CLSA 9.72%
2 Daniel Oen CLSA 8.89%
3 Eugene Chung CLSA 5.80%
BEST EXECUTION
Rank Firm %
1 CLSA 16.88%
2 CIMB 13.29%
3 Deutsche Bank 10.28%
BEST IN SALES TRADING
Rank Firm %
1 CLSA 21.95%
2 CIMB 13.50%
3 Deutsche Bank 11.72%
MOST IMPROVED BROKERAGE OVER THE LAST 12 MONTHS
Rank Firm %
1 CIMB 20.68%
2 Mandiri 12.97%
3 Citi 9.24%
BEST FOR EVENTS AND/OR CONFERENCES
Rank Firm %
1 Deutsche Bank 18.66%
2 CLSA 17.45%
3 UBS 16.65%
BEST FOR ROADSHOWS AND COMPANY VISITS
Rank Firm %
1 CLSA 16.51%
2 Deutsche Bank 14.57%
3 UBS 12.31%
MOST INDEPENDENT RESEARCH BROKERAGE
Rank Firm %
1 CLSA 31.65%
2 Deutsche Bank 17.01%
3 CIMB 10.93%
INDONESIA
10 NOVEMBER2011 ASIAMONEY
BEST LOCAL BROKERAGE
Rank Firm %
1 Nomura 47.19%
2 Daiwa 28.71%
3 Mizuho 15.40%
BEST FOR OVERALL COUNTRY RESEARCH
Rank Firm %
1 Nomura 25.31%
2 CLSA 8.23%
3 BoA - Merrill Lynch 8.06%
BEST ANALYST
Rank Name Firm %
1 Paul Wan CLSA 5.10%
2 Manabu Akizuki Nomura 3.95%
3 Chris Richter CLSA 2.68%
BEST RESEARCH COVERAGE
Sector Firm
Strategy Nomura
Macroeconomics Nomura
Small caps Nomura
Automobiles & components CLSA
Banks CLSA
Capital goods CLSA
Materials Nomura
Technology hardware & equipment Nomura
BEST OVERALL SALES SERVICES
Rank Firm %
1 Nomura 25.08%
2 Daiwa* 8.07%
3 CLSA 8.05%
BEST SALESPERSON
Rank Name Firm %
1 Koji Yoshida Nomura 6.55%
2 James O’Neile Nomura 3.68%
3 Sean Yeo Nomura 2.60%
BEST EXECUTION
Rank Firm %
1 Nomura 20.65%
2 UBS 8.65%
3 Daiwa* 6.91%
BEST IN SALES TRADING
Rank Firm %
1 Nomura 19.62%
2 Morgan Stanley 9.36%
3 UBS 8.17%
MOST IMPROVED BROKERAGE OVER THE LAST 12 MONTHS
Rank Firm %
1 Barclays Capital 13.73%
2 Nomura 12.56%
3 Credit Suisse 11.56%
BEST FOR EVENTS AND/OR CONFERENCES
Rank Firm %
1 Nomura 28.43%
2 CLSA 21.44%
3 BoA - Merrill Lynch 15.16%
BEST FOR ROADSHOWS AND COMPANY VISITS
Rank Firm %
1 Nomura 31.49%
2 CLSA 10.32%
3 Mizuho 9.15%
MOST INDEPENDENT RESEARCH BROKERAGE
Rank Firm %
1 CLSA 35.52%
2 MF Global 14.92%
3 Advanced Research Japan 9.45%
* Daiwa Institute of Research
JAPAN
asiamoney.com 11
BEST LOCAL BROKERAGE
Rank Firm %
1 Samsung 31.27%
2 Korea Investment & Securities 17.08%
3 Daewoo 14.33%
BEST FOR OVERALL COUNTRY RESEARCH
Rank Firm %
1 Samsung 16.60%
2 UBS 8.43%
3 Korea Investment & Securities 7.21%
BEST ANALYST
Rank Name Firm %
1 Young Chang UBS 4.36%
2 JungHoon Chang Samsung 4.01%
3 Chongkyu Juhn Samsung 3.23%
BEST RESEARCH COVERAGE
Sector Firm
Strategy Samsung
Macroeconomics Samsung
Small caps Samsung
Automobiles and components Samsung
Banks Samsung
Capital goods Samsung
Materials Samsung
Semiconductors and semiconductor equipment Korea Investment
& Securities
BEST OVERALL SALES SERVICES
Rank Firm %
1 Samsung 13.99%
2 UBS 9.59%
3 HSBC 7.46%
BEST SALESPERSON
Rank Name Firm %
1 John Lee HSBC 4.54%
2 Sung Choi HSBC 2.04%
3 DH Kim BoA - Merrill Lynch 2.01%
BEST EXECUTION
Rank Firm %
1 Samsung 15.26%
2 UBS 8.10%
3 Credit Suisse 6.35%
BEST IN SALES TRADING
Rank Firm %
1 Samsung 14.70%
2 UBS 8.62%
3 BoA - Merrill Lynch 6.88%
MOST IMPROVED BROKERAGE OVER THE LAST 12 MONTHS
Rank Firm %
1 Samsung 20.64%
2 Korea Investment & Securities 10.24%
3 HSBC 10.01%
BEST FOR EVENTS AND/OR CONFERENCES
Rank Firm %
1 Samsung 16.68%
2 UBS 13.81%
3 BoA - Merrill Lynch 12.69%
BEST FOR ROADSHOWS AND COMPANY VISITS
Rank Firm %
1 Samsung 16.34%
2 Korea Investment & Securities 9.36%
3 UBS 7.63%
MOST INDEPENDENT RESEARCH BROKERAGE
Rank Firm %
1 CLSA 26.83%
2 Samsung 14.50%
3 HSBC 7.41%
KOREA
12 NOVEMBER2011 ASIAMONEY
BEST LOCAL BROKERAGE
Rank Firm %
1 CIMB 44.89%
2 Maybank 23.02%
3 AmInvestment Bank 10.08%
BEST FOR OVERALL COUNTRY RESEARCH
Rank Firm %
1 CIMB 21.94%
2 Maybank 8.70%
3 Credit Suisse 8.28%
BEST ANALYST
Rank Name Firm %
1 Terence Wong CIMB 6.16%
2 Yeoh Yung Juen CIMB 4.87%
3 Clare Chin CLSA 4.07%
BEST RESEARCH COVERAGE
Sector Firm
Strategy CIMB
Macroeconomics RHB
Small caps OSK DMG
Banks CIMB
Capital goods CIMB
Food, beverage and tobacco CIMB
Telecommunication services CIMB
Consumer service CIMB
BEST OVERALL SALES SERVICES
Rank Firm %
1 CIMB 21.82%
2 Maybank 12.70%
3 CLSA 8.10%
BEST SALESPERSON
Rank Name Firm %
1 May Lee UBS 5.33%
2 Ai Vye Chin J.P. Morgan 5.23%
3 Kit Lim CLSA 4.82%
BEST EXECUTION
Rank Firm %
1 CIMB 20.80%
2 Maybank 11.98%
3 Credit Suisse 7.32%
BEST IN SALES TRADING
Rank Firm %
1 CIMB 22.14%
2 Maybank 15.42%
3 Credit Suisse 7.52%
MOST IMPROVED BROKERAGE OVER THE LAST 12 MONTHS
Rank Firm %
1 Maybank 14.36%
2 Nomura 13.75%
3 AmInvestment Bank 11.44%
BEST FOR EVENTS AND/OR CONFERENCES
Rank Firm %
1 CIMB 23.59%
2 Maybank 18.65%
3 CLSA 7.28%
BEST FOR ROADSHOWS AND COMPANY VISITS
Rank Firm %
1 CIMB 20.11%
2 Maybank 18.30%
3 CLSA 8.02%
MOST INDEPENDENT RESEARCH BROKERAGE
Rank Firm %
1 CLSA 16.15%
2 OSK DMG 10.43%
3 Nomura 8.17%
MALAYSIA
asiamoney.com 13
BEST LOCAL BROKERAGE
Rank Firm %
1 Topline 47.98%
2 Foundation 22.67%
3 JS Global Capital 17.57%
BEST FOR OVERALL COUNTRY RESEARCH
Rank Firm %
1 Topline 38.99%
2 KASB / BoA - Merrill Lynch 35.46%
3 AKD Securities 8.07%
BEST ANALYST
Rank Name Firm %
1 Imtiaz Gadar KASB / BoA - Merrill Lynch 89.57%
2 Farhan Mahmood Topline 3.91%
3 Mohammed Sohail Topline 2.61%
BEST RESEARCH COVERAGE
Sector Firm
Strategy KASB / BoA - Merrill Lynch
Macroeconomics KASB / BoA - Merrill Lynch
Small caps KASB / BoA - Merrill Lynch
Banks KASB / BoA - Merrill Lynch
Energy KASB / BoA - Merrill Lynch
Materials KASB / BoA - Merrill Lynch
Telecommunication services KASB / BoA - Merrill Lynch
Utilities KASB / BoA - Merrill Lynch
BEST OVERALL SALES SERVICES
Rank Firm %
1 KASB / BoA - Merrill Lynch 20.73%
2 HSBC 19.06%
3 Topline 18.35%
BEST SALESPERSON
Rank Name Firm %
1 Mohammed Sohail Topline 35.04%
2 Baryalay Arbab KASB / BoA - Merrill Lynch 32.87%
3 Imtiaz Gadar KASB / BoA - Merrill Lynch 23.62%
BEST EXECUTION
Rank Firm %
1 KASB / BoA - Merrill Lynch 29.58%
2 Topline 21.13%
3 HSBC 16.90%
BEST IN SALES TRADING
Rank Firm %
1 KASB / BoA - Merrill Lynch 28.13%
2 Topline 25.20%
3 Deutsche Bank 16.00%
MOST IMPROVED BROKERAGE OVER THE LAST 12 MONTHS
Rank Firm %
1 Topline 66.17%
2 Foundation 30.83%
3 KASB / BoA - Merrill Lynch 2.26%
BEST FOR EVENTS AND/OR CONFERENCES
Rank Firm %
1 Topline 43.64%
2 KASB / BoA - Merrill Lynch 42.07%
3 Auerbach Grayson 9.39%
BEST FOR ROADSHOWS AND COMPANY VISITS
Rank Firm %
1 KASB / BoA - Merrill Lynch 50.23%
2 Topline 32.16%
3 Auerbach Grayson 11.27%
MOST INDEPENDENT RESEARCH BROKERAGE
Rank Firm %
1 Topline 51.58%
2 Citi 42.11%
3 KASB / BoA - Merrill Lynch 5.26%
PAKISTAN
14 NOVEMBER2011 ASIAMONEY
BEST LOCAL BROKERAGE
Rank Firm %
1 Philippine Equity Partners 39.29%
2 ATR-Kim Eng 24.76%
3 SB Equities 14.36%
BEST FOR OVERALL COUNTRY RESEARCH
Rank Firm %
1 CLSA 30.41%
2 UBS 21.34%
3 Deutsche Bank 19.06%
BEST ANALYST
Rank Name Firm %
1 Jody Santiago UBS 26.19%
2 Alex Pomento Macquarie 11.07%
3 Leo Venezuela CLSA 6.99%
BEST RESEARCH COVERAGE
Sector Firm
Strategy CLSA
Macroeconomics UBS
Small caps CLSA
Banks CLSA
Capital goods CLSA
Real estate CLSA
Telecommunication services CLSA
Utilities CLSA
BEST OVERALL SALES SERVICES
Rank Firm %
1 CLSA 34.32%
2 Deutsche Bank 19.49%
3 UBS 18.03%
BEST SALESPERSON
Rank Name Firm %
1 Alex Dauz CLSA 18.70%
2 Robby Go UBS 17.35%
3 Mitze De Dios CLSA 11.29%
BEST EXECUTION
Rank Firm %
1 CLSA 29.27%
2 UBS 16.81%
3 Deutsche Bank 16.29%
BEST IN SALES TRADING
Rank Firm %
1 CLSA 27.12%
2 Deutsche Bank 18.98%
3 UBS 16.92%
MOST IMPROVED BROKERAGE OVER THE LAST 12 MONTHS
Rank Firm %
1 CLSA 16.96%
2 Citi 16.23%
3 Deutsche Bank 13.04%
BEST FOR EVENTS AND/OR CONFERENCES
Rank Firm %
1 CLSA 33.14%
2 UBS 23.06%
3 Deutsche Bank 16.31%
BEST FOR ROADSHOWS AND COMPANY VISITS
Rank Firm %
1 CLSA 25.52%
2 UBS 22.74%
3 Deutsche Bank 17.64%
MOST INDEPENDENT RESEARCH BROKERAGE
Rank Firm %
1 CLSA 39.55%
2 Philippine Equity Partners 19.24%
3 Deutsche Bank 18.53%
THE PHILIPPINES
asiamoney.com 15
BEST LOCAL BROKERAGE
Rank Firm %
1 DBS Vickers 50.08%
2 UOB Kay Hian 19.99%
3 Kim Eng 19.13%
BEST FOR OVERALL COUNTRY RESEARCH
Rank Firm %
1 UBS 18.84%
2 DBS Vickers 13.35%
3 J.P. Morgan 9.15%
BEST ANALYST
Rank Name Firm %
1 Min Lan Tan UBS 11.37%
2 Chris Gee J.P. Morgan 4.45%
3 Terence Wong OSK DMG 4.32%
BEST RESEARCH COVERAGE
Sector Firm
Strategy UBS
Macroeconomics UBS
Small caps DBS Vickers
Banks Citi
Capital goods BoA - Merrill Lynch
Real estate UBS
Telecommunication services Nomura
Transportation DBS Vickers
BEST OVERALL SALES SERVICES
Rank Firm %
1 DBS Vickers 13.95%
2 UBS 10.97%
3 CLSA 7.85%
BEST SALESPERSON
Rank Name Firm %
1 Gaurang Bhatia UBS 4.49%
2 Michael Balbirnie UBS 4.26%
3 Ann Lim CLSA 4.10%
BEST EXECUTION
Rank Firm %
1 UBS 10.97%
2 DBS Vickers 9.51%
3 CLSA 8.76%
BEST IN SALES TRADING
Rank Firm %
1 CLSA 10.32%
2 UBS 9.67%
3 DBS Vickers 9.12%
MOST IMPROVED BROKERAGE OVER THE LAST 12 MONTHS
Rank Firm %
1 DBS Vickers 13.15%
2 Standard Chartered 12.56%
3 BoA - Merrill Lynch 12.26%
BEST FOR EVENTS AND/OR CONFERENCES
Rank Firm %
1 DBS Vickers 13.61%
2 CLSA 11.98%
3 Deutsche Bank 10.73%
BEST FOR ROADSHOWS AND COMPANY VISITS
Rank Firm %
1 DBS Vickers 16.18%
2 UBS 9.11%
3 J.P. Morgan 8.52%
MOST INDEPENDENT RESEARCH BROKERAGE
Rank Firm %
1 CLSA 30.42%
2 BoA - Merrill Lynch 9.31%
3 OSK DMG 6.96%
SINGAPORE
16 NOVEMBER2011 ASIAMONEY
BEST LOCAL BROKERAGE
Rank Firm %
1 Yuanta 43.65%
2 KGI 19.93%
3 Fubon 14.16%
BEST FOR OVERALL COUNTRY RESEARCH
Rank Firm %
1 UBS 13.04%
2 Yuanta 12.42%
3 Macquarie 9.63%
BEST ANALYST
Rank Name Firm %
1 William Dong UBS 7.30%
2 Jonah Cheng UBS 4.30%
3 Henry King Goldman Sachs 3.60%
BEST RESEARCH COVERAGE
Sector Firm
Strategy UBS
Macroeconomics UBS
Small caps Macquarie
Banks BoA - Merrill Lynch
Materials Yuanta
Semiconductors & semiconductor equipment UBS
Technology hardware & equipment Goldman Sachs
Telecommunication services UBS
BEST OVERALL SALES SERVICES
Rank Firm %
1 UBS 11.44%
2 Yuanta 11.27%
3 Macquarie 9.16%
BEST SALESPERSON
Rank Name Firm %
1 Julie Tsai UBS 6.08%
2 Peili Wang HSBC 3.48%
3 Ted Lo UBS 3.05%
BEST EXECUTION
Rank Firm %
1 UBS 10.38%
2 Yuanta 10.16%
3 Macquarie 7.85%
BEST IN SALES TRADING
Rank Firm %
1 UBS 11.88%
2 Yuanta 9.44%
3 HSBC 8.76%
MOST IMPROVED BROKERAGE OVER THE LAST 12 MONTHS
Rank Firm %
1 Yuanta 11.64%
2 HSBC 11.56%
3 UBS 8.99%
BEST FOR EVENTS AND/OR CONFERENCES
Rank Firm %
1 UBS 16.21%
2 BoA - Merrill Lynch 11.48%
3 Yuanta 8.28%
BEST FOR ROADSHOWS AND COMPANY VISITS
Rank Firm %
1 Yuanta 11.45%
2 UBS 10.62%
3 Macquarie 8.45%
MOST INDEPENDENT RESEARCH BROKERAGE
Rank Firm %
1 CLSA 16.62%
2 Yuanta 16.00%
3 KGI 9.67%
TAIWAN
asiamoney.com 17
BEST LOCAL BROKERAGE
Rank Firm %
1 Phatra 36.10%
2 Thanachart 24.91%
3 TISCO 12.57%
BEST FOR OVERALL COUNTRY RESEARCH
Rank Firm %
1 CLSA 15.80%
2 UBS 12.96%
3 Credit Suisse 12.42%
BEST ANALYST
Rank Name Firm %
1 Dan Fineman Credit Suisse 9.68%
2 Tim Taylor CLSA 8.10%
3 Ian Gisbourne UBS 6.89%
BEST RESEARCH COVERAGE
Sector Firm
Strategy Credit Suisse
Macroeconomics UBS
Small caps Thanachart
Banks CLSA
Energy UBS
Food & staples retailing Thanachart
Materials Credit Suisse
Telecommunication services CIMB
BEST OVERALL SALES SERVICES
Rank Firm %
1 UBS 15.75%
2 CLSA 14.84%
3 Credit Suisse 10.04%
BEST SALESPERSON
Rank Name Firm %
1 Munmun Taveeratanasilp CLSA 9.09%
2 Jamie Woodward UBS 7.31%
3 Pat Pattaphongse UBS 7.05%
BEST EXECUTION
Rank Firm %
1 UBS 16.03%
2 CLSA 15.19%
3 Credit Suisse 9.40%
BEST IN SALES TRADING
Rank Firm %
1 UBS 18.39%
2 CLSA 14.49%
3 Credit Suisse 10.66%
MOST IMPROVED BROKERAGE OVER THE LAST 12 MONTHS
Rank Firm %
1 Thanachart 17.22%
2 Credit Suisse 16.95%
3 CIMB 10.44%
BEST FOR EVENTS AND/OR CONFERENCES
Rank Firm %
1 CLSA 23.48%
2 Credit Suisse 11.52%
3 Phatra 10.70%
BEST FOR ROADSHOWS AND COMPANY VISITS
Rank Firm %
1 CLSA 16.32%
2 Thanachart 11.04%
3 UBS 10.35%
MOST INDEPENDENT RESEARCH BROKERAGE
Rank Firm %
1 CLSA 27.84%
2 Thanachart 14.33%
3 DBS Vickers 6.71%
THAILAND
18 NOVEMBER2011 ASIAMONEY
BEST LOCAL BROKERAGE
Rank Firm %
1 Ho Chi Minh City Securities 36.46%
2 Saigon Securities 23.96%
3 ACB Securities 21.35%
BEST FOR OVERALL COUNTRY RESEARCH
Rank Firm %
1 J.P. Morgan 41.50%
2 RBS 40.82%
3 HSBC 5.10%
BEST ANALYST
Rank Name Firm %
1 Fiachra Mac Cana Ho Chi Minh City Securities 51.36%
2 David Kadarauch Mekong Securities 14.01%
3 Truong Thu My Ho Chi Minh City Securities 12.45%
BEST RESEARCH COVERAGE
Sector Firm
Strategy Ho Chi Minh City Securities
Macroeconomics ACB Securities
Small caps Ho Chi Minh City Securities
Banks ACB Securities
Energy Ho Chi Minh City Securities
Food & staples retailing Ho Chi Minh City Securities
Materials ACB Securities
Tach hardware & equipment Ho Chi Minh City Securities
BEST OVERALL SALES SERVICES
Rank Firm %
1 ACB Securities 16.67%
2 Ho Chi Minh City Securities 16.60%
3 J.P. Morgan 14.46%
BEST SALESPERSON
Rank Name Firm %
1 Attila Vajda ACB Securities 37.79%
2 Michel Tosto Viet Capital Securities 16.33%
3 Sriyan Pietersz J.P. Morgan 14.93%
BEST EXECUTION
Rank Firm %
1 ACB Securities 33.03%
2 Ho Chi Minh City Securities 29.88%
3 HSBC 10.48%
BEST IN SALES TRADING
Rank Firm %
1 Ho Chi Minh City Securities 34.29%
2 ACB Securities 26.24%
3 Saigon Securities 10.05%
MOST IMPROVED BROKERAGE OVER THE LAST 12 MONTHS
Rank Firm %
1 ACB Securities 53.27%
2 CLSA 37.38%
3 Sacombank Securities 5.61%
BEST FOR EVENTS AND/OR CONFERENCES
Rank Firm %
1 ACB Securities 43.19%
2 Ho Chi Minh City Securities 16.60%
3 Sacombank Securities 15.11%
BEST FOR ROADSHOWS AND COMPANY VISITS
Rank Firm %
1 ACB Securities 45.62%
2 Ho Chi Minh City Securities 28.09%
3 Saigon Securities 16.24%
MOST INDEPENDENT RESEARCH BROKERAGE
Rank Firm %
1 ACB Securities 53.77%
2 Ho Chi Minh City Securities 37.74%
3 Sacombank Securities 2.83%
VIETNAM
asiamoney.com 19
METHODOLOGY
• Least independent research brokerage
Hedge Fund section – asked hedge funds their views on various categories relating to
hedge fund services and prime broking. Please refer to the results of the Prime Broking &
Hedge Fund Services Poll published in the October issue of Asiamoney.
Country sections
• Most improved brokerage, across both research & sales, over the last 12 months
• Best local brokerage
Equity Sales
• Best overall sales service
• Best sales people
• Best brokerage for sales trading
• Best execution
Corporate Access
• Best for events and/or conferences
• Best for roadshows and company visits
Equity Research
• Best overall country research
• Best country analysts
• Best research coverage for strategy, macroeconomics, small caps and each of the 5
highest-weighted industries* in that market
* Industries selected according to the relevant MSCI indices as of 31 May 2011.
• Most independent research brokerage
Calculation of Results
Points for Place
For all categories, a first place vote was awarded three points; second place two points and
third place one point.
“One Firm – One Vote”
To avoid any one institution having more influence than others of equal size, multiple
responses were fractioned according to the total number received from that one institution.
Asset Size Weightings
Each response was then weighted according to the institution’s approximate asset size
(total unleveraged Asian equity funds under management) in Asia-Pacific (ex-Australia &
Japan), in Australia or in Japan (depending upon the institution’s allocation of funds). The
table below details weightings according to asset size (hedge fund firms have been weight-
ed at six times their assets to reflect their higher turnover rate):
Asset size (US$million) No. of institutions Multiplied by
<50 366 0.5
50-200 437 1
201-500 309 4
501-2,000 471 8
2,001-5,000 281 12
5,001-10,000 225 16
>10,000 280 20
2,369
Rankings for Overall Combined Regional Research & Sales, Overall Regional Research &
Overall Regional Sales
For the Asia (ex-Australia & Japan) rankings a country weighting system was used to com-
pare brokerages as a whole in the region. The rationale is that the importance of markets
varies across the region, so the points a brokerage receives in major markets should be
weighted more than the points it receives in smaller markets. The MSCI AC Asia ex-Japan
(as of 31 May 2011) was used to achieve this. A similar sector weighting system was used
to address the importance of the sectors within the region. Please refer to the following
tables for a mathematical breakdown:
Asiamoney’s 22nd annual Brokers Poll invited chief investment officers, senior fund
managers and senior investment analysts at fund management houses, hedge fund &
private equity firms, insurance companies and wealth management houses in Asia-
Pacific, Europe and North America. A total of 4,431 valid individual responses from
approximately 2,300 different institutions, including 481 hedge funds, were received.
During the auditing process Asiamoney further verified responses by speaking directly
to respondents; 323 individual responses were made void either because they failed to
fulfill the auditing requirements. The geographical breakdown of the final 2,369 institu-
tions is as follows:
The questionnaire incorporates 16 different sections as follows:
Regional China Indonesia Malaysia Singapore
Hedge Fund Hong Kong Japan Pakistan Taiwan
Australia India Korea The Philippines Thailand
Vietnam
The questionnaire includes the following sections and categories:
Regional (Asia ex-Australia & Japan) section
• Most improved brokerage, across both research & sales, over the last 12 months.
Regional Equity Sales
• Best regional brokerages for sales services
• Best regional sales people
• Best regional sales traders
• Best regional brokerages for execution
Regional Equity Research
The 12 industries covered are those given the highest weighting in the MSCI Asia ex-Japan
index as of 31 May 2011 – please refer to the GICS map for industry definitions.
• Strategist
• Economist
• Quantitative/technical analyst
• Banks analyst
• Conglomerates analyst
• Consumer discretionary analyst
• Consumer staples analyst
• Energy analyst
• Insurance analyst
• Materials analyst
• Real estate analyst
• Semiconductors & semiconductor equipment analyst
• Technology hardware & equipment analyst
• Telecommunication services analyst
• Utilities analyst
• Most independent research brokerage
Australia 1.55%
China 29.24%
Thailand 0.86%
Taiwan 5.37%
Hong Kong 23.48%
India 6.92%
Indonesia 1.14%
Japan 1.18%
Europe 3.69%
Malaysia 4.62%
Korea 4.69%
North America 6.85%
Others 0.71%
Philippines 0.32%
Singapore 9.4%
20 NOVEMBER2011 ASIAMONEY
METHODOLOGY CONT.
Weightings for the Asia (ex-Australia & Japan) overall research rankings
Regional (Total) 30.00% Multiplied by
- Strategy 3.00% 0.48
- Economics 2.00% 0.32
- Quantitative 1.00% 0.16
- Banks 4.92% 0.79
- Conglomerates 0.92% 0.15
- Consumer Discretionary 2.56% 0.41
- Consumer Staples 1.29% 0.21
- Energy 2.34% 0.37
- Insurance 1.09% 0.17
- Materials 2.42% 0.39
- Real Estate 1.90% 0.30
- Semiconductors & Semiconductor Equipment 2.33% 0.37
- Technology Hardware & Equipment 1.69% 0.27
- Telecommunication Services 1.58% 0.25
- Utilities 0.95% 0.15
Country (Total) 70.00% Multiplied by
- China 17.23% 2.76
- Hong Kong 7.85% 1.26
- India 6.81% 1.09
- Indonesia 2.46% 0.39
- Korea 14.40% 2.30
- Malaysia 2.85% 0.46
- Philippines 0.54% 0.09
- Singapore 4.89% 0.78
- Taiwan 11.28% 1.81
- Thailand 1.69% 0.27
Total 100.00%
Weightings for the Asia (ex-Australia & Japan) overall sales rankings
Regional 30.00% Multiplied by
- Overall sales services 30.00% 4.80
Country (Total) 70.00% Multiplied by
- China 17.23% 2.76
- Hong Kong 7.85% 1.26
- India 6.81% 1.09
- Indonesia 2.46% 0.39
- Korea 14.40% 2.30
- Malaysia 2.85% 0.46
- Philippines 0.54% 0.09
- Singapore 4.89% 0.78
- Taiwan 11.28% 1.81
- Thailand 1.69% 0.27
Total 100.00%
For the Australia and Japan overall combined research & sales rankings, the votes from the categories of best overall country research and best overall sales service for each market
were simply added together.
Asiamoney would like to thank those who helped design the questionnaire, as well as all respondents for taking the time to complete and return it. The detailed results can also be
viewed on our website, www.asiamoney.com and full results will be published in the 2011 Brokers Poll Full Report, available from 1 December 2011.
asiamoney.com 21
INDUSTRY GROUP (SELECTED) INDUSTRY
Automobiles & Components - auto components - automobiles
Banks - commercial banks - thrifts & mortgage finance
Capital Goods - aerospace & defense - building products
- construction & engineering - electrical equipment
- industrial conglomerates - machinery
- trading companies & distributors
Commercial Services & Supplies - commercial services & supplies - professional services
Conglomerates 1
- industrial conglomerates
Consumer Durables & Apparel - household durables - leisure equipment & products
- textiles, apparel & luxury goods
Consumer Services - hotels, restaurants & leisure - diversified consumer services
Diversified Financials - diversified financial services - consumer finance
- capital markets
Energy - energy equipment & services - oil, gas & consumable fuels
Food & Staples Retailing - food & staples retailing
Food, Beverage & Tobacco - beverages - food products
- tobacco
Health Care Equipment & Services - health care equipment & supplies - health providers & services
- health care technology
Household & Personal Products - household products - personal products
Insurance - insurance
Materials - chemicals - construction materials
- containers & packaging - metals & mining
- paper & forest products
Media - media
Pharmaceuticals, Biotechnology & Life Sciences - biotechnology - pharmaceuticals
- life science tools & services
Real Estate - real estate investment trusts (REITs) - real estate management & development
Retailing - distributors - internet & catalogue retail
- multiline retail - specialty retail
Semiconductors & Semiconductor Equipment - semiconductors - semiconductor equipment
Software & Services - internet software & services - IT services
- software
Technology Hardware & Equipment - communications equipment - computers & peripherals
- office electronics - electronic equipment & instruments
- electronic components
Telecommunication Services - diversified telecommunication services - wireless telecommunication services
Transportation - air freight & logistics - airlines
- marines - road & rail
- transportation infrastructure
Utilities - electric utilities - gas utilities
- multi-utilities - water utilities
- independent power producers & energy traders
1
Conglomerates refers to the Industry Industrial Conglomerates. It has been selected as a regional sector to replace Capital Goods to better reflect the industry sectors covered by brokers within the region.
Disclaimer
This information is the property of Morgan Stanley Capital International Inc. (MSCI). It is provided for informational purposes only, and is not a recommendation to participate in any
particular trading strategy. The information may not be used to verify or correct data, or any compilation of data or index or in the creation of any indices. Nor may it be used in the creating,
writing, offering, trading, marketing or promotion of any financial instruments or products. This information is provided on an “as is” basis. Although MSCI shall obtain information from
sources which MSCI considers reliable, neither MSCI, its affiliates nor any other party involved in the making or compiling of the information guarantees the accuracy and/or the
completeness of any of this information. Neither MSCI, its affiliates nor any other party involved in the making or compiling of the information makes any representation or warranty, express
or implied, as to the results to be obtained by any person or entity from any use of this information, and the user of this information assumes the entire risk of any use made of this information.
Neither MSCI, its affiliates nor any other party involved in the making or compiling of the information makes any express or implied warranties, and MSCI, its affiliates and any other party
involved in the making or compiling of the information hereby expressly disclaim all warranties of merchantability or fitness for a particular purpose with respect to any of this information.
Without limiting any of the foregoing, in no event shall MSCI, its affiliates or any other party involved in the making or compiling of the information have any liability for any direct, indirect,
special, punitive, consequential or any other damages (including lost profits) even if notified of the possibility of such damages. Morgan Stanley Capital International, MSCI and all other
service marks referred to herein are the exclusive property of MSCI and its affiliates. All MSCI indices are the exclusive property of MSCI and may not be used in any way without the express
written permission of MSCI. MSCI is a leading provider of global indices and benchmark related products and services to investors worldwide. Morgan Stanley, a global financial services firm
and a market leader in securities, asset management, and credit services, is the majority shareholder of MSCI, and The Capital Group Companies, Inc., a global investment management
group, is the minority shareholder.
GLOBAL INDUSTRY CLASSIFICATION STANDARD (GICS)SM
FOR ENQUIRES, PLEASE CALL MSCI 24 HR CLIENT SERVICE ON (852) 2848 6740

More Related Content

What's hot

Dr. Debi LaPlante
Dr. Debi LaPlante   Dr. Debi LaPlante
Dr. Debi LaPlante Horizons RG
 
Judith Glynn and Richard Lennon: Integration of Responsible Advertising Stand...
Judith Glynn and Richard Lennon: Integration of Responsible Advertising Stand...Judith Glynn and Richard Lennon: Integration of Responsible Advertising Stand...
Judith Glynn and Richard Lennon: Integration of Responsible Advertising Stand...Horizons RG
 
Dr. Tilman Lesch
Dr. Tilman LeschDr. Tilman Lesch
Dr. Tilman LeschHorizons RG
 
Closing the trust gap: Responsible Business Series
Closing the trust gap: Responsible Business SeriesClosing the trust gap: Responsible Business Series
Closing the trust gap: Responsible Business SeriesJill Riseley
 
2017 Edelman Trust Barometer Special Report: Institutional Investors
2017 Edelman Trust Barometer Special Report: Institutional Investors2017 Edelman Trust Barometer Special Report: Institutional Investors
2017 Edelman Trust Barometer Special Report: Institutional InvestorsEdelman
 
Amanda Ward. Host Responsibility at SKYCITY Auckland
Amanda Ward. Host Responsibility at SKYCITY AucklandAmanda Ward. Host Responsibility at SKYCITY Auckland
Amanda Ward. Host Responsibility at SKYCITY AucklandHorizons RG
 
Dr. Jeffrey L. Derevensky
Dr. Jeffrey L. Derevensky Dr. Jeffrey L. Derevensky
Dr. Jeffrey L. Derevensky Horizons RG
 
Jeff French: How to Design and Deliver Social Programs that Influence Behaviour
Jeff French: How to Design and Deliver Social Programs that Influence Behaviour Jeff French: How to Design and Deliver Social Programs that Influence Behaviour
Jeff French: How to Design and Deliver Social Programs that Influence Behaviour Horizons RG
 
Don Feeney: Gambling and the Millennial Generation
Don Feeney: Gambling and the Millennial GenerationDon Feeney: Gambling and the Millennial Generation
Don Feeney: Gambling and the Millennial GenerationHorizons RG
 
2017 Veterans Well-Being Survey
2017 Veterans Well-Being Survey2017 Veterans Well-Being Survey
2017 Veterans Well-Being SurveyEdelman
 
Panel: Making responsible gambling work within the industry
Panel: Making responsible gambling work within the industry Panel: Making responsible gambling work within the industry
Panel: Making responsible gambling work within the industry Horizons RG
 
2010 Edelman Trust Barometer - Indonesia
2010 Edelman Trust Barometer - Indonesia2010 Edelman Trust Barometer - Indonesia
2010 Edelman Trust Barometer - IndonesiaEdelman Digital
 
Thomas Nilsson - Treatment Online, Does it work?
Thomas Nilsson - Treatment Online, Does it work?Thomas Nilsson - Treatment Online, Does it work?
Thomas Nilsson - Treatment Online, Does it work?Horizons RG
 
Dr. Mark Griffiths: Social Responsibility in Gambling, Marketing and Advertising
Dr. Mark Griffiths: Social Responsibility in Gambling, Marketing and AdvertisingDr. Mark Griffiths: Social Responsibility in Gambling, Marketing and Advertising
Dr. Mark Griffiths: Social Responsibility in Gambling, Marketing and AdvertisingHorizons RG
 
Dr. Robert Ladouceur - Self-Exclusion and the Court
Dr. Robert Ladouceur - Self-Exclusion and the CourtDr. Robert Ladouceur - Self-Exclusion and the Court
Dr. Robert Ladouceur - Self-Exclusion and the CourtHorizons RG
 
Sally Gainsbury and Keith Whyte. The Next Horizon: Social Casino Games and Re...
Sally Gainsbury and Keith Whyte. The Next Horizon: Social Casino Games and Re...Sally Gainsbury and Keith Whyte. The Next Horizon: Social Casino Games and Re...
Sally Gainsbury and Keith Whyte. The Next Horizon: Social Casino Games and Re...Horizons RG
 

What's hot (20)

Dr. Debi LaPlante
Dr. Debi LaPlante   Dr. Debi LaPlante
Dr. Debi LaPlante
 
Judith Glynn and Richard Lennon: Integration of Responsible Advertising Stand...
Judith Glynn and Richard Lennon: Integration of Responsible Advertising Stand...Judith Glynn and Richard Lennon: Integration of Responsible Advertising Stand...
Judith Glynn and Richard Lennon: Integration of Responsible Advertising Stand...
 
Dr. Tilman Lesch
Dr. Tilman LeschDr. Tilman Lesch
Dr. Tilman Lesch
 
Closing the trust gap: Responsible Business Series
Closing the trust gap: Responsible Business SeriesClosing the trust gap: Responsible Business Series
Closing the trust gap: Responsible Business Series
 
2017 Edelman Trust Barometer Special Report: Institutional Investors
2017 Edelman Trust Barometer Special Report: Institutional Investors2017 Edelman Trust Barometer Special Report: Institutional Investors
2017 Edelman Trust Barometer Special Report: Institutional Investors
 
Amanda Ward. Host Responsibility at SKYCITY Auckland
Amanda Ward. Host Responsibility at SKYCITY AucklandAmanda Ward. Host Responsibility at SKYCITY Auckland
Amanda Ward. Host Responsibility at SKYCITY Auckland
 
Dr. Jeffrey L. Derevensky
Dr. Jeffrey L. Derevensky Dr. Jeffrey L. Derevensky
Dr. Jeffrey L. Derevensky
 
Eye glass market in Vietnam
Eye glass market in VietnamEye glass market in Vietnam
Eye glass market in Vietnam
 
Jeff French: How to Design and Deliver Social Programs that Influence Behaviour
Jeff French: How to Design and Deliver Social Programs that Influence Behaviour Jeff French: How to Design and Deliver Social Programs that Influence Behaviour
Jeff French: How to Design and Deliver Social Programs that Influence Behaviour
 
Don Feeney: Gambling and the Millennial Generation
Don Feeney: Gambling and the Millennial GenerationDon Feeney: Gambling and the Millennial Generation
Don Feeney: Gambling and the Millennial Generation
 
2017 Veterans Well-Being Survey
2017 Veterans Well-Being Survey2017 Veterans Well-Being Survey
2017 Veterans Well-Being Survey
 
Panel: Making responsible gambling work within the industry
Panel: Making responsible gambling work within the industry Panel: Making responsible gambling work within the industry
Panel: Making responsible gambling work within the industry
 
2010 Edelman Trust Barometer - Indonesia
2010 Edelman Trust Barometer - Indonesia2010 Edelman Trust Barometer - Indonesia
2010 Edelman Trust Barometer - Indonesia
 
Thomas Nilsson - Treatment Online, Does it work?
Thomas Nilsson - Treatment Online, Does it work?Thomas Nilsson - Treatment Online, Does it work?
Thomas Nilsson - Treatment Online, Does it work?
 
Vietnamese Youth Dream Report_by Q&Me
Vietnamese Youth Dream Report_by Q&MeVietnamese Youth Dream Report_by Q&Me
Vietnamese Youth Dream Report_by Q&Me
 
Dr. Mark Griffiths: Social Responsibility in Gambling, Marketing and Advertising
Dr. Mark Griffiths: Social Responsibility in Gambling, Marketing and AdvertisingDr. Mark Griffiths: Social Responsibility in Gambling, Marketing and Advertising
Dr. Mark Griffiths: Social Responsibility in Gambling, Marketing and Advertising
 
Vietnamese saving
Vietnamese savingVietnamese saving
Vietnamese saving
 
Ryan Persaud
Ryan PersaudRyan Persaud
Ryan Persaud
 
Dr. Robert Ladouceur - Self-Exclusion and the Court
Dr. Robert Ladouceur - Self-Exclusion and the CourtDr. Robert Ladouceur - Self-Exclusion and the Court
Dr. Robert Ladouceur - Self-Exclusion and the Court
 
Sally Gainsbury and Keith Whyte. The Next Horizon: Social Casino Games and Re...
Sally Gainsbury and Keith Whyte. The Next Horizon: Social Casino Games and Re...Sally Gainsbury and Keith Whyte. The Next Horizon: Social Casino Games and Re...
Sally Gainsbury and Keith Whyte. The Next Horizon: Social Casino Games and Re...
 

Similar to Top Brokers for Asia Pacific Markets

Thesis Presentation: A Study on Non-Performing Loan: From the Perspective of ...
Thesis Presentation: A Study on Non-Performing Loan: From the Perspective of ...Thesis Presentation: A Study on Non-Performing Loan: From the Perspective of ...
Thesis Presentation: A Study on Non-Performing Loan: From the Perspective of ...MohiUddin49
 
Feds decision implications for CRE 15 2015 perspective and analysis
Feds decision implications for CRE 15 2015  perspective and analysisFeds decision implications for CRE 15 2015  perspective and analysis
Feds decision implications for CRE 15 2015 perspective and analysisMatthew Marshall
 
Vy Le_ J.P.Morgan Stock Valuation Project
Vy Le_ J.P.Morgan Stock Valuation ProjectVy Le_ J.P.Morgan Stock Valuation Project
Vy Le_ J.P.Morgan Stock Valuation ProjectVy Le
 
Julex Dynamic Alpha Strategies
Julex Dynamic Alpha StrategiesJulex Dynamic Alpha Strategies
Julex Dynamic Alpha StrategiesHenry Ma
 
6- What's Old is New: Fixed-Rate Bonds are Back in Style- Catherine Crews
6- What's Old is New: Fixed-Rate Bonds are Back in Style- Catherine Crews6- What's Old is New: Fixed-Rate Bonds are Back in Style- Catherine Crews
6- What's Old is New: Fixed-Rate Bonds are Back in Style- Catherine CrewsMassDevelopment
 
Moore Capital Summer 2014 China team presentation
Moore Capital Summer 2014 China team presentation Moore Capital Summer 2014 China team presentation
Moore Capital Summer 2014 China team presentation Thomas Fu
 
Linkedin_handout_web
Linkedin_handout_webLinkedin_handout_web
Linkedin_handout_webBo de Koning
 
02.05.2014, Investing in Excellence: Golomt Bank, MUNKHBAT Davaatseren
02.05.2014, Investing in Excellence: Golomt Bank, MUNKHBAT Davaatseren02.05.2014, Investing in Excellence: Golomt Bank, MUNKHBAT Davaatseren
02.05.2014, Investing in Excellence: Golomt Bank, MUNKHBAT DavaatserenThe Business Council of Mongolia
 
First Financial Bankshares Investor Presentation 2nd qtr 2014
First Financial Bankshares Investor Presentation 2nd qtr 2014First Financial Bankshares Investor Presentation 2nd qtr 2014
First Financial Bankshares Investor Presentation 2nd qtr 2014First Financial Bankshares, Inc.
 
Vy Le_Goldman Sachs Stock Valuatio Project
Vy Le_Goldman Sachs Stock Valuatio ProjectVy Le_Goldman Sachs Stock Valuatio Project
Vy Le_Goldman Sachs Stock Valuatio ProjectVy Le
 
Analysis of annual report of ab bank of 2016
Analysis of annual report of ab bank of 2016Analysis of annual report of ab bank of 2016
Analysis of annual report of ab bank of 2016Jabed Hossain
 
Financial analysis enel s.p.a. generates, transmits, distributes, and trade...
Financial analysis   enel s.p.a. generates, transmits, distributes, and trade...Financial analysis   enel s.p.a. generates, transmits, distributes, and trade...
Financial analysis enel s.p.a. generates, transmits, distributes, and trade...BCV
 

Similar to Top Brokers for Asia Pacific Markets (20)

Bloomberg Global M&A
Bloomberg Global M&ABloomberg Global M&A
Bloomberg Global M&A
 
Thesis Presentation: A Study on Non-Performing Loan: From the Perspective of ...
Thesis Presentation: A Study on Non-Performing Loan: From the Perspective of ...Thesis Presentation: A Study on Non-Performing Loan: From the Perspective of ...
Thesis Presentation: A Study on Non-Performing Loan: From the Perspective of ...
 
Lu Feng Chinas Outlook And Ccer Ceo
Lu Feng Chinas Outlook And Ccer CeoLu Feng Chinas Outlook And Ccer Ceo
Lu Feng Chinas Outlook And Ccer Ceo
 
Feds decision implications for CRE 15 2015 perspective and analysis
Feds decision implications for CRE 15 2015  perspective and analysisFeds decision implications for CRE 15 2015  perspective and analysis
Feds decision implications for CRE 15 2015 perspective and analysis
 
Vy Le_ J.P.Morgan Stock Valuation Project
Vy Le_ J.P.Morgan Stock Valuation ProjectVy Le_ J.P.Morgan Stock Valuation Project
Vy Le_ J.P.Morgan Stock Valuation Project
 
Julex Dynamic Alpha Strategies
Julex Dynamic Alpha StrategiesJulex Dynamic Alpha Strategies
Julex Dynamic Alpha Strategies
 
6- What's Old is New: Fixed-Rate Bonds are Back in Style- Catherine Crews
6- What's Old is New: Fixed-Rate Bonds are Back in Style- Catherine Crews6- What's Old is New: Fixed-Rate Bonds are Back in Style- Catherine Crews
6- What's Old is New: Fixed-Rate Bonds are Back in Style- Catherine Crews
 
Moore Capital Summer 2014 China team presentation
Moore Capital Summer 2014 China team presentation Moore Capital Summer 2014 China team presentation
Moore Capital Summer 2014 China team presentation
 
Linkedin_handout_web
Linkedin_handout_webLinkedin_handout_web
Linkedin_handout_web
 
First Financial Bankshares 1st qtr 2014 presentation
First Financial Bankshares 1st qtr 2014 presentationFirst Financial Bankshares 1st qtr 2014 presentation
First Financial Bankshares 1st qtr 2014 presentation
 
02.05.2014, Investing in Excellence: Golomt Bank, MUNKHBAT Davaatseren
02.05.2014, Investing in Excellence: Golomt Bank, MUNKHBAT Davaatseren02.05.2014, Investing in Excellence: Golomt Bank, MUNKHBAT Davaatseren
02.05.2014, Investing in Excellence: Golomt Bank, MUNKHBAT Davaatseren
 
First Financial Bankshares Investor Presentation 2nd qtr 2014
First Financial Bankshares Investor Presentation 2nd qtr 2014First Financial Bankshares Investor Presentation 2nd qtr 2014
First Financial Bankshares Investor Presentation 2nd qtr 2014
 
Vy Le_Goldman Sachs Stock Valuatio Project
Vy Le_Goldman Sachs Stock Valuatio ProjectVy Le_Goldman Sachs Stock Valuatio Project
Vy Le_Goldman Sachs Stock Valuatio Project
 
Daily retail report 090315
 Daily retail report 090315 Daily retail report 090315
Daily retail report 090315
 
4th Qtr. Investor Presentation
4th Qtr. Investor Presentation4th Qtr. Investor Presentation
4th Qtr. Investor Presentation
 
First financial bankshares presentation 2nd qtr 2013
First financial bankshares presentation 2nd qtr 2013First financial bankshares presentation 2nd qtr 2013
First financial bankshares presentation 2nd qtr 2013
 
Analysis of annual report of ab bank of 2016
Analysis of annual report of ab bank of 2016Analysis of annual report of ab bank of 2016
Analysis of annual report of ab bank of 2016
 
Susq1 q13pres
Susq1 q13presSusq1 q13pres
Susq1 q13pres
 
Financial analysis enel s.p.a. generates, transmits, distributes, and trade...
Financial analysis   enel s.p.a. generates, transmits, distributes, and trade...Financial analysis   enel s.p.a. generates, transmits, distributes, and trade...
Financial analysis enel s.p.a. generates, transmits, distributes, and trade...
 
First Financial Bankshares presentation 1st qtr 2013
First Financial Bankshares presentation 1st qtr 2013First Financial Bankshares presentation 1st qtr 2013
First Financial Bankshares presentation 1st qtr 2013
 

Top Brokers for Asia Pacific Markets

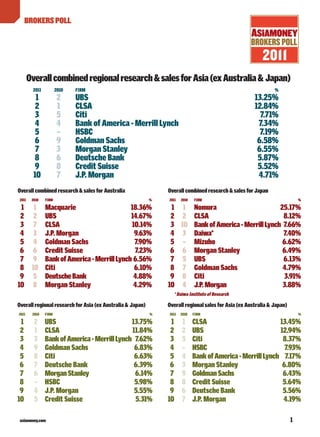
  • 1. asiamoney.com 1 2011 2010 FIRM % 1 2 UBS 13.25% 2 1 CLSA 12.84% 3 5 Citi 7.71% 4 4 Bank of America - Merrill Lynch 7.34% 5 – HSBC 7.19% 6 9 Goldman Sachs 6.58% 7 3 Morgan Stanley 6.55% 8 6 Deutsche Bank 5.87% 9 8 Credit Suisse 5.52% 10 7 J.P. Morgan 4.71% Overall combined research & sales for Australia 2011 2010 FIRM % 1 1 Macquarie 18.36% 2 2 UBS 14.67% 3 7 CLSA 10.14% 4 3 J.P. Morgan 9.63% 5 4 Goldman Sachs 7.90% 6 6 Credit Suisse 7.23% 7 9 BankofAmerica-MerrillLynch 6.56% 8 10 Citi 6.10% 9 5 DeutscheBank 4.88% 10 8 Morgan Stanley 4.29% Overall combined research & sales for Japan 2011 2010 FIRM % 1 1 Nomura 25.17% 2 2 CLSA 8.12% 3 10 BankofAmerica-MerrillLynch 7.66% 4 3 Daiwa* 7.40% 5 – Mizuho 6.62% 6 6 Morgan Stanley 6.49% 7 5 UBS 6.13% 8 7 Goldman Sachs 4.79% 9 8 Citi 3.91% 10 4 J.P.Morgan 3.88% * Daiwa Institute of Research Overall regional research for Asia (ex Australia & Japan) 2011 2010 FIRM % 1 2 UBS 13.75% 2 1 CLSA 11.84% 3 3 BankofAmerica-MerrillLynch 7.62% 4 9 Goldman Sachs 6.83% 5 8 Citi 6.63% 6 7 Deutsche Bank 6.39% 7 6 MorganStanley 6.14% 8 – HSBC 5.98% 9 4 J.P. Morgan 5.55% 10 5 Credit Suisse 5.31% Overall regional sales for Asia (ex Australia & Japan) 2011 2010 FIRM % 1 1 CLSA 13.45% 2 2 UBS 12.94% 3 5 Citi 8.37% 4 – HSBC 7.93% 5 4 BankofAmerica-MerrillLynch 7.17% 6 3 Morgan Stanley 6.80% 7 9 GoldmanSachs 6.43% 8 8 Credit Suisse 5.64% 9 6 Deutsche Bank 5.56% 10 7 J.P. Morgan 4.19% Overallcombinedregionalresearch&salesforAsia(exAustralia& Japan) BROKERSPOLL
  • 2. HEDGE FUND SERVICES BEST FOR OVERALL SERVICES TO HEDGE FUNDS 2011 2010 Firm % 1 1 UBS 11.04% 2 3 Morgan Stanley 10.05% 3 5 Goldman Sachs 9.62% 4 2 Deutsche Bank 8.87% 5 8 Bank of America - Merrill Lynch 8.01% 6 6 CLSA 7.86% 7 4 Credit Suisse 6.07% 8 – HSBC 5.06% 9 7 Citi 4.73% 10 – CICC 3.87% BEST FOR CLIENT SERVICE COVERAGE 2011 2010* Firm % 1 – Morgan Stanley 10.16% 2 – UBS 9.69% 3 – Goldman Sachs 9.12% 4 – Bank of America - Merrill Lynch 8.70% 5 – Deutsche Bank 7.55% BEST BESPOKE RESEARCH 2011 2010* Firm % 1 – CLSA 13.37% 2 – UBS 8.91% 3 – Morgan Stanley 8.58% 4 – Goldman Sachs 8.22% 5 – Deutsche Bank 6.79% BEST TRADING EXECUTION – CASH 2011 2010* Firm % 1 – UBS 12.58% 2 – Morgan Stanley 9.89% 3 – Deutsche Bank 9.10% 4 – Credit Suisse 8.38% 5 – Bank of America - Merrill Lynch 7.42% BEST TRADING EXECUTION – DERIVATIVES 2011 2010* Firm % 1 – UBS 14.40% 2 – Deutsche Bank 10.87% 3 – Goldman Sachs 10.09% 4 – Bank of America - Merrill Lynch 9.65% 5 – Morgan Stanley 9.34% BEST SALES PEOPLE SERVICING HEDGE FUNDS 2011 2010 Name Firm % 1 1 Andrew Reeves Deutsche Bank 1.97% 2 – Henry Wang Deutsche Bank 1.41% 3 – Arthur Chen Citi 1.33% 4 – Curtis Man UBS 1.22% 5 – Gordon Lu CICC 1.11% BEST SALES-TRADERS SERVICING HEDGE FUNDS 2011 2010 Name Firm % 1 – Andrew Reeves Deutsche Bank 1.97% 2 – Charles Pratt Credit Suisse 1.91% =3 1 Jerry Yoon RBS 1.46% =3 – Lo Lee UBS 1.46% 5 – Josie Fung Morgan Stanley 1.40% * Results not published in 2010 PRIME BROKING BEST FOR OVERALL SERVICES IN PRIME BROKING 2011 2010 Firm % 1 1 UBS 16.62% 2 3 Goldman Sachs 14.89% 3 4 Deutsche Bank 14.42% 4 2 Morgan Stanley 14.32% 5 6 Credit Suisse 7.89% 6 10 Bank of America - Merrill Lynch 6.57% 7 – Citi 3.84% 8 – HSBC 2.81% 9 – CICC 2.68% 10 5 J.P. Morgan 2.12% BEST PRODUCT INNOVATION FOR PRIME BROKING 2011 2010 Firm % 1 2 Morgan Stanley 16.52% 2 1 UBS 15.94% 3 4 Deutsche Bank 14.82% 4 3 Goldman Sachs 14.80% 5 5 Credit Suisse 9.20% BEST PRICING FOR PRIME BROKING 2011 2010 Firm % 1 1 UBS 17.58% 2 3 Deutsche Bank 13.69% 3 2 Morgan Stanley 13.05% 4 4 Goldman Sachs 10.53% 5 5 Credit Suisse 9.37% BEST RISK MANAGEMENT ADVISORY 2011 2010 Firm % 1 4 Goldman Sachs 19.43% 2 1 UBS 18.42% 3 3 Deutsche Bank 16.84% 4 2 Morgan Stanley 13.97% 5 5 Credit Suisse 7.11% BEST CLIENT SERVICE FOR PRIME BROKING 2011 2010 Firm % 1 2 Morgan Stanley 17.00% 2 1 UBS 16.48% 3 4 Goldman Sachs 16.02% 4 3 Deutsche Bank 14.87% 5 – Bank of America - Merrill Lynch 7.32% 2 NOVEMBER2011 ASIAMONEY
  • 3. asiamoney.com 3 REGIONAL (INDIVIDUAL)ASIA EX JAPAN BEST STRATEGIST Rank Name Firm % 1 Christopher Wood CLSA 16.21% 2 Jun Ma Deutsche Bank 10.61% 3 Sean Darby Nomura 7.69% BEST ECONOMIST Rank Name Firm % 1 Jun Ma Deutsche Bank 19.72% 2 Jonathan Anderson UBS 11.81% 3 Tao Wang UBS 6.95% BEST QUANTITATIVE / TECHNICAL ANALYST Rank Name Firm % 1 Laurence Balanco CLSA 12.91% 2 Shanle Wu UBS 6.93% 3 Steven Malin J.P. Morgan 6.70% BEST ANALYST FOR BANKS Rank Name Firm % 1 Ning Ma Goldman Sachs 27.85% 2 Lucy Feng Nomura 7.45% 3 Winnie Wu BoA - Merrill Lynch 3.75% BEST ANALYST FOR CONGLOMERATES Rank Name Firm % 1 Christie Ju Jefferies 44.69% 2 Julian Bu Jefferies 4.93% 3 Simon Cheung Goldman Sachs 4.66% BEST ANALYST FOR CONSUMER DISCRETIONARY Rank Name Firm % 1 Frank Li J.P. Morgan 21.84% 2 Xiaopo Wei CLSA 19.09% 3 Heather Hsu CLSA 4.85% BEST ANALYST FOR CONSUMER STAPLES Rank Name Firm % 1 Jessie Guo Jefferies 25.69% 2 Xiaopo Wei CLSA 15.53% 3 Heather Hsu CLSA 5.04% BEST ANALYST FOR ENERGY Rank Name Firm % 1 Laban Yu Jefferies 22.45% 2 Graham Cunningham Citi 12.96% 3 Thomas Wong BoA - Merrill Lynch 6.59% BEST ANALYST FOR INSURANCE Rank Name Firm % 1 Bob Leung UBS 26.01% 2 Ben Lin Morgan Stanley 16.13% 3 Karen Chan BoA - Merrill Lynch 13.60% BEST ANALYST FOR MATERIALS Rank Name Firm % 1 Trina Chen Credit Suisse 23.88% 2 Andrew Dale Macquarie 6.45% 3 Richard Leung CLSA 4.45% REGIONAL (TEAM)ASIA EX JAPAN BEST TEAM FOR STRATEGY Rank Firm % 1 CLSA 19.41% 2 UBS 15.29% 3 Deutsche Bank 13.15% BEST TEAM FOR ECONOMIC RESEARCH Rank Firm % 1 UBS 24.93% 2 Deutsche Bank 22.39% 3 CLSA 8.88% BEST TEAM FOR QUANTITATIVE / TECHNICAL ANALYSIS Rank Firm % 1 CLSA 17.46% 2 UBS 11.95% 3 J.P. Morgan 11.41% BEST TEAM FOR BANKS Rank Firm % 1 Goldman Sachs 30.76% 2 Nomura 8.21% 3 UBS 6.58% BEST TEAM FOR CONGLOMERATES Rank Firm % 1 Jefferies 55.39% 2 Goldman Sachs 6.56% 3 BoA - Merrill Lynch 4.52% BEST TEAM FOR CONSUMER DISCRETIONARY Rank Firm % 1 CLSA 27.99% 2 J.P. Morgan 24.16% 3 UBS 6.98% BEST TEAM FOR CONSUMER STAPLES Rank Firm % 1 Jefferies 26.14% 2 CLSA 22.83% 3 UBS 7.12% BEST TEAM FOR ENERGY Rank Firm % 1 Jefferies 22.45% 2 Citi 14.99% 3 UBS 14.52% BEST TEAM FOR INSURANCE Rank Firm % 1 UBS 26.66% 2 Morgan Stanley 16.58% 3 BoA - Merrill Lynch 15.03% BEST TEAM FOR MATERIALS Rank Firm % 1 Credit Suisse 25.22% 2 UBS 15.84% 3 Macquarie 10.09% BEST TEAM FOR REAL ESTATE Rank Firm % 1 Jefferies 41.48% 2 Citi 9.71% 3 UBS 5.83%
  • 4. 4 NOVEMBER2011 ASIAMONEY BEST ANALYST FOR REAL ESTATE Rank Name Firm % 1 Christie Ju Jefferies 41.32% 2 Oscar Choi Citi 8.22% 3 Tony Tsang Deutsche Bank 4.54% BEST ANALYST FOR SEMICONDUCTORS & SEMICONDUCTOR EQUIPMENT Rank Name Firm % 1 Jonah Cheng UBS 36.28% 2 Kirk Yang Barclays Capital 4.97% 3 Eric Chen Daiwa 4.03% BEST ANALYST FOR TECHNOLOGY HARDWARE & EQUIPMENT Rank Name Firm % 1 Jonah Cheng UBS 22.57% 2 Kirk Yang Barclays Capital 9.19% 3 Arthur Hsieh UBS 8.38% BEST ANALYST FOR TELECOMMUNICATION SERVICES Rank Name Firm % 1 Cynthia Meng Jefferies 31.74% 2 Jinjin Wang UBS 14.20% 3 Steven Zhang DBS Vickers 2.63% BEST ANALYST FOR UTILITIES Rank Name Firm % 1 Pierre Lau Citi 23.30% 2 Ivan Lee Nomura 14.57% 3 Dave Dai Daiwa 8.08% BEST REGIONAL SALESPERSON Rank Name Firm % 1 Peili Wang HSBC 2.08% 2 Ronald Cheung UBS 1.71% 3 Curtis Man UBS 1.64% BEST REGIONAL SALES TRADER Rank Name Firm % 1 Eric Fang UBS 5.20% 2 Kenyon Tse UBS 2.49% =3 Andrew Reeves Deutsche Bank 1.75% =3 John Chapman HSBC 1.75% REGIONAL (INDIVIDUAL) CONT. ASIA EX JAPAN REGIONAL (TEAM) CONT. ASIA EX JAPAN BEST TEAM FOR SEMICONDUCTORS & SEMICONDUCTOR EQUIPMENT Rank Firm % 1 UBS 40.39% 2 Barclays Capital 7.63% 3 Daiwa 6.18% BEST TEAM FOR TECHNOLOGY HARDWARE & EQUIPMENT Rank Firm % 1 UBS 35.16% 2 Barclays Capital 10.10% 3 Goldman Sachs 8.07% BEST TEAM FOR TELECOMMUNICATION SERVICES Rank Firm % 1 Jefferies 32.39% 2 UBS 16.77% 3 Goldman Sachs 5.14% BEST TEAM FOR UTILITIES Rank Firm % 1 Citi 23.73% 2 Nomura 14.91% 3 UBS 14.36% BEST TEAM FOR REGIONAL SALES Rank Firm % 1 UBS 17.33% 2 CLSA 12.16% 3 HSBC 10.99% BEST TEAM FOR REGIONAL SALES TRADING Rank Firm % 1 UBS 15.95% 2 HSBC 13.29% 3 CLSA 9.50% MOST IMPROVED BROKERAGE OVER THE LAST 12 MONTHS Rank Firm % 1 UBS 14.03% 2 HSBC 7.61% 3 Samsung 6.44% BEST OVERALL SALES SERVICES Rank Firm % 1 CLSA 15.84% 2 UBS 12.74% 3 HSBC 8.53% BEST REGIONAL BROKERAGE FOR EXECUTION Rank Firm % 1 UBS 13.80% 2 CLSA 11.35% 3 Deutsche Bank 10.25% MOST INDEPENDENT RESEARCH Rank Firm % 1 CLSA 30.19% 2 UBS 8.76% 3 HSBC 6.30% LEAST INDEPENDENT RESEARCH Rank Firm % 1 Goldman Sachs 37.98% 2 Morgan Stanley 11.26% 3 UBS 8.86%
  • 5. asiamoney.com 5 AUSTRALIA BEST LOCAL BROKERAGE Rank Firm % 1 Macquarie 55.40% 2 Bell Porter 6.79% 3 Patersons 6.15% BEST FOR OVERALL COUNTRY RESEARCH Rank Firm % 1 Macquarie 20.65% 2 UBS 16.18% 3 Goldman Sachs 11.57% BEST ANALYST Rank Name Firm % 1 Stuart Baker Morgan Stanley 7.18% 2 Neale Goldston-Morris Macquarie 4.54% 3 Lou Pirenc Morgan Stanley 4.06% BEST RESEARCH COVERAGE Sector Firm Strategy Macquarie Macroeconomics UBS Small caps Deutsche Bank Banks CLSA Energy Morgan Stanley Food & staples retailing BoA - Merrill Lynch Materials UBS Real Estate J.P. Morgan BEST OVERALL SALES SERVICES Rank Firm % 1 Macquarie 16.83% 2 UBS 13.66% 3 CLSA 10.61% BEST SALESPERSON Rank Name Firm % 1 Maureen Baker CLSA 7.75% 2 Gavan Carroll Credit Suisse 4.06% 3 Phil Montgomerie BoA - Merrill Lynch 2.61% BEST EXECUTION Rank Firm % 1 Macquarie 19.53% 2 UBS 15.99% 3 Citi 12.15% BEST IN SALES TRADING Rank Firm % 1 Macquarie 19.96% 2 UBS 17.06% 3 Citi 13.34% MOST IMPROVED BROKERAGE OVER THE LAST 12 MONTHS Rank Firm % 1 CLSA 18.44% 2 BoA - Merrill Lynch 13.72% 3 UBS 11.58% BEST FOR EVENTS AND/OR CONFERENCES Rank Firm % 1 Macquarie 29.31% 2 UBS 14.61% 3 BoA - Merrill Lynch 10.66% BEST FOR ROADSHOWS AND COMPANY VISITS Rank Firm % 1 UBS 19.95% 2 Macquarie 19.70% 3 J.P. Morgan 12.27% MOST INDEPENDENT RESEARCH BROKERAGE Rank Firm % 1 CLSA 32.67% 2 Morgan Stanley 10.46% 3 J.P. Morgan 8.99%
  • 6. 6 NOVEMBER2011 ASIAMONEY BEST LOCAL BROKERAGE Rank Firm % 1 CICC 41.86% 2 CITICS 18.33% 3 SWS 14.40% BEST FOR OVERALL COUNTRY RESEARCH Rank Firm % 1 CICC 19.82% 2 UBS 10.05% 3 SWS 7.15% BEST ANALYST Rank Name Firm % 1 Jun Ma Deutsche Bank 7.39% 2 Guo Hai Yan CICC 5.99% 3 Gao Zheng CICC 3.46% BEST RESEARCH COVERAGE Sector Firm Strategy UBS Macroeconomics Deutsche Bank Small caps SWS Banks CICC Energy CICC Insurance CICC Materials CICC Telecommunication services CICC BEST OVERALL SALES SERVICES Rank Firm % 1 CICC 17.19% 2 UBS 9.55% 3 CLSA 7.48% BEST SALESPERSON Rank Name Firm % 1 Arthur Chen Citi 6.25% 2 Jimmy Zhu Credit Suisse 3.99% 3 Henry Wang Deutsche Bank 2.63% BEST EXECUTION Rank Firm % 1 CICC 15.55% 2 UBS 13.38% 3 Morgan Stanley 6.61% BEST IN SALES TRADING Rank Firm % 1 CICC 16.21% 2 UBS 13.90% 3 Goldman Sachs 7.17% MOST IMPROVED BROKERAGE OVER THE LAST 12 MONTHS Rank Firm % 1 UBS 20.48% 2 CICC 9.34% 3 SWS 7.98% BEST FOR EVENTS AND/OR CONFERENCES Rank Firm % 1 UBS 14.58% 2 CLSA 14.17% 3 CICC 10.44% BEST FOR ROADSHOWS AND COMPANY VISITS Rank Firm % 1 CICC 13.62% 2 UBS 10.40% 3 CLSA 7.82% MOST INDEPENDENT RESEARCH BROKERAGE Rank Firm % 1 CLSA 23.51% 2 CICC 17.53% 3 SWS 10.65% CHINA
  • 7. asiamoney.com 7 BEST LOCAL BROKERAGE Rank Firm % 1 HSBC 36.25% 2 CCBI 21.88% 3 Standard Chartered 13.51% BEST FOR OVERALL COUNTRY RESEARCH Rank Firm % 1 CLSA 10.41% 2 Citi 8.58% 3 HSBC 8.18% BEST ANALYST Rank Name Firm % 1 Jim Tang SWS 3.10% 2 Oscar Choi Citi 2.34% 3 Guo Hai Yan CICC 2.30% BEST RESEARCH COVERAGE Sector Firm Strategy UBS Macroeconomics Deutsche Bank Small caps Citi Banks Goldman Sachs Capital goods SWS Insurance BoA - Merrill Lynch Real estate Citi Utilities Citi BEST OVERALL SALES SERVICES Rank Firm % 1 CLSA 8.71% 2 Citi 8.31% 3 UBS 8.09% BEST SALESPERSON Rank Name Firm % 1 Arthur Chen Citi 6.52% 2 Jimmy Zhu Credit Suisse 3.79% 3 Philip Chan SWS 2.33% BEST EXECUTION Rank Firm % 1 UBS 12.48% 2 CLSA 6.94% 3 Citi 6.79% BEST IN SALES TRADING Rank Firm % 1 UBS 11.09% 2 Citi 7.99% 3 CLSA 7.65% MOST IMPROVED BROKERAGE OVER THE LAST 12 MONTHS Rank Firm % 1 CCBI 9.18% 2 SWS 8.98% 3 HSBC 6.88% BEST FOR EVENTS AND/OR CONFERENCES Rank Firm % 1 CLSA 17.85% 2 UBS 9.68% 3 Citi 8.11% BEST OR ROADSHOWS AND COMPANY VISITS Rank Firm % 1 CLSA 8.84% 2 UBS 8.39% 3 BoA - Merrill Lynch 7.53% MOST INDEPENDENT RESEARCH BROKERAGE Rank Firm % 1 CLSA 26.10% 2 SWS 7.93% 3 HSBC 7.77% HONG KONG
  • 8. 8 NOVEMBER2011 ASIAMONEY BEST LOCAL BROKERAGE Rank Firm % 1 Kotak 20.31% 2 Motilal Oswal 14.67% 3 Edelweiss 10.60% BEST FOR OVERALL COUNTRY RESEARCH Rank Firm % 1 CLSA 23.15% 2 Kotak 9.25% 3 Morgan Stanley 6.82% BEST ANALYST Rank Name Firm % 1 Sanjeev Prasad Kotak 6.61% 2 Nikhil Vora IDFC 5.23% 3 Neelkanth Mishra Credit Suisse 3.03% BEST RESEARCH COVERAGE Sector Firm Strategy CLSA Macroeconomics Morgan Stanley Small caps B&K Banks CLSA Capital goods Citi / Kotak Energy Kotak Materials Macquarie Software & services CLSA BEST OVERALL SALES SERVICES Rank Firm % 1 CLSA 13.29% 2 Citi 6.55% 3 Kotak 6.40% BEST SALESPERSON Rank Name Firm % 1 Sujay Kamath CLSA 3.68% 2 Pawan Nahar CLSA 2.46% 3 Navin Roy Macquarie 2.29% BEST EXECUTION Rank Firm % 1 CLSA 13.22% 2 Citi 6.70% 3 IIFL 6.40% BEST IN SALES TRADING Rank Firm % 1 CLSA 16.74% 2 Citi 8.23% 3 IIFL 6.68% MOST IMPROVED BROKERAGE OVER THE LAST 12 MONTHS Rank Firm % 1 Religare 9.08% 2 Ambit Capital 6.58% 3 UBS 6.20% BEST FOR EVENTS AND/OR CONFERENCES Rank Firm % 1 CLSA 15.37% 2 Motilal Oswal 14.26% 3 Morgan Stanley 7.20% BEST FOR ROADSHOWS AND COMPANY VISITS Rank Firm % 1 CLSA 9.06% 2 Enam 8.03% 3 Morgan Stanley 6.14% MOST INDEPENDENT RESEARCH BROKERAGE Rank Firm % 1 CLSA 34.73% 2 Kotak 10.97% 3 Edelweiss 5.43% INDIA
  • 9. asiamoney.com 9 BEST LOCAL BROKERAGE Rank Firm % 1 Mandiri 45.06% 2 Danareksa 27.04% 3 Bahana 19.76% BEST FOR OVERALL COUNTRY RESEARCH Rank Firm % 1 Deutsche Bank 19.40% 2 CLSA 17.39% 3 UBS 12.46% BEST ANALYST Rank Name Firm % 1 Heriyanto Irawan Deutsche Bank 11.19% 2 Erwan Teguh CIMB 10.42% 3 Joshua Tanja UBS 5.95% BEST RESEARCH COVERAGE Sector Firm Strategy Deutsche Bank Macroeconomics UBS Small caps CIMB Automobiles & components Deutsche Bank Banks Deutsche Bank Food, beverages & tobacco Deutsche Bank Materials Deutsche Bank Telecommunication services Deutsche Bank BEST OVERALL SALES SERVICES Rank Firm % 1 CLSA 21.86% 2 CIMB 12.46% 3 Deutsche Bank 12.05% BEST SALESPERSON Rank Name Firm % 1 Wuddy Warsono CLSA 9.72% 2 Daniel Oen CLSA 8.89% 3 Eugene Chung CLSA 5.80% BEST EXECUTION Rank Firm % 1 CLSA 16.88% 2 CIMB 13.29% 3 Deutsche Bank 10.28% BEST IN SALES TRADING Rank Firm % 1 CLSA 21.95% 2 CIMB 13.50% 3 Deutsche Bank 11.72% MOST IMPROVED BROKERAGE OVER THE LAST 12 MONTHS Rank Firm % 1 CIMB 20.68% 2 Mandiri 12.97% 3 Citi 9.24% BEST FOR EVENTS AND/OR CONFERENCES Rank Firm % 1 Deutsche Bank 18.66% 2 CLSA 17.45% 3 UBS 16.65% BEST FOR ROADSHOWS AND COMPANY VISITS Rank Firm % 1 CLSA 16.51% 2 Deutsche Bank 14.57% 3 UBS 12.31% MOST INDEPENDENT RESEARCH BROKERAGE Rank Firm % 1 CLSA 31.65% 2 Deutsche Bank 17.01% 3 CIMB 10.93% INDONESIA
  • 10. 10 NOVEMBER2011 ASIAMONEY BEST LOCAL BROKERAGE Rank Firm % 1 Nomura 47.19% 2 Daiwa 28.71% 3 Mizuho 15.40% BEST FOR OVERALL COUNTRY RESEARCH Rank Firm % 1 Nomura 25.31% 2 CLSA 8.23% 3 BoA - Merrill Lynch 8.06% BEST ANALYST Rank Name Firm % 1 Paul Wan CLSA 5.10% 2 Manabu Akizuki Nomura 3.95% 3 Chris Richter CLSA 2.68% BEST RESEARCH COVERAGE Sector Firm Strategy Nomura Macroeconomics Nomura Small caps Nomura Automobiles & components CLSA Banks CLSA Capital goods CLSA Materials Nomura Technology hardware & equipment Nomura BEST OVERALL SALES SERVICES Rank Firm % 1 Nomura 25.08% 2 Daiwa* 8.07% 3 CLSA 8.05% BEST SALESPERSON Rank Name Firm % 1 Koji Yoshida Nomura 6.55% 2 James O’Neile Nomura 3.68% 3 Sean Yeo Nomura 2.60% BEST EXECUTION Rank Firm % 1 Nomura 20.65% 2 UBS 8.65% 3 Daiwa* 6.91% BEST IN SALES TRADING Rank Firm % 1 Nomura 19.62% 2 Morgan Stanley 9.36% 3 UBS 8.17% MOST IMPROVED BROKERAGE OVER THE LAST 12 MONTHS Rank Firm % 1 Barclays Capital 13.73% 2 Nomura 12.56% 3 Credit Suisse 11.56% BEST FOR EVENTS AND/OR CONFERENCES Rank Firm % 1 Nomura 28.43% 2 CLSA 21.44% 3 BoA - Merrill Lynch 15.16% BEST FOR ROADSHOWS AND COMPANY VISITS Rank Firm % 1 Nomura 31.49% 2 CLSA 10.32% 3 Mizuho 9.15% MOST INDEPENDENT RESEARCH BROKERAGE Rank Firm % 1 CLSA 35.52% 2 MF Global 14.92% 3 Advanced Research Japan 9.45% * Daiwa Institute of Research JAPAN
  • 11. asiamoney.com 11 BEST LOCAL BROKERAGE Rank Firm % 1 Samsung 31.27% 2 Korea Investment & Securities 17.08% 3 Daewoo 14.33% BEST FOR OVERALL COUNTRY RESEARCH Rank Firm % 1 Samsung 16.60% 2 UBS 8.43% 3 Korea Investment & Securities 7.21% BEST ANALYST Rank Name Firm % 1 Young Chang UBS 4.36% 2 JungHoon Chang Samsung 4.01% 3 Chongkyu Juhn Samsung 3.23% BEST RESEARCH COVERAGE Sector Firm Strategy Samsung Macroeconomics Samsung Small caps Samsung Automobiles and components Samsung Banks Samsung Capital goods Samsung Materials Samsung Semiconductors and semiconductor equipment Korea Investment & Securities BEST OVERALL SALES SERVICES Rank Firm % 1 Samsung 13.99% 2 UBS 9.59% 3 HSBC 7.46% BEST SALESPERSON Rank Name Firm % 1 John Lee HSBC 4.54% 2 Sung Choi HSBC 2.04% 3 DH Kim BoA - Merrill Lynch 2.01% BEST EXECUTION Rank Firm % 1 Samsung 15.26% 2 UBS 8.10% 3 Credit Suisse 6.35% BEST IN SALES TRADING Rank Firm % 1 Samsung 14.70% 2 UBS 8.62% 3 BoA - Merrill Lynch 6.88% MOST IMPROVED BROKERAGE OVER THE LAST 12 MONTHS Rank Firm % 1 Samsung 20.64% 2 Korea Investment & Securities 10.24% 3 HSBC 10.01% BEST FOR EVENTS AND/OR CONFERENCES Rank Firm % 1 Samsung 16.68% 2 UBS 13.81% 3 BoA - Merrill Lynch 12.69% BEST FOR ROADSHOWS AND COMPANY VISITS Rank Firm % 1 Samsung 16.34% 2 Korea Investment & Securities 9.36% 3 UBS 7.63% MOST INDEPENDENT RESEARCH BROKERAGE Rank Firm % 1 CLSA 26.83% 2 Samsung 14.50% 3 HSBC 7.41% KOREA
  • 12. 12 NOVEMBER2011 ASIAMONEY BEST LOCAL BROKERAGE Rank Firm % 1 CIMB 44.89% 2 Maybank 23.02% 3 AmInvestment Bank 10.08% BEST FOR OVERALL COUNTRY RESEARCH Rank Firm % 1 CIMB 21.94% 2 Maybank 8.70% 3 Credit Suisse 8.28% BEST ANALYST Rank Name Firm % 1 Terence Wong CIMB 6.16% 2 Yeoh Yung Juen CIMB 4.87% 3 Clare Chin CLSA 4.07% BEST RESEARCH COVERAGE Sector Firm Strategy CIMB Macroeconomics RHB Small caps OSK DMG Banks CIMB Capital goods CIMB Food, beverage and tobacco CIMB Telecommunication services CIMB Consumer service CIMB BEST OVERALL SALES SERVICES Rank Firm % 1 CIMB 21.82% 2 Maybank 12.70% 3 CLSA 8.10% BEST SALESPERSON Rank Name Firm % 1 May Lee UBS 5.33% 2 Ai Vye Chin J.P. Morgan 5.23% 3 Kit Lim CLSA 4.82% BEST EXECUTION Rank Firm % 1 CIMB 20.80% 2 Maybank 11.98% 3 Credit Suisse 7.32% BEST IN SALES TRADING Rank Firm % 1 CIMB 22.14% 2 Maybank 15.42% 3 Credit Suisse 7.52% MOST IMPROVED BROKERAGE OVER THE LAST 12 MONTHS Rank Firm % 1 Maybank 14.36% 2 Nomura 13.75% 3 AmInvestment Bank 11.44% BEST FOR EVENTS AND/OR CONFERENCES Rank Firm % 1 CIMB 23.59% 2 Maybank 18.65% 3 CLSA 7.28% BEST FOR ROADSHOWS AND COMPANY VISITS Rank Firm % 1 CIMB 20.11% 2 Maybank 18.30% 3 CLSA 8.02% MOST INDEPENDENT RESEARCH BROKERAGE Rank Firm % 1 CLSA 16.15% 2 OSK DMG 10.43% 3 Nomura 8.17% MALAYSIA
  • 13. asiamoney.com 13 BEST LOCAL BROKERAGE Rank Firm % 1 Topline 47.98% 2 Foundation 22.67% 3 JS Global Capital 17.57% BEST FOR OVERALL COUNTRY RESEARCH Rank Firm % 1 Topline 38.99% 2 KASB / BoA - Merrill Lynch 35.46% 3 AKD Securities 8.07% BEST ANALYST Rank Name Firm % 1 Imtiaz Gadar KASB / BoA - Merrill Lynch 89.57% 2 Farhan Mahmood Topline 3.91% 3 Mohammed Sohail Topline 2.61% BEST RESEARCH COVERAGE Sector Firm Strategy KASB / BoA - Merrill Lynch Macroeconomics KASB / BoA - Merrill Lynch Small caps KASB / BoA - Merrill Lynch Banks KASB / BoA - Merrill Lynch Energy KASB / BoA - Merrill Lynch Materials KASB / BoA - Merrill Lynch Telecommunication services KASB / BoA - Merrill Lynch Utilities KASB / BoA - Merrill Lynch BEST OVERALL SALES SERVICES Rank Firm % 1 KASB / BoA - Merrill Lynch 20.73% 2 HSBC 19.06% 3 Topline 18.35% BEST SALESPERSON Rank Name Firm % 1 Mohammed Sohail Topline 35.04% 2 Baryalay Arbab KASB / BoA - Merrill Lynch 32.87% 3 Imtiaz Gadar KASB / BoA - Merrill Lynch 23.62% BEST EXECUTION Rank Firm % 1 KASB / BoA - Merrill Lynch 29.58% 2 Topline 21.13% 3 HSBC 16.90% BEST IN SALES TRADING Rank Firm % 1 KASB / BoA - Merrill Lynch 28.13% 2 Topline 25.20% 3 Deutsche Bank 16.00% MOST IMPROVED BROKERAGE OVER THE LAST 12 MONTHS Rank Firm % 1 Topline 66.17% 2 Foundation 30.83% 3 KASB / BoA - Merrill Lynch 2.26% BEST FOR EVENTS AND/OR CONFERENCES Rank Firm % 1 Topline 43.64% 2 KASB / BoA - Merrill Lynch 42.07% 3 Auerbach Grayson 9.39% BEST FOR ROADSHOWS AND COMPANY VISITS Rank Firm % 1 KASB / BoA - Merrill Lynch 50.23% 2 Topline 32.16% 3 Auerbach Grayson 11.27% MOST INDEPENDENT RESEARCH BROKERAGE Rank Firm % 1 Topline 51.58% 2 Citi 42.11% 3 KASB / BoA - Merrill Lynch 5.26% PAKISTAN
  • 14. 14 NOVEMBER2011 ASIAMONEY BEST LOCAL BROKERAGE Rank Firm % 1 Philippine Equity Partners 39.29% 2 ATR-Kim Eng 24.76% 3 SB Equities 14.36% BEST FOR OVERALL COUNTRY RESEARCH Rank Firm % 1 CLSA 30.41% 2 UBS 21.34% 3 Deutsche Bank 19.06% BEST ANALYST Rank Name Firm % 1 Jody Santiago UBS 26.19% 2 Alex Pomento Macquarie 11.07% 3 Leo Venezuela CLSA 6.99% BEST RESEARCH COVERAGE Sector Firm Strategy CLSA Macroeconomics UBS Small caps CLSA Banks CLSA Capital goods CLSA Real estate CLSA Telecommunication services CLSA Utilities CLSA BEST OVERALL SALES SERVICES Rank Firm % 1 CLSA 34.32% 2 Deutsche Bank 19.49% 3 UBS 18.03% BEST SALESPERSON Rank Name Firm % 1 Alex Dauz CLSA 18.70% 2 Robby Go UBS 17.35% 3 Mitze De Dios CLSA 11.29% BEST EXECUTION Rank Firm % 1 CLSA 29.27% 2 UBS 16.81% 3 Deutsche Bank 16.29% BEST IN SALES TRADING Rank Firm % 1 CLSA 27.12% 2 Deutsche Bank 18.98% 3 UBS 16.92% MOST IMPROVED BROKERAGE OVER THE LAST 12 MONTHS Rank Firm % 1 CLSA 16.96% 2 Citi 16.23% 3 Deutsche Bank 13.04% BEST FOR EVENTS AND/OR CONFERENCES Rank Firm % 1 CLSA 33.14% 2 UBS 23.06% 3 Deutsche Bank 16.31% BEST FOR ROADSHOWS AND COMPANY VISITS Rank Firm % 1 CLSA 25.52% 2 UBS 22.74% 3 Deutsche Bank 17.64% MOST INDEPENDENT RESEARCH BROKERAGE Rank Firm % 1 CLSA 39.55% 2 Philippine Equity Partners 19.24% 3 Deutsche Bank 18.53% THE PHILIPPINES
  • 15. asiamoney.com 15 BEST LOCAL BROKERAGE Rank Firm % 1 DBS Vickers 50.08% 2 UOB Kay Hian 19.99% 3 Kim Eng 19.13% BEST FOR OVERALL COUNTRY RESEARCH Rank Firm % 1 UBS 18.84% 2 DBS Vickers 13.35% 3 J.P. Morgan 9.15% BEST ANALYST Rank Name Firm % 1 Min Lan Tan UBS 11.37% 2 Chris Gee J.P. Morgan 4.45% 3 Terence Wong OSK DMG 4.32% BEST RESEARCH COVERAGE Sector Firm Strategy UBS Macroeconomics UBS Small caps DBS Vickers Banks Citi Capital goods BoA - Merrill Lynch Real estate UBS Telecommunication services Nomura Transportation DBS Vickers BEST OVERALL SALES SERVICES Rank Firm % 1 DBS Vickers 13.95% 2 UBS 10.97% 3 CLSA 7.85% BEST SALESPERSON Rank Name Firm % 1 Gaurang Bhatia UBS 4.49% 2 Michael Balbirnie UBS 4.26% 3 Ann Lim CLSA 4.10% BEST EXECUTION Rank Firm % 1 UBS 10.97% 2 DBS Vickers 9.51% 3 CLSA 8.76% BEST IN SALES TRADING Rank Firm % 1 CLSA 10.32% 2 UBS 9.67% 3 DBS Vickers 9.12% MOST IMPROVED BROKERAGE OVER THE LAST 12 MONTHS Rank Firm % 1 DBS Vickers 13.15% 2 Standard Chartered 12.56% 3 BoA - Merrill Lynch 12.26% BEST FOR EVENTS AND/OR CONFERENCES Rank Firm % 1 DBS Vickers 13.61% 2 CLSA 11.98% 3 Deutsche Bank 10.73% BEST FOR ROADSHOWS AND COMPANY VISITS Rank Firm % 1 DBS Vickers 16.18% 2 UBS 9.11% 3 J.P. Morgan 8.52% MOST INDEPENDENT RESEARCH BROKERAGE Rank Firm % 1 CLSA 30.42% 2 BoA - Merrill Lynch 9.31% 3 OSK DMG 6.96% SINGAPORE
  • 16. 16 NOVEMBER2011 ASIAMONEY BEST LOCAL BROKERAGE Rank Firm % 1 Yuanta 43.65% 2 KGI 19.93% 3 Fubon 14.16% BEST FOR OVERALL COUNTRY RESEARCH Rank Firm % 1 UBS 13.04% 2 Yuanta 12.42% 3 Macquarie 9.63% BEST ANALYST Rank Name Firm % 1 William Dong UBS 7.30% 2 Jonah Cheng UBS 4.30% 3 Henry King Goldman Sachs 3.60% BEST RESEARCH COVERAGE Sector Firm Strategy UBS Macroeconomics UBS Small caps Macquarie Banks BoA - Merrill Lynch Materials Yuanta Semiconductors & semiconductor equipment UBS Technology hardware & equipment Goldman Sachs Telecommunication services UBS BEST OVERALL SALES SERVICES Rank Firm % 1 UBS 11.44% 2 Yuanta 11.27% 3 Macquarie 9.16% BEST SALESPERSON Rank Name Firm % 1 Julie Tsai UBS 6.08% 2 Peili Wang HSBC 3.48% 3 Ted Lo UBS 3.05% BEST EXECUTION Rank Firm % 1 UBS 10.38% 2 Yuanta 10.16% 3 Macquarie 7.85% BEST IN SALES TRADING Rank Firm % 1 UBS 11.88% 2 Yuanta 9.44% 3 HSBC 8.76% MOST IMPROVED BROKERAGE OVER THE LAST 12 MONTHS Rank Firm % 1 Yuanta 11.64% 2 HSBC 11.56% 3 UBS 8.99% BEST FOR EVENTS AND/OR CONFERENCES Rank Firm % 1 UBS 16.21% 2 BoA - Merrill Lynch 11.48% 3 Yuanta 8.28% BEST FOR ROADSHOWS AND COMPANY VISITS Rank Firm % 1 Yuanta 11.45% 2 UBS 10.62% 3 Macquarie 8.45% MOST INDEPENDENT RESEARCH BROKERAGE Rank Firm % 1 CLSA 16.62% 2 Yuanta 16.00% 3 KGI 9.67% TAIWAN
  • 17. asiamoney.com 17 BEST LOCAL BROKERAGE Rank Firm % 1 Phatra 36.10% 2 Thanachart 24.91% 3 TISCO 12.57% BEST FOR OVERALL COUNTRY RESEARCH Rank Firm % 1 CLSA 15.80% 2 UBS 12.96% 3 Credit Suisse 12.42% BEST ANALYST Rank Name Firm % 1 Dan Fineman Credit Suisse 9.68% 2 Tim Taylor CLSA 8.10% 3 Ian Gisbourne UBS 6.89% BEST RESEARCH COVERAGE Sector Firm Strategy Credit Suisse Macroeconomics UBS Small caps Thanachart Banks CLSA Energy UBS Food & staples retailing Thanachart Materials Credit Suisse Telecommunication services CIMB BEST OVERALL SALES SERVICES Rank Firm % 1 UBS 15.75% 2 CLSA 14.84% 3 Credit Suisse 10.04% BEST SALESPERSON Rank Name Firm % 1 Munmun Taveeratanasilp CLSA 9.09% 2 Jamie Woodward UBS 7.31% 3 Pat Pattaphongse UBS 7.05% BEST EXECUTION Rank Firm % 1 UBS 16.03% 2 CLSA 15.19% 3 Credit Suisse 9.40% BEST IN SALES TRADING Rank Firm % 1 UBS 18.39% 2 CLSA 14.49% 3 Credit Suisse 10.66% MOST IMPROVED BROKERAGE OVER THE LAST 12 MONTHS Rank Firm % 1 Thanachart 17.22% 2 Credit Suisse 16.95% 3 CIMB 10.44% BEST FOR EVENTS AND/OR CONFERENCES Rank Firm % 1 CLSA 23.48% 2 Credit Suisse 11.52% 3 Phatra 10.70% BEST FOR ROADSHOWS AND COMPANY VISITS Rank Firm % 1 CLSA 16.32% 2 Thanachart 11.04% 3 UBS 10.35% MOST INDEPENDENT RESEARCH BROKERAGE Rank Firm % 1 CLSA 27.84% 2 Thanachart 14.33% 3 DBS Vickers 6.71% THAILAND
  • 18. 18 NOVEMBER2011 ASIAMONEY BEST LOCAL BROKERAGE Rank Firm % 1 Ho Chi Minh City Securities 36.46% 2 Saigon Securities 23.96% 3 ACB Securities 21.35% BEST FOR OVERALL COUNTRY RESEARCH Rank Firm % 1 J.P. Morgan 41.50% 2 RBS 40.82% 3 HSBC 5.10% BEST ANALYST Rank Name Firm % 1 Fiachra Mac Cana Ho Chi Minh City Securities 51.36% 2 David Kadarauch Mekong Securities 14.01% 3 Truong Thu My Ho Chi Minh City Securities 12.45% BEST RESEARCH COVERAGE Sector Firm Strategy Ho Chi Minh City Securities Macroeconomics ACB Securities Small caps Ho Chi Minh City Securities Banks ACB Securities Energy Ho Chi Minh City Securities Food & staples retailing Ho Chi Minh City Securities Materials ACB Securities Tach hardware & equipment Ho Chi Minh City Securities BEST OVERALL SALES SERVICES Rank Firm % 1 ACB Securities 16.67% 2 Ho Chi Minh City Securities 16.60% 3 J.P. Morgan 14.46% BEST SALESPERSON Rank Name Firm % 1 Attila Vajda ACB Securities 37.79% 2 Michel Tosto Viet Capital Securities 16.33% 3 Sriyan Pietersz J.P. Morgan 14.93% BEST EXECUTION Rank Firm % 1 ACB Securities 33.03% 2 Ho Chi Minh City Securities 29.88% 3 HSBC 10.48% BEST IN SALES TRADING Rank Firm % 1 Ho Chi Minh City Securities 34.29% 2 ACB Securities 26.24% 3 Saigon Securities 10.05% MOST IMPROVED BROKERAGE OVER THE LAST 12 MONTHS Rank Firm % 1 ACB Securities 53.27% 2 CLSA 37.38% 3 Sacombank Securities 5.61% BEST FOR EVENTS AND/OR CONFERENCES Rank Firm % 1 ACB Securities 43.19% 2 Ho Chi Minh City Securities 16.60% 3 Sacombank Securities 15.11% BEST FOR ROADSHOWS AND COMPANY VISITS Rank Firm % 1 ACB Securities 45.62% 2 Ho Chi Minh City Securities 28.09% 3 Saigon Securities 16.24% MOST INDEPENDENT RESEARCH BROKERAGE Rank Firm % 1 ACB Securities 53.77% 2 Ho Chi Minh City Securities 37.74% 3 Sacombank Securities 2.83% VIETNAM
  • 19. asiamoney.com 19 METHODOLOGY • Least independent research brokerage Hedge Fund section – asked hedge funds their views on various categories relating to hedge fund services and prime broking. Please refer to the results of the Prime Broking & Hedge Fund Services Poll published in the October issue of Asiamoney. Country sections • Most improved brokerage, across both research & sales, over the last 12 months • Best local brokerage Equity Sales • Best overall sales service • Best sales people • Best brokerage for sales trading • Best execution Corporate Access • Best for events and/or conferences • Best for roadshows and company visits Equity Research • Best overall country research • Best country analysts • Best research coverage for strategy, macroeconomics, small caps and each of the 5 highest-weighted industries* in that market * Industries selected according to the relevant MSCI indices as of 31 May 2011. • Most independent research brokerage Calculation of Results Points for Place For all categories, a first place vote was awarded three points; second place two points and third place one point. “One Firm – One Vote” To avoid any one institution having more influence than others of equal size, multiple responses were fractioned according to the total number received from that one institution. Asset Size Weightings Each response was then weighted according to the institution’s approximate asset size (total unleveraged Asian equity funds under management) in Asia-Pacific (ex-Australia & Japan), in Australia or in Japan (depending upon the institution’s allocation of funds). The table below details weightings according to asset size (hedge fund firms have been weight- ed at six times their assets to reflect their higher turnover rate): Asset size (US$million) No. of institutions Multiplied by <50 366 0.5 50-200 437 1 201-500 309 4 501-2,000 471 8 2,001-5,000 281 12 5,001-10,000 225 16 >10,000 280 20 2,369 Rankings for Overall Combined Regional Research & Sales, Overall Regional Research & Overall Regional Sales For the Asia (ex-Australia & Japan) rankings a country weighting system was used to com- pare brokerages as a whole in the region. The rationale is that the importance of markets varies across the region, so the points a brokerage receives in major markets should be weighted more than the points it receives in smaller markets. The MSCI AC Asia ex-Japan (as of 31 May 2011) was used to achieve this. A similar sector weighting system was used to address the importance of the sectors within the region. Please refer to the following tables for a mathematical breakdown: Asiamoney’s 22nd annual Brokers Poll invited chief investment officers, senior fund managers and senior investment analysts at fund management houses, hedge fund & private equity firms, insurance companies and wealth management houses in Asia- Pacific, Europe and North America. A total of 4,431 valid individual responses from approximately 2,300 different institutions, including 481 hedge funds, were received. During the auditing process Asiamoney further verified responses by speaking directly to respondents; 323 individual responses were made void either because they failed to fulfill the auditing requirements. The geographical breakdown of the final 2,369 institu- tions is as follows: The questionnaire incorporates 16 different sections as follows: Regional China Indonesia Malaysia Singapore Hedge Fund Hong Kong Japan Pakistan Taiwan Australia India Korea The Philippines Thailand Vietnam The questionnaire includes the following sections and categories: Regional (Asia ex-Australia & Japan) section • Most improved brokerage, across both research & sales, over the last 12 months. Regional Equity Sales • Best regional brokerages for sales services • Best regional sales people • Best regional sales traders • Best regional brokerages for execution Regional Equity Research The 12 industries covered are those given the highest weighting in the MSCI Asia ex-Japan index as of 31 May 2011 – please refer to the GICS map for industry definitions. • Strategist • Economist • Quantitative/technical analyst • Banks analyst • Conglomerates analyst • Consumer discretionary analyst • Consumer staples analyst • Energy analyst • Insurance analyst • Materials analyst • Real estate analyst • Semiconductors & semiconductor equipment analyst • Technology hardware & equipment analyst • Telecommunication services analyst • Utilities analyst • Most independent research brokerage Australia 1.55% China 29.24% Thailand 0.86% Taiwan 5.37% Hong Kong 23.48% India 6.92% Indonesia 1.14% Japan 1.18% Europe 3.69% Malaysia 4.62% Korea 4.69% North America 6.85% Others 0.71% Philippines 0.32% Singapore 9.4%
  • 20. 20 NOVEMBER2011 ASIAMONEY METHODOLOGY CONT. Weightings for the Asia (ex-Australia & Japan) overall research rankings Regional (Total) 30.00% Multiplied by - Strategy 3.00% 0.48 - Economics 2.00% 0.32 - Quantitative 1.00% 0.16 - Banks 4.92% 0.79 - Conglomerates 0.92% 0.15 - Consumer Discretionary 2.56% 0.41 - Consumer Staples 1.29% 0.21 - Energy 2.34% 0.37 - Insurance 1.09% 0.17 - Materials 2.42% 0.39 - Real Estate 1.90% 0.30 - Semiconductors & Semiconductor Equipment 2.33% 0.37 - Technology Hardware & Equipment 1.69% 0.27 - Telecommunication Services 1.58% 0.25 - Utilities 0.95% 0.15 Country (Total) 70.00% Multiplied by - China 17.23% 2.76 - Hong Kong 7.85% 1.26 - India 6.81% 1.09 - Indonesia 2.46% 0.39 - Korea 14.40% 2.30 - Malaysia 2.85% 0.46 - Philippines 0.54% 0.09 - Singapore 4.89% 0.78 - Taiwan 11.28% 1.81 - Thailand 1.69% 0.27 Total 100.00% Weightings for the Asia (ex-Australia & Japan) overall sales rankings Regional 30.00% Multiplied by - Overall sales services 30.00% 4.80 Country (Total) 70.00% Multiplied by - China 17.23% 2.76 - Hong Kong 7.85% 1.26 - India 6.81% 1.09 - Indonesia 2.46% 0.39 - Korea 14.40% 2.30 - Malaysia 2.85% 0.46 - Philippines 0.54% 0.09 - Singapore 4.89% 0.78 - Taiwan 11.28% 1.81 - Thailand 1.69% 0.27 Total 100.00% For the Australia and Japan overall combined research & sales rankings, the votes from the categories of best overall country research and best overall sales service for each market were simply added together. Asiamoney would like to thank those who helped design the questionnaire, as well as all respondents for taking the time to complete and return it. The detailed results can also be viewed on our website, www.asiamoney.com and full results will be published in the 2011 Brokers Poll Full Report, available from 1 December 2011.
  • 21. asiamoney.com 21 INDUSTRY GROUP (SELECTED) INDUSTRY Automobiles & Components - auto components - automobiles Banks - commercial banks - thrifts & mortgage finance Capital Goods - aerospace & defense - building products - construction & engineering - electrical equipment - industrial conglomerates - machinery - trading companies & distributors Commercial Services & Supplies - commercial services & supplies - professional services Conglomerates 1 - industrial conglomerates Consumer Durables & Apparel - household durables - leisure equipment & products - textiles, apparel & luxury goods Consumer Services - hotels, restaurants & leisure - diversified consumer services Diversified Financials - diversified financial services - consumer finance - capital markets Energy - energy equipment & services - oil, gas & consumable fuels Food & Staples Retailing - food & staples retailing Food, Beverage & Tobacco - beverages - food products - tobacco Health Care Equipment & Services - health care equipment & supplies - health providers & services - health care technology Household & Personal Products - household products - personal products Insurance - insurance Materials - chemicals - construction materials - containers & packaging - metals & mining - paper & forest products Media - media Pharmaceuticals, Biotechnology & Life Sciences - biotechnology - pharmaceuticals - life science tools & services Real Estate - real estate investment trusts (REITs) - real estate management & development Retailing - distributors - internet & catalogue retail - multiline retail - specialty retail Semiconductors & Semiconductor Equipment - semiconductors - semiconductor equipment Software & Services - internet software & services - IT services - software Technology Hardware & Equipment - communications equipment - computers & peripherals - office electronics - electronic equipment & instruments - electronic components Telecommunication Services - diversified telecommunication services - wireless telecommunication services Transportation - air freight & logistics - airlines - marines - road & rail - transportation infrastructure Utilities - electric utilities - gas utilities - multi-utilities - water utilities - independent power producers & energy traders 1 Conglomerates refers to the Industry Industrial Conglomerates. It has been selected as a regional sector to replace Capital Goods to better reflect the industry sectors covered by brokers within the region. Disclaimer This information is the property of Morgan Stanley Capital International Inc. (MSCI). It is provided for informational purposes only, and is not a recommendation to participate in any particular trading strategy. The information may not be used to verify or correct data, or any compilation of data or index or in the creation of any indices. Nor may it be used in the creating, writing, offering, trading, marketing or promotion of any financial instruments or products. This information is provided on an “as is” basis. Although MSCI shall obtain information from sources which MSCI considers reliable, neither MSCI, its affiliates nor any other party involved in the making or compiling of the information guarantees the accuracy and/or the completeness of any of this information. Neither MSCI, its affiliates nor any other party involved in the making or compiling of the information makes any representation or warranty, express or implied, as to the results to be obtained by any person or entity from any use of this information, and the user of this information assumes the entire risk of any use made of this information. Neither MSCI, its affiliates nor any other party involved in the making or compiling of the information makes any express or implied warranties, and MSCI, its affiliates and any other party involved in the making or compiling of the information hereby expressly disclaim all warranties of merchantability or fitness for a particular purpose with respect to any of this information. Without limiting any of the foregoing, in no event shall MSCI, its affiliates or any other party involved in the making or compiling of the information have any liability for any direct, indirect, special, punitive, consequential or any other damages (including lost profits) even if notified of the possibility of such damages. Morgan Stanley Capital International, MSCI and all other service marks referred to herein are the exclusive property of MSCI and its affiliates. All MSCI indices are the exclusive property of MSCI and may not be used in any way without the express written permission of MSCI. MSCI is a leading provider of global indices and benchmark related products and services to investors worldwide. Morgan Stanley, a global financial services firm and a market leader in securities, asset management, and credit services, is the majority shareholder of MSCI, and The Capital Group Companies, Inc., a global investment management group, is the minority shareholder. GLOBAL INDUSTRY CLASSIFICATION STANDARD (GICS)SM FOR ENQUIRES, PLEASE CALL MSCI 24 HR CLIENT SERVICE ON (852) 2848 6740