Q3 2024 Earnings Conference Call and Webcast Slides
Asi está the economy January 2018 Circulo de Empresarios
1. January 2018
SPAIN
Labour employment (M. of Employment)
In December, the unemployment rate fell to
3,412,781. When compared to November, this
means a fall of 61,500 people, and 7.84% less
year-on-year (-290,193). Unemployment has
reached its lowest level in eight years. From its
peak in February 2013 (5,040,222),
unemployment has fallen by 1,627,441 people.
In December, 1,652,016 new jobs were
recorded (-2.77% year-on-year), of which
131,067 were permanent (38.3% of these were
originally temporary contracts). In 2017, there
were 21,501,303 new positions created (+7.62%
year-on-year), of which 1.9 million were
permanent (+12.61% year-on-year), the best fi-
gure of the last decade, with 35.6% of the
permanent contracts being converted from
temporary contracts.
2017 closed with a total of 18,460,201 average
affiliates to the Social Security system, 611,146
more in annual terms (+3.42%), the highest
figure since 2005, when an extraordinary
regularization of foreign workers took place.
PMIs (Markit)
In December, the PMI, the business confidence
index of the manufacturing sector, stood at
55.8 points, versus 56.1 in November. The
strong increase in production, explained by
the increase in new orders, has boosted the
level of employment and demand of the
business sector.
The service PMI rose to 54.6 points (54.4 in
November). By 2018, more than 45% of
respondents expect increased activity due to
expectations of improving economic
conditions, the launch of new products and
the growth of sales teams.
Public accounts (Ministry of Finance)
Consolidated Public Administrations
In Q3 2017, the deficit of PPAA stood at 1.46%
of GDP (excluding financial aid), 1.2 points
below the level of Q3 2016. The objective of
budgetary stability set for 2017 is 3.1% of GDP.
Central government
In November, the government deficit stood at
€18,217m, 1.56% of GDP (-0.95% year-on-
year). The primary balance (which excludes
spending on debt interest) stood at 0.5% of
GDP (0.22% in November 2016).
Non-financial resources reached €165,156m
(14.15% of GDP), a 3.7% increase year-on-year,
which can fundamentally be explained by the
increase seen in tax revenue (4.7%), driven by
greater VAT collection (+5.7%). For its part,
non-financial employment reached 183,373
million (-2.1% year-on-year).
EUROPE
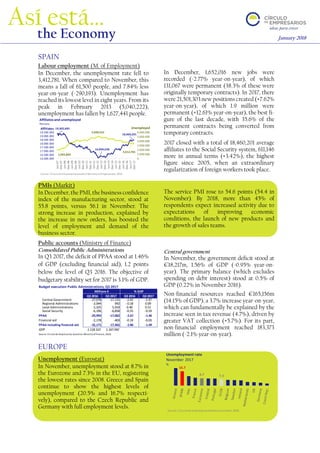
Unemployment (Eurostat)
In November, unemployment stood at 8.7% in
the Eurozone and 7.3% in the EU, registering
the lowest rates since 2008. Greece and Spain
continue to show the highest levels of
unemployment (20.5% and 16.7% respecti-
vely), compared to the Czech Republic and
Germany with full employment levels.
19,302,685
16,094,638
18,460,201
1,965,869
5,040,222
3,412,781
0
1.000.000
2.000.000
3.000.000
4.000.000
5.000.000
6.000.000
16.000.000
16.500.000
17.000.000
17.500.000
18.000.000
18.500.000
19.000.000
19.500.000
Jun-07
Dec-07
Jun-08
Dec-08
Jun-09
Dec-09
Jun-10
Dec-10
Jun-11
Dec-11
Jun-12
Dec-12
Jun-13
Dec-13
Jun-14
Dec-14
Jun-15
Dec-15
Jun-16
Dec-16
Jun-17
Dec-17
Affiliates and unemployed
Persons
Source:Círculode Empresarios basedonMinistryof Employment, 2018
Affiliates Unemployed
Budget execution Public Administrations, Q3 2017
Q3 2016 Q3 2017 Q3 2016 Q3 2017
Central Government -27,078 -17,115 -2.42 -1.47
Regional Administrations -2,044 992 -0.18 0.09
Local Administrations 5,325 5,919 0.48 0.51
Social Security -6,196 -6,858 -0.55 -0.59
PPAA -29,993 -17,062 -2.67 -1.46
Financial aid -2,178 -403 -0.19 -0.03
PPAA including financial aid -32,171 -17,465 -2.86 -1.49
GDP 1.118.522 1.167.042
Millions € % GDP
Source: Círculo de Empresarios based on Ministry ofFinance, 2018
7.38.7
16.7
Unemployment rate
November 2017
%
Source:Círculode Empresarios basedonEurostat, 2018
Así está…
the Economy
2. ‘Así está…The economy’, a publication of the Círculo de Empresarios produced by its Department of the Economy, contains information and
opinion from reliable sources. However, the Círculo de Empresarios does not guarantee its accuracy and does not take responsibility for any errors
or omissions. This document is merely informative. As a result, the Círculo de Empresarios is not responsible for any uses that may be made of the
publication. The opinions and estimates of the Department can be modified without any warning.
www.circulodeempresarios.org
Eurozone inflation (Eurostat)
In December, inflation in the Eurozone
flattened to 1.4%, 0.1% less than November,
due to the smaller increase in energy prices,
higher than in Spain (1.1%). In 2017 the weigh-
ted-average inflation was 1.5%.
On the other hand, core inflation, which
excludes energy prices and food, remained for
the third consecutive month at 1.1% year-on-
year, with an average of 1.1%.
INTERNATIONAL
US economy
Labour market, Dec. 2017 (BLS)
• The unemployment rate remained at 4.1%
for the third consecutive month.
• 148,000 new jobs were created.
• Wages grew by 2.5% year-on-year.
Prices, Nov. 2017
In November, inflation increased to 2.2% (vs.
2% in October) explained by the increase in
energy prices.
Core inflation stood at 1.7% (vs. 1.8% in
October).
In this context, on December 13th the Federal
Reserve passed a new interest rate rise by 25
basis points, bringing the short-term rate to
the 1.25% -1.50% range.
Stock market
In the first week of 2018, the stock exchanges
of the main advanced economies have recorded
positive developments:
• In the USA, the S&P 500 reached 2.6%.
• In the Eurozone, the major indexes
recorded gains above 3%.
In the emerging block, the global equity index
(MSCI Emerging Markets Index) grew by
3.7%, with Latin America standing out
(+5.0%).
Oil price
The increase in world demand, the
announcement by OPEC to prolong
production cuts until the end of 2018 and the
tensions in Iran are driving up the price per ba-
rrel of Brent. In the first weeks of 2018, the
price has been around $69, the maximum level
since May 2015 and 40% higher than the
average prices of 2016 and 2017.
1.4
3
2.1
1.2
0.5
Total
Dec. 2017
Energy
Food, beverage and tobacco
Services
Non-energy industrial goods
Eurozone CPI
%
Source:Círculode Empresarios basedonEurostat, 2018
Annual average 2017
1.5%
5
7.3
9.9
9.3
8.5
7.9
6.7
5.6
5 4.7
4.1
2007 2008 2009 2010 2011 2012 2013 2014 2015 2016 2017
US unemployment 2007 - 2017
%, Dec.
Source:Círculode Empresarios basedonBureauof LaborStatistics, 2018
3.8% 3.7% 3.7% 3% 2,6%
21.4%
9.4%
36.3%
8.6%
20.5%
0,0%
5,0%
10,0%
15,0%
20,0%
25,0%
30,0%
35,0%
40,0%
PSI Ibex 35 MSCI Eurostoxx 50 S&P 500
Stock exchanges
%
Change in the first 5 days of 2018
Annual change
Source:Círculo de Empresarios basedonLa Caixa, 2018
20
30
40
50
60
70
80
90
100
110
120
10-Jan-2013 10-Jan-2014 10-Jan-2015 10-Jan-2016 10-Jan-2017 10-Jan-2018
Europe Brent spot price
$
Source:Círculo de Empresarios basedoneiaandBloomberg, 2018
Nov2016
1st AgreementOPEC
Nov2016
2nd AgreementOPEC
Excesssupply
OPEC andUSA