Authentic No 1 Amil Baba In Pakistan Authentic No 1 Amil Baba In Karachi No 1...
Asi esta the_economy June 2016 circulo de empresarios
1. June 2016
O
SPAIN
GDP 1Q 2016 (INE)
GDP increased 0.8% quarter-on-quarter and
3.4% year-on-year (vs. 3.5% year-on-year as
measured in the 1Q of 2015). The contribution
of domestic demand to annual growth was 3.8
points (three decimal points less than in the
4Q of 2015), which was offset by external
demand of -0.4 points (as against -0.6 points
in the 4Q of 2015).
According to the latest projections by the
Bank of Spain, GDP will increase by 2.7% in
2016, by 2.3% in 2017 and by 2.1% in 2018.
Employment May 2016 (Ministry of Em-
ployment and SS)
Registered unemployment...
... dropped by 119,768 persons with regard to
April, to a total of 3,891,403 persons, the first
time the figure was below 4 million since
August of 2010. Over the past 12 months
unemployment has dropped 7.68% (323,628
persons), and by 12.4% (45,853 persons) in
the case of people younger than 25.
Unemployment dropped in all the Autono-
mous Communities, especially in Andalusia,
Catalonia and Madrid. Likewise, it declined
in all sectors, especially services and con-
struction.
Registered contracts...
...increased 11.13% year-on-year up to
1,748,449 in May, of which 145,760 are per-
manent, some 17% more than a year earlier.
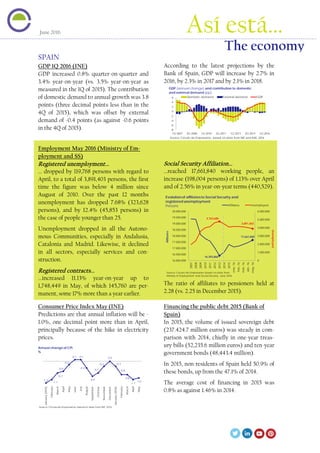
Social Security Affiliation...
...reached 17,661,840 working people, an
increase (198,004 persons) of 1.13% over April
and of 2.56% in year-on-year terms (440,529).
The ratio of affiliates to pensioners held at
2.28 (vs. 2.25 in December 2015).
Consumer Price Index May (INE)
Predictions are that annual inflation will be -
1.0%, one decimal point more than in April,
principally because of the hike in electricity
prices.
Financing the public debt 2015 (Bank of
Spain)
In 2015, the volume of issued sovereign debt
(237.424.7 million euros) was steady in com-
parison with 2014, chiefly in one-year treas-
ury bills (52,235.6 million euros) and ten-year
government bonds (48,443.4 million).
In 2015, non-residents of Spain held 50.9% of
these bonds, up from the 47.1% of 2014.
The average cost of financing in 2015 was
0.8% as against 1.46% in 2014.
-8
-6
-4
-2
0
2
4
6
1Q 2007 3Q 2008 1Q 2010 3Q 2011 1Q 2013 3Q 2014 1Q 2016
GDP (annual change) and contribution to domestic
and external demand (pp)
Domestic demand External demand GDP
Source: Círculo de Empresarios, based on data from INE and BdE, 2016
16,393,866
17,661,840
4,763,680
3,891,403
0
1.000.000
2.000.000
3.000.000
4.000.000
5.000.000
6.000.000
16.000.000
16.500.000
17.000.000
17.500.000
18.000.000
18.500.000
19.000.000
19.500.000
20.000.000
2007
2008
2009
2010
2011
2012
2013
2014
2015
ene.-16
feb.-16
mar.-16
abr.-16
may.-16
Affiliates
Evolutionof affiliatesto Social Security and
registered unemployment
Persons Affiliates Unemployed
UnemployedSource: Círculo de Empresarios based on data from
Ministry of Employment and Social Security, June 2016
-1.3
-1.1
-0.7
-0.6
-0.2
0.1 0.1
-0.4
-0.9
-0.7
-0.3
0.0
-0.3
-0.8
-0.8
-1.1
-1.0
January(2015)
February
March
April
May
June
July
August
September
October
November
December
January(2016)
February
March
April
May
Annual change of CPI
%
Source:Círculo de Empresarios,basedon data from INE, 2016
Así está…
The economy
2. ‘Así está…The economy’, a publication of the Círculo de Empresarios produced by its Department of the Economy, contains information and
opinion from reliable sources. However the Círculo de Empresarios does not guarantee its accuracy and does not take responsibility for any
errors or omissions. This document is merely informative. As a result, the Círculo de Empresarios is not responsible for any uses that may be
made of the publication. The opinions and estimates of the Department can be modified without any warning.
www.circulodeempresarios.org
EUROPEAN UNION
GDP 1Q 2016 (INE)
In the 1Q of 2016, the EU registered a quarter-
ly growth of 0.5%, while in the Eurozone it
was 0.6% (vs. 0.5% and 0.4%, respectively, in
the 4Q of 2015). The figures among Member
States continue to vary greatly.
Unemployment, April 2016 (Eurostat)
In the Eurozone unemployment was at 10.2%
(vs. 11% in April 2015), the lowest rate since
August of 2011, while in the EU it was re-
duced to 8.7% (vs. 9.6%).
The lowest levels were in the Czech Republic
(4.1%), Germany (4.2%) and Malta (4.3%), in
sharp contrast with Spain (20.1%).
Consumer Price Index 2016
Projected inflation for May in the Eurozone
increases a decimal point to -0.1%, principally
because of higher prices in the services sector
and a lower drop in energy prices.
For 2016, the ECB has raised its estimate a
decimal point to 0.2% because of the upturn
in petroleum prices. Predicted inflation is
1.3% in 2017 and 1.6% in 2018.
Brexit
According to the latest polls (YouGov, 06/06),
43% of Britons are in favor of leaving the EU
(vs. 42% against it - 15% don't know).
Should the UK leave Europe, the British
Treasury foresees three possible scenarios.
INTERNATIONAL
Predictions 2016-2017 (OECD)
The OECD forecasts a slight recovery in
growth and world trade during the second
half of 2016 and in 2017.
The World Bank has reduced its forecast for
2016 by 5 decimal points to 2,4% (2.8% in
2017 and 3% in 2018).
USA and Japan
Growth in GDP for 1Q 2016. In the USA it
grew 0.2% quarter-on-quarter and 2.0% year-
on-year (Bureau of Economic Analysis). In
Japan it increased 0.4% quarter-on-quarter
(0% year-on-year) because of growth in the
overseas sector.
CPI April. In the USA it was at 1.1%, two
decimal points more than in March. (La
Caixa). In Japan it continued to be negative,
while underlying inflation the (not counting
food or energy) rose slightly, to 0.7% year-on-
year (La Caixa).
Emerging economies
Expectations continue to improve about their
development because of stable raw materials
prices and an expected new rise in the Fed’s
interest rates.
-0,4
-0,2
0
0,2
0,4
0,6
0,8
GDP Growth
%
4Q 2015 1Q 2016
Source: Círculo de Empresarios, based on data from Eurostat, 2016
Drop of GDP
2015-2030 (%)
Loss of GDP per
capita 2030
EEA1
3.4 → 4.3 2.600 ₤/annual
Trade agreement2
4.6 → 7.8 4.300 ₤/annual
WTO3
5.4 → 9.5 5.200 ₤/annual
Source: UK Treasury, April 2016
Notes: 1. Membership in the Europen Economic Area;
2. Establish a trade agreement like Canada;
3. Membership in the Word Trade Organization.
GDP growth (%)
2016 2017
World 3.0 3.3
OECD 1.8 2.1
USA 1.8 2.2
UK 1.7 2.0
Euro area 1.6 1.7
Germany 1.6 1.7
France 1.4 1.5
Italy 1.0 1.4
Spain 2.8 2.3
Japan 0.7 0.4
China 6.5 6.2
Source: OECD, 2016
4
4.2
4.9
2.6
3
4
2015 2016 2017
GDP Growth Emerging countries
Emerging countries without China
Source:Bank of America MerryLinch, 2016
4.3
3.7
3.5
5.8
5
4.8
2015 2016 2017
Inflation Emerging countries
Emerging countries without China
Source:Bank of America MerryLinch, 2016