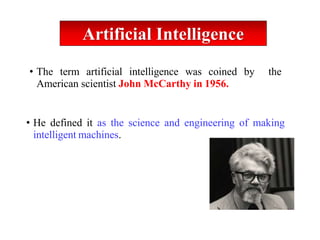
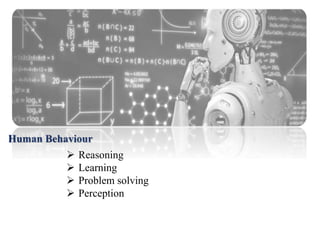
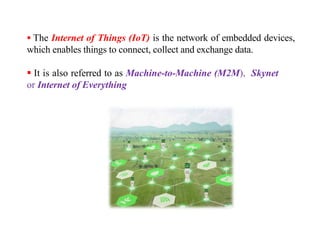
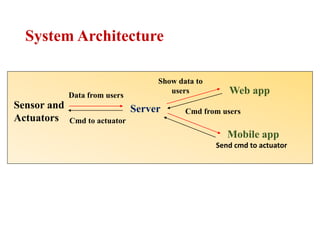
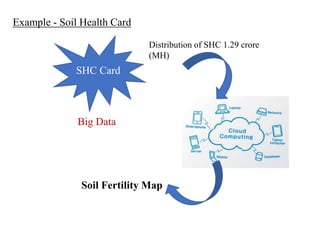
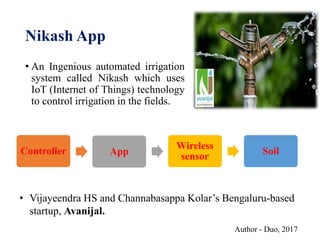
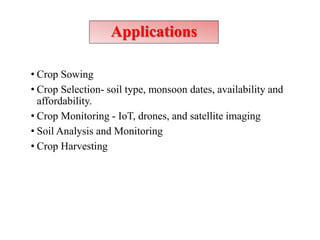
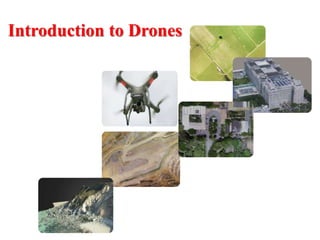
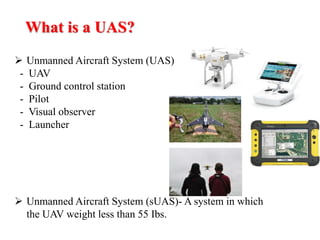
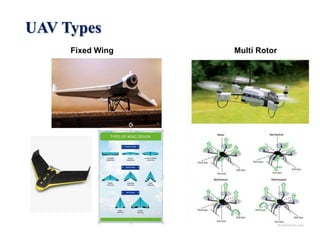
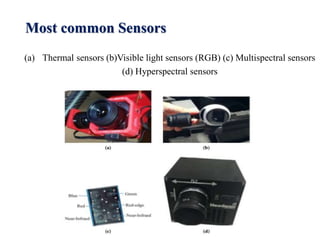
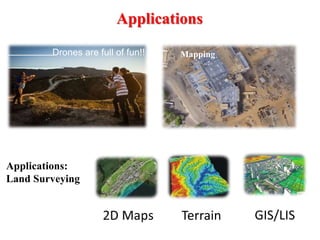
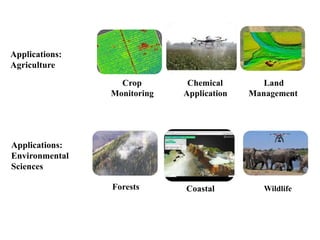
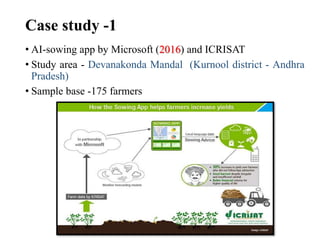
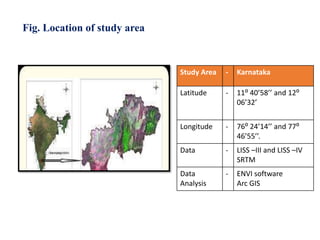
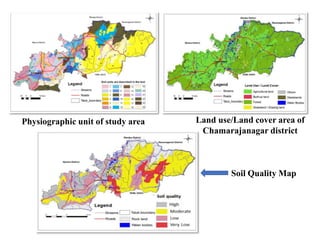
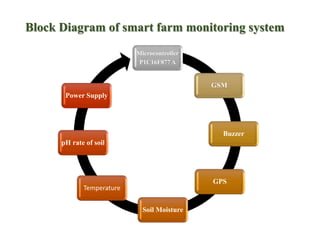
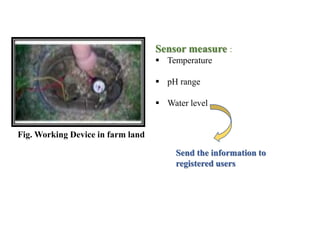
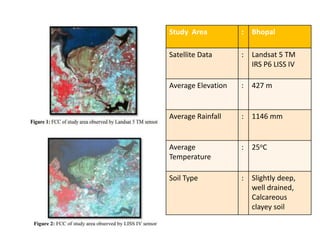
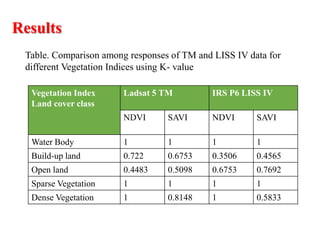
welcome
Use of Artificial Intelligence and Internet of
Things in Soil Science
Presented by,
Miss. Amruta D. Raut
Reg. no. Ph.D 2018/20
Seminar Incharge
Dr. B. D. Bhakare
Head
Department of Soil Science and
Agril. Chemistry
Outline of Presentation
1. Preamble
2. What is Artificial Intelligence
3. What is IoT
4. Importance of AI in IoT
5. Introduction to Drone or UAV
6. Application areas
7. Case Study
8. Conclusions
 Being one of the oldest sectors and the backbone of the country,
developing the Agriculture industry has been a huge concern for the
Indian government.
 A lot of factors such as Climate change,
Population growth, and
Food security concerns
Preamble
 Artificial intelligence (AI) being a game-changer in other industries,
the Indian government has realised the importance and started to hold
this technology in developing the sector.
 NITI Aayog - A National Strategy for Artificial Intelligence in India.
Aim - focusing on economic growth and social inclusion.
According to Agriculture Secretary Sanjay Aggarwal,
“AI and big data are going to be a game-changer in the agriculture
sector and the government is aiming to collate about 80% of such
data by 2020.”
• The term artificial intelligence was coined by the
American scientist John McCarthy in 1956.
• He defined it as the science and engineering of making
intelligent machines.
Artificial Intelligence
Human Behaviour
 Reasoning
 Learning
 Problem solving
 Perception
Internet of Things (IoT)
 The Internet of Things (IoT) is the network of embedded devices,
which enables things to connect, collect and exchange data.
 It is also referred to as Machine-to-Machine (M2M), Skynet
or Internet of Everything
System Architecture
Data from users
Cmd to actuator
Server
Show data to
users
Cmd from users
Mobile app
Web app
Send cmd to actuator
Sensor and
Actuators
Internet of Things
Huge amount of data
Artificial Intelligence algorithum
Data into useful actionable results
IoT devices
Importance of AI in IoT
3
4
5
2
1
Example - Soil Health Card
Big Data
SHC Card
Distribution of SHC 1.29 crore
(MH)
Soil Fertility Map
Maciej Kranz, Vice President of Corporate Strategic Innovation at
Cisco.
“Without AI-powered analytics, IoT devices and the data they produce
throughout the network would have limited value.
Artificial Intelligence and the Internet of Things is like a match made in Tech Heaven!!
Nikash App
• An Ingenious automated irrigation
system called Nikash which uses
IoT (Internet of Things) technology
to control irrigation in the fields.
Author - Duo, 2017
Controller App
Wireless
sensor
Soil
• Vijayeendra HS and Channabasappa Kolar’s Bengaluru-based
startup, Avanijal.
Applications
• Crop Sowing
• Crop Selection- soil type, monsoon dates, availability and
affordability.
• Crop Monitoring - IoT, drones, and satellite imaging
• Soil Analysis and Monitoring
• Crop Harvesting
Introduction to Drones
UAVs or Drones
 The Flying Robots
 No on-board pilot
 Remotely controlled, semi-autonomous or autonomous
or combination
What is a UAS?
 Unmanned Aircraft System (UAS)
- UAV
- Ground control station
- Pilot
- Visual observer
- Launcher
 Unmanned Aircraft System (sUAS)- A system in which
the UAV weight less than 55 Ibs.
UAV Types
Fixed Wing Multi Rotor
Most common Sensors
(a) Thermal sensors (b)Visible light sensors (RGB) (c) Multispectral sensors
(d) Hyperspectral sensors
Most Common software tool for image
processing
• QGIS
• ArcGIS
• Pix4D
• ERDAS
• MATLAB
• Adobe photoshop
• Agisoft Photoscan
Drones are full of fun!!
Applications
Mapping
Terrain GIS/LIS
Applications:
Land Surveying
Applications:
Agriculture
Crop
Monitoring
Chemical
Application
Land
Management
Applications:
Environmental
Sciences
Forests Coastal Wildlife
Limitation
 Skilled and expert person
 High Investment Cost
 Large cultivated area
 Government rules and regulation
Case study -1
• AI-sowing app by Microsoft (2016) and ICRISAT
• Study area - Devanakonda Mandal (Kurnool district - Andhra
Pradesh)
• Sample base -175 farmers
• In 2017, Same project expanded to 3000 farmers of
Karnataka and Andhra Pradesh during Kharif cycle
Crops include Groundnut, Ragi, Maize, Rice, and
Cotton, among others.
Case study -2
Soil Analysis and Monitoring
Study area - Raleigh, North Carolina, USA
(Sennaar et al., 2019)
Huge efficiency in the gains of agro-inputs by cutting the use of
chemical feritilizer nearly 40%.
The spatial analysis capabilities of GIS technologies helps in
efficient water management during irrigation.
Study area - Alfalfa (Riverdale, California)
(Fictchett et al., 2013)
 GIS technologies in irrigation helped increase the per acre
crop output by up to 37.5%, and reduced water usage by
20%.
Source : AI in Agriculture
Case Study - 3
Crop Harvesting
• AI-enabled robots are being widely deployed on tomato
farms in Japan, and have reduced the on-field labour time by
20%
Case study - 4
IoT Enabled Soil Testing
(Department of computer science, mahe, MH, India and Tamilnadu)
Author - Sindhu P. and Indirani et al., (2018)
Fig. Block Diagram of Proposed System
NODE MCU
1.0
(ESP826612E)
wifi shield
Soil
Moisture
sensor
Humidity
sensor
Internet
Fig. Connection Diagram
Data IoT cloud server
(Thinkspeak.com) displayed data with
correct time and place.
Fig. Prototype of system
Arduino IDE is for wrting code.
Result
Data store in cloud cover. Graph
plotted in think speak as per
variation moisture, temperature and
Humidity level in soil.
Implementing this system will allow
users like farmers to monitor and
improve the productivity of the
crops.
Case study - 5
Monitoring of crop fields using multispectral and thermal
imagery from UAV
Author - Raeva et al., (2018)
Study area of Vysoke
Sensor : Multispectral and
Thermal sensor
Flight of
Drone
: Every month August to
April 2016
Drone : SenseFly fixed-wing
drone eBee
Software : Pix4D mapper
Fig. Barley: NDVI maps, May-July, 2016.
Fig. Barley: NDRE maps, May-July, 2016.
Index map
1. NDVI = NIR – RED/ NIR + RED
2. NDRE = NIR – RED edge / NIR + Red
edge
Case study -6
Use of vegetation index and meteorological parameters for the
prediction of crop yield in India
Author – Prasad et al., (2014)
Study Area :MaharashtraFig. Flow chart showing steps in building the crop yield prediction
model for wheat
Iterative and non linear quasi-newton
multivariate optimization for all variable
Loss function is least square i.e. Lf = (observed – Predicted)
Table. Prediction of crop yield for the years 1999,1998 and 1997
Equation
Maharashta (Rabi seaon)
Predicted(kg/ha) Observed(kg/ha)
b(1999) 1198.2 1288
b(1998) 1291.6 898
b(1997) 1164.1 1460
Case study-7
Application of Satellite Remote Sensing to find Soil Fertilization
by using Soil Colour
Author - Kumar et al., (2013)
Satellite Data - Landsat 8
Lattitute - 12° 20’ to 13° 20’
Longitude - 78° 10’ to 79° 40’
Location of Study Area (Vellore District)
Framework of soil identification method
using remote sensing
Landsat 8
Pre-processing
techniques
K- means Clustering
Image segmentation
Correlation
Soil Identification by colour
model
Processing
Soil Types in
Vellore District
Case study- 8
Assessment of Soil Quality by Using Remote Sensing and GIS
Techniques
Author - Mohamed et al., (2018)
Fig. Location of study area
Study Area - Karnataka
Latitude - 11⁰ 40’58’’ and 12⁰
06’32’
Longitude - 76⁰ 24’14’’ and 77⁰
46’55’’.
Data - LISS –III and LISS –IV
SRTM
Data
Analysis
- ENVI software
Arc GIS
Physiographic unit of study area Land use/Land cover area of
Chamarajanagar district
Soil Quality Map
Case study - 9
Smart System Monitoring on Soil Using Internet of Things
(Vivekanandha College of Engineering for Women, Tamilnadu, India)
Author – Sowmiya et al., (2017)
Block Diagram of smart farm monitoring system
Microcontroller
P1C16F877 A
GSM
Buzzer
GPS
Soil Moisture
Temperature
pH rate of soil
Power Supply
Fig. Working Device in farm land
Sensor measure :
 Temperature
 pH range
 Water level
Send the information to
registered users
Case study - 10
Performance evaluation of vegetation indices using remotely
sensed data
Author- Joshi and Chandra et al., (2001)
Study Area : Bhopal
Satellite Data : Landsat 5 TM
IRS P6 LISS IV
Average Elevation : 427 m
Average Rainfall : 1146 mm
Average
Temperature
: 25oC
Soil Type : Slightly deep,
well drained,
Calcareous
clayey soil
ERDAS Software Start ERDAS Imaging
Open the image in ERDAS and subset the study area
Georeferencing subset image using SOI Toposheet 55 E/8
Generate the Vis models for for both TM and LISS IV
data using modeler in ERDAS
Using Pseudo image of VIs image identify ranges of
land cover classes
Classify the data using Knowledge engineer classify
in ERDAS based on ranges for land cover classes
Range
==
Land cover
classes
Identify Pixels and assign class
Classified map with assign classes
Undefined pixels
Unsupervised class
Analysis
Results
Vegetation Index
Land cover class
Ladsat 5 TM IRS P6 LISS IV
NDVI SAVI NDVI SAVI
Water Body 1 1 1 1
Build-up land 0.722 0.6753 0.3506 0.4565
Open land 0.4483 0.5098 0.6753 0.7692
Sparse Vegetation 1 1 1 1
Dense Vegetation 1 0.8148 1 0.5833
Table. Comparison among responses of TM and LISS IV data for
different Vegetation Indices using K- value
Conclusions
1. AI in crop sowing has the potential to increase per acre crop
output as well as decrease input costs for farmers, analysing and
monitoring soil health helps to improve the sustainability of a
given piece of arable land and also it save the resources of
labour and time for farmers
2. IoT helps farmers to monitor and improve the productivity of
the crops.
3. Remote sensing technology helps in mapping, land use/land
cover changes, vegetation indices, also in predicting crop yield.
4. Drone play important role in precision farming like in mapping,
vegetation indices.
Thank You

Artificial Intelligence and IoT's

  • 1.
  • 2.
    Use of ArtificialIntelligence and Internet of Things in Soil Science Presented by, Miss. Amruta D. Raut Reg. no. Ph.D 2018/20 Seminar Incharge Dr. B. D. Bhakare Head Department of Soil Science and Agril. Chemistry
  • 3.
    Outline of Presentation 1.Preamble 2. What is Artificial Intelligence 3. What is IoT 4. Importance of AI in IoT 5. Introduction to Drone or UAV 6. Application areas 7. Case Study 8. Conclusions
  • 4.
     Being oneof the oldest sectors and the backbone of the country, developing the Agriculture industry has been a huge concern for the Indian government.  A lot of factors such as Climate change, Population growth, and Food security concerns Preamble
  • 5.
     Artificial intelligence(AI) being a game-changer in other industries, the Indian government has realised the importance and started to hold this technology in developing the sector.  NITI Aayog - A National Strategy for Artificial Intelligence in India. Aim - focusing on economic growth and social inclusion. According to Agriculture Secretary Sanjay Aggarwal, “AI and big data are going to be a game-changer in the agriculture sector and the government is aiming to collate about 80% of such data by 2020.”
  • 6.
    • The termartificial intelligence was coined by the American scientist John McCarthy in 1956. • He defined it as the science and engineering of making intelligent machines. Artificial Intelligence
  • 7.
    Human Behaviour  Reasoning Learning  Problem solving  Perception
  • 8.
  • 9.
     The Internetof Things (IoT) is the network of embedded devices, which enables things to connect, collect and exchange data.  It is also referred to as Machine-to-Machine (M2M), Skynet or Internet of Everything
  • 10.
    System Architecture Data fromusers Cmd to actuator Server Show data to users Cmd from users Mobile app Web app Send cmd to actuator Sensor and Actuators
  • 11.
    Internet of Things Hugeamount of data Artificial Intelligence algorithum Data into useful actionable results IoT devices Importance of AI in IoT 3 4 5 2 1
  • 12.
    Example - SoilHealth Card Big Data SHC Card Distribution of SHC 1.29 crore (MH) Soil Fertility Map
  • 13.
    Maciej Kranz, VicePresident of Corporate Strategic Innovation at Cisco. “Without AI-powered analytics, IoT devices and the data they produce throughout the network would have limited value. Artificial Intelligence and the Internet of Things is like a match made in Tech Heaven!!
  • 14.
    Nikash App • AnIngenious automated irrigation system called Nikash which uses IoT (Internet of Things) technology to control irrigation in the fields. Author - Duo, 2017 Controller App Wireless sensor Soil • Vijayeendra HS and Channabasappa Kolar’s Bengaluru-based startup, Avanijal.
  • 15.
    Applications • Crop Sowing •Crop Selection- soil type, monsoon dates, availability and affordability. • Crop Monitoring - IoT, drones, and satellite imaging • Soil Analysis and Monitoring • Crop Harvesting
  • 16.
  • 17.
    UAVs or Drones The Flying Robots  No on-board pilot  Remotely controlled, semi-autonomous or autonomous or combination
  • 18.
    What is aUAS?  Unmanned Aircraft System (UAS) - UAV - Ground control station - Pilot - Visual observer - Launcher  Unmanned Aircraft System (sUAS)- A system in which the UAV weight less than 55 Ibs.
  • 19.
  • 20.
    Most common Sensors (a)Thermal sensors (b)Visible light sensors (RGB) (c) Multispectral sensors (d) Hyperspectral sensors
  • 21.
    Most Common softwaretool for image processing • QGIS • ArcGIS • Pix4D • ERDAS • MATLAB • Adobe photoshop • Agisoft Photoscan
  • 22.
    Drones are fullof fun!! Applications Mapping Terrain GIS/LIS Applications: Land Surveying
  • 23.
  • 24.
    Limitation  Skilled andexpert person  High Investment Cost  Large cultivated area  Government rules and regulation
  • 25.
    Case study -1 •AI-sowing app by Microsoft (2016) and ICRISAT • Study area - Devanakonda Mandal (Kurnool district - Andhra Pradesh) • Sample base -175 farmers
  • 26.
    • In 2017,Same project expanded to 3000 farmers of Karnataka and Andhra Pradesh during Kharif cycle Crops include Groundnut, Ragi, Maize, Rice, and Cotton, among others.
  • 27.
    Case study -2 SoilAnalysis and Monitoring Study area - Raleigh, North Carolina, USA (Sennaar et al., 2019) Huge efficiency in the gains of agro-inputs by cutting the use of chemical feritilizer nearly 40%. The spatial analysis capabilities of GIS technologies helps in efficient water management during irrigation.
  • 28.
    Study area -Alfalfa (Riverdale, California) (Fictchett et al., 2013)  GIS technologies in irrigation helped increase the per acre crop output by up to 37.5%, and reduced water usage by 20%. Source : AI in Agriculture
  • 29.
    Case Study -3 Crop Harvesting • AI-enabled robots are being widely deployed on tomato farms in Japan, and have reduced the on-field labour time by 20%
  • 30.
    Case study -4 IoT Enabled Soil Testing (Department of computer science, mahe, MH, India and Tamilnadu) Author - Sindhu P. and Indirani et al., (2018)
  • 31.
    Fig. Block Diagramof Proposed System NODE MCU 1.0 (ESP826612E) wifi shield Soil Moisture sensor Humidity sensor Internet Fig. Connection Diagram Data IoT cloud server (Thinkspeak.com) displayed data with correct time and place.
  • 32.
    Fig. Prototype ofsystem Arduino IDE is for wrting code. Result Data store in cloud cover. Graph plotted in think speak as per variation moisture, temperature and Humidity level in soil. Implementing this system will allow users like farmers to monitor and improve the productivity of the crops.
  • 33.
    Case study -5 Monitoring of crop fields using multispectral and thermal imagery from UAV Author - Raeva et al., (2018)
  • 34.
    Study area ofVysoke Sensor : Multispectral and Thermal sensor Flight of Drone : Every month August to April 2016 Drone : SenseFly fixed-wing drone eBee Software : Pix4D mapper
  • 35.
    Fig. Barley: NDVImaps, May-July, 2016.
  • 36.
    Fig. Barley: NDREmaps, May-July, 2016. Index map 1. NDVI = NIR – RED/ NIR + RED 2. NDRE = NIR – RED edge / NIR + Red edge
  • 37.
    Case study -6 Useof vegetation index and meteorological parameters for the prediction of crop yield in India Author – Prasad et al., (2014)
  • 38.
    Study Area :MaharashtraFig.Flow chart showing steps in building the crop yield prediction model for wheat Iterative and non linear quasi-newton multivariate optimization for all variable Loss function is least square i.e. Lf = (observed – Predicted)
  • 39.
    Table. Prediction ofcrop yield for the years 1999,1998 and 1997 Equation Maharashta (Rabi seaon) Predicted(kg/ha) Observed(kg/ha) b(1999) 1198.2 1288 b(1998) 1291.6 898 b(1997) 1164.1 1460
  • 40.
    Case study-7 Application ofSatellite Remote Sensing to find Soil Fertilization by using Soil Colour Author - Kumar et al., (2013)
  • 41.
    Satellite Data -Landsat 8 Lattitute - 12° 20’ to 13° 20’ Longitude - 78° 10’ to 79° 40’ Location of Study Area (Vellore District) Framework of soil identification method using remote sensing Landsat 8 Pre-processing techniques K- means Clustering Image segmentation Correlation Soil Identification by colour model Processing
  • 42.
  • 43.
    Case study- 8 Assessmentof Soil Quality by Using Remote Sensing and GIS Techniques Author - Mohamed et al., (2018)
  • 44.
    Fig. Location ofstudy area Study Area - Karnataka Latitude - 11⁰ 40’58’’ and 12⁰ 06’32’ Longitude - 76⁰ 24’14’’ and 77⁰ 46’55’’. Data - LISS –III and LISS –IV SRTM Data Analysis - ENVI software Arc GIS
  • 45.
    Physiographic unit ofstudy area Land use/Land cover area of Chamarajanagar district Soil Quality Map
  • 46.
    Case study -9 Smart System Monitoring on Soil Using Internet of Things (Vivekanandha College of Engineering for Women, Tamilnadu, India) Author – Sowmiya et al., (2017)
  • 47.
    Block Diagram ofsmart farm monitoring system Microcontroller P1C16F877 A GSM Buzzer GPS Soil Moisture Temperature pH rate of soil Power Supply
  • 48.
    Fig. Working Devicein farm land Sensor measure :  Temperature  pH range  Water level Send the information to registered users
  • 49.
    Case study -10 Performance evaluation of vegetation indices using remotely sensed data Author- Joshi and Chandra et al., (2001)
  • 50.
    Study Area :Bhopal Satellite Data : Landsat 5 TM IRS P6 LISS IV Average Elevation : 427 m Average Rainfall : 1146 mm Average Temperature : 25oC Soil Type : Slightly deep, well drained, Calcareous clayey soil
  • 51.
    ERDAS Software StartERDAS Imaging Open the image in ERDAS and subset the study area Georeferencing subset image using SOI Toposheet 55 E/8 Generate the Vis models for for both TM and LISS IV data using modeler in ERDAS Using Pseudo image of VIs image identify ranges of land cover classes Classify the data using Knowledge engineer classify in ERDAS based on ranges for land cover classes Range == Land cover classes Identify Pixels and assign class Classified map with assign classes Undefined pixels Unsupervised class Analysis
  • 52.
    Results Vegetation Index Land coverclass Ladsat 5 TM IRS P6 LISS IV NDVI SAVI NDVI SAVI Water Body 1 1 1 1 Build-up land 0.722 0.6753 0.3506 0.4565 Open land 0.4483 0.5098 0.6753 0.7692 Sparse Vegetation 1 1 1 1 Dense Vegetation 1 0.8148 1 0.5833 Table. Comparison among responses of TM and LISS IV data for different Vegetation Indices using K- value
  • 53.
    Conclusions 1. AI incrop sowing has the potential to increase per acre crop output as well as decrease input costs for farmers, analysing and monitoring soil health helps to improve the sustainability of a given piece of arable land and also it save the resources of labour and time for farmers 2. IoT helps farmers to monitor and improve the productivity of the crops. 3. Remote sensing technology helps in mapping, land use/land cover changes, vegetation indices, also in predicting crop yield. 4. Drone play important role in precision farming like in mapping, vegetation indices.
  • 54.