SlideShare a Scribd company logo
1 of 431
Arterial Destiffening With Weight Loss in Overweight and
Obese
Middle-Aged and Older Adults
A. Laura Dengo, Elizabeth A. Dennis, Jeb S. Orr, Elaina L.
Marinik, Elizabeth Ehrlich,
Brenda M. Davy, and Kevin P. Davy
From the Human Integrative Physiology Laboratory, Department
of Human Nutrition, Foods, and
Exercise, Virginia Polytechnic Institute and State University,
Blacksburg, Va.
Abstract
We tested the hypothesis that weight loss via a hypocaloric diet
would reduce arterial stiffness in
overweight and obese middle-aged and older adults. Thirty-six
individuals were randomly
assigned to a weight loss (n=25; age: 61.2±0.8 years; body mass
index: 30.0±0.6 kg/m2) or a
control (n=11; age: 66.1±1.9 years; body mass index: 31.8±1.4
kg/m2) group. Arterial stiffness
was measured via carotid artery ultrasonography combined with
applanation tonometry and
carotid-femoral pulse wave velocity via applanation tonometry
at baseline and after the 12-week
intervention. Body weight, body fat, abdominal adiposity, blood
pressure, β-stiffness index, and
carotid-femoral pulse wave velocity were similar in the 2
groups at baseline (all P>0.05). Body
weight (−7.1±0.7 versus −0.7±1.1 kg), body fat, and abdominal
adiposity decreased in the weight
loss group but not in the control group (all P<0.05). Brachial
systolic and diastolic blood pressures
declined (P<0.05) only in the weight loss group. Central
systolic and pulse pressures did not
change significantly in either group. β-Stiffness index
(−1.24±0.22 versus 0.52±0.37 U) and
carotid-femoral pulse wave velocity (−187±29 versus 15±42
cm/s) decreased in the weight loss
group but not in the control group (all P<0.05). The reductions
in carotid-femoral pulse wave
velocity were correlated with reductions in total body and
abdominal adiposity (r=0.357– 0.602;
all P<0.05). However, neither total body nor abdominal
adiposity independently predicted
reductions in arterial stiffness indices. In summary, our findings
indicate that weight loss reduces
arterial stiffness in overweight/obese middle-aged and older
adults, and the magnitudes of these
improvements are related to the loss of total and abdominal
adiposity.
Keywords
arterial structure; arterial compliance; aging; pulse wave
velocity; caloric restriction
Advancing age is associated with stiffening of the large elastic
arteries of the cardiothoracic
region.1,2 Total body and abdominal adiposity increase with
advancing age,3 and excess fat
accumulation, particularly in the abdominal visceral region, is
associated with accelerated
large artery stiffening in middle-aged and older adults.4,5
Importantly, large artery stiffening
contributes to the age-related rise in systolic blood pressure
(BP; SBP)6 and is an
independent predictor of total and cardiovascular mortality
among older adults.7
© 2010 American Heart Association, Inc.
Correspondence to Kevin P. Davy, Human Integrative
Physiology Laboratory, Department of Human Nutrition, Foods,
and Exercise,
Virginia Polytechnic Institute and State University, Blacksburg,
VA 24061. [email protected]
Disclosures
None.
NIH Public Access
Author Manuscript
Hypertension. Author manuscript; available in PMC 2011 April
1.
Published in final edited form as:
Hypertension. 2010 April ; 55(4): 855–861.
doi:10.1161/HYPERTENSIONAHA.109.147850.
N
IH
-P
A
A
uthor M
anuscript
N
IH
-P
A
A
uthor M
anuscript
N
IH
-P
A
A
uthor M
anuscript
The results of several studies suggest that weight loss may be
efficacious in reducing large
artery stiffness in the cardiothoracic region.8–12 To date, only
1 randomized, controlled trial
has been conducted to address this issue.8 Balkestein et al8
reported that weight loss
increased carotid artery distensibility and that exercise did not
result in an additive effect.
However, the lack of an adequate control group, small sample
size, and focus on primarily
young and middle-aged males limits generalizability and
precludes a clear understanding of
the impact of weight loss on arterial stiffness. This is a critical
void given that weight loss is
the cornerstone of obesity management and there are currently
few strategies available for
reducing arterial stiffness. Accordingly, we tested the
hypothesis that weight loss via a
hypocaloric diet alone would reduce arterial stiffness in
overweight and obese middle-aged
and older adults. We further hypothesized that the reduction in
arterial stiffness with weight
loss, if observed, would be associated with the magnitude of
reduction in total body or
abdominal adiposity.
Methods
Subjects
Thirty-six men (n=15) and women (n=21) 55 to 75 years of age
volunteered to participate in
the study. All of the subjects were sedentary to recreationally
active and free of overt
disease. None of the subjects were smokers or taking
medications that affect body weight or
appetite. The Virginia Polytechnic Institute and State University
Institutional Review Board
approved the protocol. The nature, purpose, risks, and benefits
were explained to each
subject before obtaining informed consent.
Intervention
After baseline testing, subjects were randomly assigned to a
weight loss (n=25) intervention
or a control group (n=11). The subjects randomized to the
weight loss intervention followed
a hypocaloric diet (1200 to 1500 kcal) based on the US
Department of Agriculture food
guide pyramid guidelines10 and were instructed to maintain
their habitual physical activity
level. The control group was instructed to maintain their current
body weight, habitual
physical activity level, and dietary intake. During the 12-week
weight loss intervention
period, subjects met with a dietitian and had their body weight
measured weekly. Each
subject was weight stable for ≥2 weeks before follow-up testing.
All of the measurements
were performed between 8:00 AM and 11:00 AM after a 12-hour
fast and having performed no
vigorous physical activity for the previous 48 hours. All of the
subjects reported being free
of acute illness during the week before testing.
Measurements
Body weight was measured to the nearest 0.1 kg on a digital
scale (Scale-Tronix model
5002). Height was measured using a stadiometer. Waist
circumference was measured at the
umbilical level with a spring-loaded Gulick measuring tape.
Body composition was
determined via dual energy x-ray absorptiometry (GE Lunar
Prodigy Advance, software
version 8.10e). Abdominal fat distribution was measured using
computed tomography
(HiSpeed CT/I, GE Medical), as described previously.13 Total,
subcutaneous, and visceral
fat areas were quantified using commercially available software
(SliceOmatic, version 4.3,
Tomovision). Resting heart rate was obtained from lead II of an
ECG. Habitual dietary
intake and physical activity were assessed via self-reported 4-
day food intake records and
accelerometry (GT1M, Actigraph Inc), respectively. Energy and
macronutrient intake were
assessed using nutritional analysis software (NDS-R 6.0,
University of Minnesota). Plasma
lipid and lipoprotein concentrations were measured in a
commercial laboratory using
conventional methods. Plasma glucose concentration was
measured using a YSI glucose
Dengo et al. Page 2
Hypertension. Author manuscript; available in PMC 2011 April
1.
N
IH
-P
A
A
uthor M
anuscript
N
IH
-P
A
A
uthor M
anuscript
N
IH
-P
A
A
uthor M
anuscript
analyzer (model 2300, Yellow Springs Instruments). Plasma
insulin concentration was
quantified using a commercially available ELISA kit (Linco
Research, Inc).
β-Stiffness index (β-SI)14 was measured as described
previously.15,16 Briefly, left common
carotid artery diameters were obtained 1 to 2 cm from the
carotid bulb with an ultrasound
unit equipped with a high-resolution linear array transducer (3
to 11 MHz). Systolic and
diastolic carotid diameters were quantified offline using
commercially available software
(Vascular Research Tools 5, Medical Imaging Applications,
LLC). Carotid waveforms were
obtained using applanation tonometry of the contralateral
common carotid artery and
calibrated to brachial diastolic BP (DBP) and mean arterial BP
obtained by automated
sphygmomanometry in the supine posture. Brachial pulse
pressure (PP) was calculated as
the difference between SBP and DBP. Central SBP and PP were
obtained from the peak and
the difference between the peak and nadir of the calibrated
waveform, respectively.
Amplifications of SBP and PP were calculated as the difference
between central and
brachial SBP and PP, respectively.
Carotid-femoral (C–F) pulse wave velocity (PWV)
measurements were obtained after 20
minutes of quiet rest in the supine position, as described
previously.16 Pulse waveforms
were obtained via applanation tonometry (Probe SPT-301,
Millar Instruments) and recorded
simultaneously at the right C–F arteries. The linear distance
between the carotid and femoral
arteries at the highest point on the patient between the recording
sites was measured with a
tape measure to the nearest 0.5 cm. The C–F distance did not
change (P>0.05) with the
weight loss intervention, and the baseline and postinterventions
distances were highly
correlated (Spearman ρ=0.886; P<0.05). In addition, the effects
of weight loss on C–F PWV
were virtually identical when the postintervention distance was
substituted for the baseline
distance in the calculation of baseline C–F PWV (data not
shown). C–F recordings of
waveforms over 10 to 20 cardiac cycles were analyzed using
signal processing software
(Windaq, Dataq Instruments). PWV was calculated by dividing
travel distance by travel
time from foot to foot of the pulse waves. Although C–F PWV
is a close surrogate for aortic
PWV, we also report estimated aortic PWV using the equation
developed by Vermeersch et
al17 for comparison.
Statistical Analysis
Independent sample t tests were used to compare subject
characteristics and dependent
variables at baseline in the weight loss and control groups. χ2
analysis was used to compare
the overall frequency of medication use between the 2 groups.
Repeated-measures ANOVA
was used to compare changes in subject characteristics and
dependent variables over time
between the 2 groups. Our study was not powered to test sex
differences. As such, the
pooled data are presented. Simple correlations were performed
to assess relations among
variables of interest. Linear regression was used to test the
independent effects of measures
of total body and abdominal adiposity on the reduction in
arterial stiffness (C–F PWV).
Furthermore, a test of mediation using linear regression was
used to determine whether the
change in C–F PWV with treatment was mediated by the
reduction in mean BP.18 Mediation
would be supported if weight loss significantly predicted the
change in C–F PWV, weight
loss significantly predicted the change in mean BP, and mean
BP significantly predicted C–
F PWV. This approach was also used to determine whether the
change in C–F PWV with
treatment was mediated by the reduction in sodium intake. All
of the data are expressed as
mean±SE. The significance level was set a priori at the P<0.05
level.
Results
Subject characteristics at baseline and after the intervention are
shown in Table 1. There
were no significant differences in body weight, body
composition, abdominal fat
Dengo et al. Page 3
Hypertension. Author manuscript; available in PMC 2011 April
1.
N
IH
-P
A
A
uthor M
anuscript
N
IH
-P
A
A
uthor M
anuscript
N
IH
-P
A
A
uthor M
anuscript
distribution, BP, or lipid and lipoprotein concentrations between
the 2 groups at baseline.
Plasma glucose and insulin concentrations were also similar
(P>0.05) in the 2 groups. Body
weight decreased (−7.1±0.7 versus −0.7±0.4 kg; P<0.05) after
the intervention in the weight
loss compared with the control group because of reductions in
both body fat (≤4.6±0.6
versus −0.1±0.4 kg; P<0.05) and fat free mass (−1.5±0.3 versus
0.1±0.4 kg; P<0.05; Table
1). Total abdominal fat decreased (−101±14 versus −8±13 cm2;
P<0.05) in the weight loss
group because of reductions in abdominal subcutaneous (−55±9
versus −9±14 cm2; P<0.05)
and abdominal visceral fat (−44±8 versus −3±7 cm2; P<0.05).
Brachial SBP and DBP, as
well as heart rate, decreased (P<0.05) in the weight loss group,
but no significant changes
were observed in the control group (Table 1). Central SBPs and
PPs declined in both groups,
but the magnitude of reduction did not differ significantly. SBP
and PP amplification did not
change in either group (data not shown). In addition, total
cholesterol, low-density
lipoprotein cholesterol, and triglycerides decreased only in the
weight loss group (all
P<0.05). High-density lipoprotein cholesterol did not change
(P>0.05) in either group.
Glucose (P<0.05) and insulin (P=0.05) concentrations decreased
in the weight loss group
but not in the control group.
Medication use in the 2 groups is shown in Table 2. All of the
individuals had been on their
current regiment for ≥8 months, and no changes were made
during the weight loss
intervention. None of the individuals were taking >1
medication. The frequency of
medication use did not differ between the 2 groups (P>0.05).
Habitual physical activity and dietary intake at baseline and
after the intervention are shown
in Table 3. Habitual physical activity and dietary intake were
similar (P>0.05) at baseline in
the weight loss and control groups. There was no significant
change in habitual physical
activity after the intervention in either group. Energy intake
decreased (P<0.05) after the
intervention in the weight loss group but not the control group.
There was no significant
reduction in the percentage of fat or carbohydrate intake after
the intervention. However, the
percentage of protein intake increased (P<0.05) in the weight
loss group but not the control
group. Saturated, monounsaturated, polyunsaturated, and trans-
fatty acid intake, as well as
cholesterol intake, declined (all P<0.05) in the weight loss
group, but there were no such
significant changes observed in the control group after the
intervention. Alcohol intake did
not change (P<0.05) after the intervention in either group.
Sodium and potassium intakes
decreased (P<0.05) after the intervention in both groups; the
reduction tended to be greater
in the weight loss group (both P<0.05). Magnesium intake did
not change (P>0.05) after the
intervention in either group.
β-Stiffness index, arterial compliance, and C–F PWV (and
aortic PWV) at baseline and after
the intervention are shown in Table 4. There were no
differences in these arterial stiffness
indices between the 2 groups at baseline. The reductions in β-SI
(−1.24±0.22 versus
0.52±0.37 U; Figure 1A) and C–F PWV (−187±29 versus 15±42
cm/s; Figure 1C) and
increases in arterial compliance (0.0125±0.0038 versus
−0.0056±0.0061 mm2/mm
Hg×10−1; Figure 1B) after the intervention were greater (all
P<0.05) in the weight loss
compared with the control group, respectively.
In the pooled sample, the magnitude of change in β-SI was
correlated with the percentage of
initial weight loss (Figure 2A), change in body mass index, and
change body fat percentage
(Table 5). The magnitude of change in C–F PWV was correlated
with the percentage of
initial weight loss (Figure 2B), the magnitude of reduction in
visceral fat (Figure 2C) and
waist circumference (Figure 2D), and the change in the absolute
amount of weight loss,
body mass index, body fat percentage, total fat mass, total
abdominal fat, and subcutaneous
abdominal fat (Table 5). However, linear regression analysis
revealed that only the changes
in body mass index (model 1: β=68.4; P<0.05), total weight loss
(model 2: β=21.6; P<0.05),
Dengo et al. Page 4
Hypertension. Author manuscript; available in PMC 2011 April
1.
N
IH
-P
A
A
uthor M
anuscript
N
IH
-P
A
A
uthor M
anuscript
N
IH
-P
A
A
uthor M
anuscript
percentage of weight loss (model 3: β=19.4; P<0.05), and total
fat loss (model 4: β=23.6;
P<0.05) independently predicted the reduction in C–F PWV
when indices of total and
abdominal adiposity were considered for inclusion. In addition,
the magnitude of reduction
in C–F PWV with weight loss was correlated with the changes
in triglyceride, total
cholesterol, and low-density lipoprotein cholesterol
concentrations (Table 5). The magnitude
of reduction in arterial compliance was correlated with the
change in fat free mass. There
were no other significant correlates in the magnitudes of
reduction in β-SI, arterial
compliance, or C–F PWV.
In an attempt to gain further insight into the potential impact of
BP lowering, we compared
β-SI and C–F PWV in subjects above and below the median
reduction in mean BP with
weight loss (n=12 per group for β-SI and n=11 per group for C–
F PWV). The median
reduction in mean BP for the weight loss group was −7 mm Hg.
The reductions in β-SI
(−1.20±0.28 versus −1.29±0.41 U) and C–F PWV (−198±43
versus −175±50 cm/s) were
similar in individuals with larger (−11±1 versus −4±1 mm Hg)
compared with smaller
reductions in mean BP, respectively.
In our mediation analysis (see the Statistical Analysis section),
weight loss predicted the
change in C–F PWV (β=201.68; P<0.05). However, weight loss
was not a predictor of the
change in mean BP (β=4.53; P>0.05). Therefore, mediation of
the reduction in C–F PWV
with weight loss by changes in mean BP was not supported.
The relation between change in mean arterial pressure and
change in C–F PWV in the
weight loss and control groups is shown in Figure 3. There was
no significant correlation
between change in mean arterial pressure and change in C–F
PWV in the pooled sample
(r=0.129) or among the individual groups (r=−0.17, P>0.05 and
r=0.405, P>0.05 for weight
loss and control groups, respectively).
We also compared the reduction in β-SI and C–F PWV in
subjects above (n=10 for β-SI;
n=11 for C–F PWV) and below (n=12 for β-SI; n=11 for C–F
PWV) the median reduction in
dietary sodium intake. The median reduction in dietary sodium
was −733 mg/d. There were
no differences in the magnitude of reduction in either β-SI
(−1.01±0.32 versus −1.44±0.39
U; P>0.05) or C–F PWV (−192±51 versus −157±38 cm/s;
P>0.05) in the groups. Mediation
of the change in C–F PWV with weight loss by the change in
sodium intake was not
supported by linear regression analysis.
Discussion
The major finding of the present study is that intentional weight
loss via hypocaloric diet
alone reduces arterial stiffness in overweight and obese middle-
aged and older adults. The
magnitude of this improvement in arterial stiffness was related
to the magnitude of reduction
in total body and abdominal adiposity. However, only
reductions in indices of weight loss or
total fat loss independently predicted reductions in arterial
stiffness. Importantly, the
improvement in arterial stiffness was observed with a modest
amount of weight loss, that is,
the 5% to 10% weight loss believed necessary to reduce the risk
of cardiovascular diseases.
19
Although previous studies have attempted to address this
issue,8–12 our study is the first to
demonstrate with a randomized, controlled design that
intentional weight loss via
hypocaloric diet alone (ie, without increases in physical
activity) reduces large artery
stiffness. Importantly, our findings extend the results of
previous studies to overweight and
obese middle-aged and older adults, a population with
accelerated arterial stiffening and at
increased risk of adverse cardiovascular events.
Dengo et al. Page 5
Hypertension. Author manuscript; available in PMC 2011 April
1.
N
IH
-P
A
A
uthor M
anuscript
N
IH
-P
A
A
uthor M
anuscript
N
IH
-P
A
A
uthor M
anuscript
In the present study, only reductions in indices of weight loss or
total fat loss independently
predicted reduction in arterial stiffness. As such, our results
suggest that weight loss,
irrespective of reductions in abdominal adiposity, is associated
with favorable reductions in
arterial stiffness.
The mechanisms responsible for the reduction in arterial
stiffness with weight loss observed
are not clear. However, several possibilities exist. First, it is
possible that changes in the
elastic material content of the arterial wall may have occurred
and contributed to the
reductions in arterial stiffness with weight loss. Future studies
in animal models will be
necessary to address this important issue.
Second, collagen cross-linking that occurs in large elastic
arteries as a consequence of
nonenzymatic glycation of collagen is a major cause of age-
related arterial stiffening.
Whether short-term weight loss might also reduce arterial
stiffness by reducing collagen
cross-links is unclear.
Finally, the ability to reduce arterial stiffness over a relatively
short time frame, such as
occurred in the present study, is thought to be the result of
changes in local, humoral, or
neural modulation of smooth muscle tone.20 Thus, improved
nitric oxide bioavailability,
reductions in angiotensin II, reductions in sympathetic neural
activity, and/or other factors
may contribute to the favorable changes in arterial stiffness
observed with weight loss.
There are some limitations of the present study that should be
acknowledged. First, our
sample size was small, and the age range of our subjects was
restricted to 55 to 75 years.
Thus, we were not able to test sex or age differences in the
arterial destiffening response to
our intervention. However, given the known age and sex
differences in body fat distribution
and potential depot specific responses to weight loss, future
studies will be necessary.
Second, our weight loss intervention was relatively short in
duration. Thus, whether the
reductions in arterial stiffness would be sustained over time is
unclear.
Third, we cannot exclude the possibility that the observed
reductions in arterial stiffness
were the result of the BP-lowering effects of weight loss and/or
the reduction in sodium
intake accompanying calorie restriction. However, we observed
significant reductions in β-
SI, a presumed BP-independent measure of arterial stiffness.14
In addition, changes in SBP,
DBP, or mean BP (or sodium intake) were not related to
changes in any of our measures of
arterial stiffness. Furthermore, there were no significant
differences in the magnitude of
reduction in either β-SI or C–F PWV in individuals above
compared with below the median
reduction in mean BP or sodium intake. Taken together, our
findings suggest that the
reduction in arterial stiffness with weight loss is, at least in
part, independent of the
reductions in BP and sodium intake.
Finally, our study was not designed to address the hemodynamic
consequences of arterial
destiffening with weight loss. However, this will be an
important objective for the future.
We recently reported that high-dose atorvastatin (80 mg once
daily) reduces arterial stiffness
in overweight and obese middle-aged and older adults.16 The
post-treatment levels of
arterial stiffness achieved in both our previous study16 and the
present study suggest that
arterial stiffness remains elevated compared with healthy young
individuals.15 Whether
weight loss (or therapeutic lifestyle change in general)
combined with statin therapy (or
other drugs) can reduce arterial stiffness in an additive or
synergistic manner is unclear.
Future studies are needed to address this important issue,
because greater reductions in
arterial stiffness should translate into superior cardiovascular
risk reduction.
Dengo et al. Page 6
Hypertension. Author manuscript; available in PMC 2011 April
1.
N
IH
-P
A
A
uthor M
anuscript
N
IH
-P
A
A
uthor M
anuscript
N
IH
-P
A
A
uthor M
anuscript
In summary, the findings from the present study suggest that
modest weight loss by
hypocaloric diet alone is efficacious in reducing arterial
stiffness in overweight and obese
middle-aged and older adults. The reductions in arterial
stiffness appear to be determined, at
least in part, by the magnitude of total and abdominal fat loss.
Future studies will be
necessary to determine the impact of long-term weight
maintenance and the efficacy of
combined arterial destiffening therapies.
Perspectives
Large artery stiffening is a potent risk factor for cardiovascular
mortality among older
adults. The findings of our present study suggest that weight
loss by hypocaloric diet alone
is efficacious in reducing large artery stiffness in overweight
and obese middle-aged and
older adults. The observed reductions in C–F PWV (ie, ≈150 to
200 cm/s) would translate
into a reversal of age-related arterial stiffening by ≈15 to 20
years.1,2 These observations
provide additional support for recommending weight loss to
middle-aged and older adults
who are overweight or obese. The reductions in arterial stiffness
observed in the present
study are similar in magnitude to the arterial destiffening effect
that we observed previously
with high-dose atorvastatin therapy in a similar population.16
Taken together, these
observations suggest that a combination of these therapies could
be particularly efficacious
in reversing arterial aging. Future studies will be necessary to
address this important issue.
Acknowledgments
We thank the participants for their time, effort, and commitment
to the study.
Sources of Funding
This study was supported by an American Heart Association
Grant-in-Aid (to K.P.D.).
References
1. Avolio A, Chen S, Wang R, Zhang C, Li M, O’Rourke M.
Effects of aging on change arterial
compliance and left ventricular load in a northern Chinese urban
community. Circulation
1983;68:50–58. [PubMed: 6851054]
2. Vaitkevicius PV, Fleg JL, Engel JH, O’Connor FC, Wright
JG, Lakatta LE, Yin FC, Lakatta EG.
Effects of age and aerobic capacity on arterial stiffness in
healthy adults. Circulation 1993;88:1456–
1462. [PubMed: 8403292]
3. Kuk JL, Saunders TJ, Davidson LE, Ross R. Age-related
changes in total and regional fat
distribution. Ageing Res Rev 2009;8:339–348. [PubMed:
19576300]
4. Resnick L, Militianu D, Cunnings A, Pipe J, Evelhoch J,
Soulen R. Direct magnetic resonance
determination of aortic distensibility in essential hypertension:
relation to age, abdominal visceral
fat, and in situ intracellular free magnesium. Hypertension
1997;30:654–659. [PubMed: 9322999]
5. Sutton-Tyrrell K, Newman A, Simonsick EM, Havlik R,
Pahor M, Lakatta E, Spurgeon H,
Vaitkevicius P. Aortic stiffness is associated with visceral
adiposity in older adults enrolled in the
study of health, aging, and body composition. Hypertension
2001;38:429–433. [PubMed:
11566917]
6. O’Rourke M. Arterial stiffness, systolic blood pressure, and
logical treatment of arterial
hypertension. Hypertension 1990;15:339–347. [PubMed:
2180816]
7. Sutton-Tyrrell K, Najjar SS, Boudreau RM, Venkitachalam L,
Kupelian V, Simonsick EM, Havlik
R, Lakatta EG, Spurgeon H, Kritchevsky S, Pahor M, Bauer D,
Newman A. Elevated aortic pulse
wave velocity, a marker of arterial stiffness, predicts
cardiovascular events in well-functioning older
adults. Circulation 2005;111:3384–3390. [PubMed: 15967850]
8. Balkestein EJ, van Aggel-Leijssen DP, van Baak MA,
Struijker-Boudier HA, Van Bortel LM. The
effect of weight loss with or without exercise training on large
artery compliance in healthy obese
men. J Hypertens 1999;17:1831–1835. [PubMed: 10703876]
Dengo et al. Page 7
Hypertension. Author manuscript; available in PMC 2011 April
1.
N
IH
-P
A
A
uthor M
anuscript
N
IH
-P
A
A
uthor M
anuscript
N
IH
-P
A
A
uthor M
anuscript
9. Barinas-Mitchell E, Kuller LH, Sutton-Tyrrell K, Hegazi R,
Harper P, Mancino J, Kelley DE. Effect
of weight loss and nutritional intervention on arterial stiffness
in type 2 diabetes. Diabetes Care
2006;29:2218–2222. [PubMed: 17003296]
10. US Department of Health and Human Services. Dietary
Guidelines for Americans, 2005. 6th ed..
Washington, DC: US Department of Agriculture; 2005.
11. Miyaki A, Maeda S, Yoshizawa M, Misono M, Saito Y,
Sasai H, Endo T, Nakata Y, Tanaka K,
Ajisaka R. Effect of weight reduction with dietary intervention
on arterial distensibility and
endothelial function in obese men. Angiology 2009;60:351–357.
[PubMed: 19022788]
12. Toto-Moukouo JJ, Achimastos A, Asmar RG, Hugues CJ,
Safar ME. Pulse wave velocity in
patients with obesity and hypertension. Am Heart J
1986;112:136–140. [PubMed: 3728268]
13. Alvarez GE, Beske SD, Ballard TP, Davy KP. Sympathetic
neural activation in visceral obesity.
Circulation 2002;106:2533–2536. [PubMed: 12427647]
14. Hirai T, Sasayama S, Kawasaki T, Yagi S. Stiffness of
systemic arteries in patients with
myocardial infarction: a noninvasive method to predict severity
of coronary atherosclerosis.
Circulation 1989;80:78–86. [PubMed: 2610739]
15. Orr JS, Gentile CL, Davy BM, Davy KP. Large artery
stiffening with weight gain in humans: role
of visceral fat accumulation. Hypertension 2008;51:1519–1524.
[PubMed: 18458161]
16. Orr JS, Dengo AL, Rivero JM, Davy KP. Arterial
destiffening with atorvastatin in overweight and
obese middle-aged and older adults. Hypertension 2009;54:763–
768. [PubMed: 19687343]
17. Vermeersch SJ, Rietzschel ER, De Buyzere ML, Van Bortel
LM, Gillebert TC, Verdonck PR,
Laurent S, Segers P, Boutouyrie P. Distance measurements for
the assessment of carotid to
femoral pulse wave velocity. J Hypertens 2009;27:2377–2385.
[PubMed: 19898251]
18. Baron RM, Kenny DA. The moderator-mediator variable
distinction in social psychological
research: conceptual, strategic, and statistical considerations. J
Pers Soc Psychol 1986;51:1173–
1182. [PubMed: 3806354]
19. National Institutes of Health. Clinical guidelines on the
identification, evaluation, and treatment of
overweight and obesity in adults: the evidence report.
1998;6:51S–209S.
20. Zieman SJ, Melenovsky V, Kass DA. Mechanisms,
pathophysiology, and therapy of arterial
stiffness. Arterioscler Thromb Vasc Biol 2005;25:932–943.
[PubMed: 15731494]
Dengo et al. Page 8
Hypertension. Author manuscript; available in PMC 2011 April
1.
N
IH
-P
A
A
uthor M
anuscript
N
IH
-P
A
A
uthor M
anuscript
N
IH
-P
A
A
uthor M
anuscript
Figure 1.
Change in β-SI after control and weight loss intervention (A).
Change in arterial compliance
after control and weight loss intervention (B). Change in C–F
PWV after control and weight
loss intervention (C). Values are mean±SE *P<0.05 vs control.
Dengo et al. Page 9
Hypertension. Author manuscript; available in PMC 2011 April
1.
N
IH
-P
A
A
uthor M
anuscript
N
IH
-P
A
A
uthor M
anuscript
N
IH
-P
A
A
uthor M
anuscript
Figure 2.
Relation between changes in β-SI and percentage of weight loss
in the pooled sample (A);
relation between changes in C–F PWV and percentage of weight
loss (B); relation between
changes in C–F PWV and changes in visceral fat (C); and
relation between changes in C–F
PWV and changes in waist circumference (D).
Dengo et al. Page 10
Hypertension. Author manuscript; available in PMC 2011 April
1.
N
IH
-P
A
A
uthor M
anuscript
N
IH
-P
A
A
uthor M
anuscript
N
IH
-P
A
A
uthor M
anuscript
Figure 3.
Relation between changes in mean arterial pressure and change
in C–F PWV.
Dengo et al. Page 11
Hypertension. Author manuscript; available in PMC 2011 April
1.
N
IH
-P
A
A
uthor M
anuscript
N
IH
-P
A
A
uthor M
anuscript
N
IH
-P
A
A
uthor M
anuscript
N
IH
-P
A
A
uthor M
anuscript
N
IH
-P
A
A
uthor M
anuscript
N
IH
-P
A
A
uthor M
anuscript
Dengo et al. Page 12
Table 1
Subject Characteristics Before and After the Control or Weight
Loss Intervention
Control (5 Women
and 6 Men)
Weight Loss (16 Women
and 9 Men)
Variable Before After Before After
Age, y 66.1±1.8 61.2±0.8
Body weight, kg 91.0±4.8 90.4±4.9 84.6±2.6 77.5±2.2*†‡
Body mass index, kg/m2 31.8±1.4 31.5±1.5 30.0±0.6
27.5±0.6*†‡
Waist circumference, cm 109.1±3.4 109.2±3.6 101.6±1.6
95.0.±1.3*†‡
Body fat, % 39.3±3.0 39.3±2.9 40.7±1.5 37.7±1.7*‡
Total fat mass, kg 32.5±2.5 32.4±2.4 32.7±1.5 28.0±1.6*‡
Fat free mass, kg 51.0±4.0 50.9±4.0 47.7±1.9 46.3±1.9*‡
Total abdominal fat, cm2 611±58 603±51 570±28 469±27*‡
Abdominal subcut. fat, cm2 391±44 382±38 391±24 336±23*‡
Abdominal visceral fat, cm2 188±18 186±17 177±15 133±12*‡
Brachial SBP, mmHg 132±3 128±2 126±1 119±2*†
Brachial DBP, mmHg 74±2 73±1 74±1 69±2*‡
Brachial MAP, mmHg 93±2 92±2 91±1 85±2*§‡
Brachial PP, mm Hg 58±2 55±3 52±1 50±2†
Carotid SBP, mm Hg 120±3 117±2 115±2 111±2*
Carotid PP, mm Hg 45±2 43±3 40±1 41±1
Heart rate, bpm 57±2 57±3 62±2 57±1*
Triglycerides, mg/dL 97±17 108±22 110±9 95±10‡
Total cholesterol, mg/dL 192±5 193±4 207±8 190±8‡
HDL cholesterol, mg/dL 51±7 50±7 47±3 46±2
LDL cholesterol, mg/dL 122±6 122±5 139±7 126±7
Glucose, mg/dL 87±5 90±5 89±3 85±3‡
Insulin, pmol/L 45±8 45±9 33±3 28±4§
All values are expressed as mean±SE. HDL indicates high-
density lipoprotein; LDL, low-density lipoprotein; VLDL, very
low-density lipoprotein;
MAP, mean arterial pressure; subcut., subcutaneous.
*
Data show the effect of time, P<0.05.
†
Data show the effect of group, P<0.05.
‡
Data show the effect of time×group interaction, P<0.05.
§
Data show the group effect, P=0.05.
Hypertension. Author manuscript; available in PMC 2011 April
1.
N
IH
-P
A
A
uthor M
anuscript
N
IH
-P
A
A
uthor M
anuscript
N
IH
-P
A
A
uthor M
anuscript
Dengo et al. Page 13
Table 2
Frequency of Medication Use
Group Medication Women Men
Control HRT 2 …
Plavix … 1
HCTZ 1 …
Lisinopril … 1
Weight loss HRT 2 …
Flomax … 1
Avodart … 1
Dyazide … 1
Lipitor … 3
Crestor 1 …
Fosamax 2 …
HRT indicates hormone replacement therapy.
Hypertension. Author manuscript; available in PMC 2011 April
1.
N
IH
-P
A
A
uthor M
anuscript
N
IH
-P
A
A
uthor M
anuscript
N
IH
-P
A
A
uthor M
anuscript
Dengo et al. Page 14
Table 3
Physical Activity and Dietary Intake Before and After the
Control or Weight Loss Intervention
Control Weight Loss
Variable Before After Before After
PA counts/d ×103 229±32 219±24 253±28 288±21
Energy, kcal 1897±103 1770±154 1998±100 1382±73*‡
Fat, % 37±2 38±1 36±1 32±2
Carbohydrates, % 46±3 46±2 47±2 50±3
Protein, % 16±1 16±1 16±1 18±1*‡
Alcohol, % 3.5±1.0 2.5±1.2 4.1±1.3 3.6±1.0
Cholesterol, mg 226±27 244±37 272±25 164±18*‡
SFA, g 24±2 24±3 25±2 15±1*‡
MUFA, g 30±3 29±3 30±2 19±2*‡
PUFA, g 19±2 16±2 17±1 11±1*†
TFA, g 5±1 5±1 5±1 3±1*
Sodium, mg 3304±276 3034±285 3203±185 2364±144*
Potassium, mg 2717±151 2627±221 3104±170 2536±133*
Magnesium, mg 305±26 298±35 339±19 309±18
All of the values are expressed as mean±SE. PA indicates
physical activity; SFA, saturated fatty acids; MUFA,
monounsaturated fatty acids;
PUFA, polyunsaturated fatty acids; TFA, trans fatty acids.
*
Data show the effect of time, P<0.05.
†
Data show the effect of group, P<0.05.
‡
Data show the effect of time×group interaction, P<0.05.
Hypertension. Author manuscript; available in PMC 2011 April
1.
N
IH
-P
A
A
uthor M
anuscript
N
IH
-P
A
A
uthor M
anuscript
N
IH
-P
A
A
uthor M
anuscript
Dengo et al. Page 15
Table 4
Indices of Arterial Stiffness Before and After the Control or
Weight Loss Intervention
Control Weight Loss
Variable Before After Before After
β-SI, U 11.73±0.89 12.25±0.82 10.68±0.58 9.44±0.52†
AC, mm2/
mm Hg
×10−1
0.126±0.011 0.120±0.010 0.120±0.014 0.133±0.012†
C–F PWV,
cm/s
1176±76 1190±77 1155±46 968±36*†
Aortic PWV,
cm/s
818±54 883±62 833±35 706±25*†
All values are expressed as mean±SE. Aortic PWV was
estimated using the equation developed by Vermeersch et al.17
AC indicates arterial
compliance.
*
Data show the effect of time, P<0.05.
†
Data show the effect of time×group interaction, P<0.05.
Hypertension. Author manuscript; available in PMC 2011 April
1.
N
IH
-P
A
A
uthor M
anuscript
N
IH
-P
A
A
uthor M
anuscript
N
IH
-P
A
A
uthor M
anuscript
Dengo et al. Page 16
Table 5
Correlations Between Change Indices of Arterial Stiffness With
the Intervention and Other Variables
Variable C–F PWV β-SI
Arterial
Compliance
Weight loss, kg 0.602* … …
Weight loss, % 0.592* 0.340* …
Body mass index, kg/m2 0.618* 0.296 …
Waist circumference, cm 0.519* … …
Body fat, % 0.386* 0.326 …
Total fat mass, kg 0.482* … …
Fat free mass, kg … … −0.357*
Total abdominal fat, cm2 0.461* … …
Abdominal subcutaneous fat, cm2 0.360* … …
Abdominal visceral fat, cm2 0.357* … …
Heart rate, bpm … … …
Triglycerides, mg/dL 0.298 … …
Total cholesterol, mg/dL 0.431* … …
LDL cholesterol, mg/dL 0.356* … …
LDL indicates low-density lipoprotein.
*
P<0.05.
Hypertension. Author manuscript; available in PMC 2011 April
1.
A v a i l a b l e o n l i n e a t w w w . s c i e n c e d i r e c t . c o
m
V A L U E I N H E A L T H 1 9 ( 2 0 1 6 ) 6 0 2 – 6 1 3
1098-3015$36.00 – s
Published by Elsevie
http://dx.doi.org/10
E-mail: ddkim62
* Address correspo
NE Pacific Street, Bo
j o u r n a l h o m e p a g e : w w w . e l s e v i e r . c o m / l o c
a t e / j v a l
Systematic Review
Estimating the Medical Care Costs of Obesity in the United
States: Systematic Review, Meta-Analysis, and
Empirical Analysis
David D. Kim, MS1,*, Anirban Basu, PhD1,2
1Department of Health Services, University of Washington,
Seattle, WA, USA; 2The National Bureau of Economic
Research,
Cambridge, MA, USA
A B S T R A C T
Background: The prevalence of adult obesity exceeds 30% in
the United
States, posing a significant public health concern as well as a
substantial
financial burden. Although the impact of obesity on medical
spending is
undeniably significant, the estimated magnitude of the cost of
obesity
has varied considerably, perhaps driven by different study
method-
ologies. Objectives: To document variations in study design and
meth-
odology in existing literature and to understand the impact of
those
variations on the estimated costs of obesity. Methods: We
conducted a
systematic review of the twelve recently published articles that
reported
costs of obesity and performed a meta-analysis to generate a
pooled
estimate across those studies. Also, we performed an original
analysis
to understand the impact of different age groups, statistical
models, and
confounder adjustment on the magnitude of estimated costs
using the
nationally representative Medical Expenditure Panel Surveys
from 2008-
2010. Results: We found significant variations among cost
estimates in
ee front matter Copyright & 2016, International S
r Inc.
.1016/j.jval.2016.02.008
@uw.edu.
ndence to: David D. Kim, MS, Department of Health
x 357660, Seattle, WA 98195.
the existing literature. The meta-analysis found that the annual
medical spending attributable to an obese individual was $1901
($1239-$2582) in 2014 USD, accounting for $149.4 billion at
the
national level. The two most significant drivers of variability in
the cost estimates were age groups and adjustment for obesity-
related comorbid conditions. Conclusions: It would be important
to
acknowledge variations in the magnitude of the medical cost of
obesity driven by different study design and methodology.
Research-
ers and policy-makers need to be cautious on determining
appropriate
cost estimates according to their scientific and political
questions.
Keywords: economic burden, medical care costs, obesity,
United States.
Copyright & 2016, International Society for
Pharmacoeconomics and
Outcomes Research (ISPOR). Published by Elsevier Inc.
Introduction
The prevalence of obesity, which is defined as a body mass
index
(BMI) of greater than 30, has increased dramatically in the
United
States since the late 1990s [1]. So much so that recently obesity
has been officially recognized as a disease by the American
Medical Association, an action that could put more emphasis
on the health condition by doctors and insurance companies so
as to minimize its adverse effects. Currently, rates of obesity
exceed 30% in most sex and adult age groups, whereas its
prevalence among children and adolescents, defined as a BMI of
more than 95th percentile, has reached 17% [2].
The alarming rates of the high prevalence of obesity have
posed a significant public health concern as well as a
substantial
financial burden on our society because obesity is known to be a
risk factor for many chronic diseases, such as type 2 diabetes,
cancer, hypertension, asthma, myocardial infarction, stroke, and
other conditions�[3,4]. To understand the economic burden of
obesity, several studies have attempted to estimate the attribut-
able costs of obesity, following the burden-of-illness literature
on
other disease areas [5–9]. A previous cost-of-illness study esti-
mated that health care spending attributable to the rising
prevalence of obesity has increased by 27% between 1987 and
2001 [10]. In gross terms, the annual medical costs of obesity
were
estimated to be $40 billion in 2006 [11]. The latest study using
an
instrumental variable (IV) approach even showed that the esti-
mated medical costs related to obesity could reach $209.7
billion,
which is twice higher than the previous estimate, $86 billion
[12].
As evidenced by the aforementioned estimates, although the
impact of obesity on the medical care spending is undeniably
significant, the estimated magnitude of the medical care costs
attributable to obesity has varied considerably, perhaps driven
by
different study methodologies, including data, statistical
models,
confounder adjustment, and target populations. In this article,
ociety for Pharmacoeconomics and Outcomes Research
(ISPOR).
Services, School of Public Health, University of Washington,
1959
http://dx.doi.org/10.1016/j.jval.2016.02.008
http://crossmark.crossref.org/dialog/?doi=10.1016/j.jval.2016.0
2.008&domain=pdf
http://crossmark.crossref.org/dialog/?doi=10.1016/j.jval.2016.0
2.008&domain=pdf
http://crossmark.crossref.org/dialog/?doi=10.1016/j.jval.2016.0
2.008&domain=pdf
mailto:[email protected]
http://dx.doi.org/10.1016/j.jval.2016.02.008
V A L U E I N H E A L T H 1 9 ( 2 0 1 6 ) 6 0 2 – 6 1 3 603
we approach these issues systematically with two goals: 1) to
conduct a systematic review and meta-analysis of recently
published articles that estimated the medical costs associated
with obesity between 2008 and 2012 and to document the
variations in study methodologies and 2) to demonstrate the
importance of study methodologies by performing an original
analysis to examine the impact of age group, confounder adjust-
ment, and statistical methods on the cost estimates of obesity
through the empirical analysis of a nationally representative US
population. Especially, we also examined the impact of obesity-
related diseases (ORDs) on the medical costs of obesity to show
that most, if not all, of those costs are attributable to ORDs.
We believe that it would be important to recognize significant
variations among estimates of obesity-attributable costs in the
existing literature and to understand the impact of study meth-
odology on the magnitude of these estimates so that researchers
and policymakers are able to determine the appropriate estimate
and methods according to their scientific and political
questions.
Methods
A Systematic Review and Meta-Analysis
Literature search
We searched the MEDLINE and Cochran database to identify
articles related to medical costs of obesity using keywords
“obesity AND (cost OR expenditure) AND healthcare)) AND
“united states.” To account for the unique health care system
and the impact of costs attributable to obesity in the United
States, we limited the search to studies conducted in the US
settings. We initially identified 567 articles from the search,
then
narrowed down to 16 articles for in-depth reviews. Following
the
extensive reviews, we excluded three studies that did not
provide
explicit methods and/or aggregate annual costs per person, in
addition to a previously conducted systematic review [13–16].
Finally, we included 12 studies in this study for the systematic
review [17–26]. Appendix Figure A in Supplemental Materials
found at http://dx.dor.org/10.1016/j.jval.2016.02.008 provides
details
on search strategies for identifying studies included in this
review.
Improve comparability across studies
To improve comparability across heterogeneous studies, we
performed appropriate adjustments to convert estimates from
each study into annual per-person costs among all obese pop-
ulation (BMI Z 30).
First, we converted cost estimates to 2014 USD to adjust for
the inflation over time using annual average consumer price
index for medical care [27]. One study reported the quarter-per-
person medical costs, and we annualized the cost estimate [17].
All the 12 studies reported direct medical costs, including the
out-
of-pocket costs for inpatient, noninpatient (outpatient, emer-
gency room, and other), and prescription drug spending.
Then, we aggregated all BMI-specific estimates into a single
composite estimate of costs attributable to all obese individuals.
Among the 12 studies, 8 studies defined obesity as a BMI of
greater
than 30 whereas 4 studies implemented more comprehensive
obesity categories, defined as class I obesity (30 o BMI r 35),
class
II obesity (35 o BMI r 40), and class III obesity (40 o BMI)
[21,22,24,26]. Two of the four studies combined class II and
class III
obesity into a single category because of the sample size issue
[22,26]. To generate comparable cost estimates, we calculated a
weighted average among subgroup-specific estimates on the
basis of
the number of each subgroup reported in each of the four
studies.
In addition, three studies estimated sex-specific costs of
obesity [18,20,23], and one study provided race (non-Hispanic
whites vs. blacks) stratified results [26]. Another study reported
both sex and race (non-Hispanic whites vs. blacks) stratified
estimates [19]. Based on the sample size of each stratum
presented in each study, only the weighted average estimates
for aggregating sex and race categories are presented in Table 2.
Evaluating quality of studies
We evaluated the quality of studies on the basis of four criteria:
the
use of nationally representative samples, longitudinal data sets,
analysis of adults of all ages, and appropriate confounding
factor
adjustments. A previous systematic review also used a similar
set
of criteria for evaluating cost-of-illness studies of obesity [13].
Meta-analysis
To generate a pooled estimate of medical costs of obesity across
different studies, we conducted a meta-analysis using the
metaan
command in STATA 12 (StataCorp., College Station, TX) [28].
The
metaan command is used to conduct random-effect meta-anal-
ysis for one-variable relationship. Because the meta-analysis for
one-variable relationship requires both the effect size estimate
and the standard error, we were able to include only eight
estimates of annual incremental costs of obesity from seven
studies (Table 2). Because of the presence of extremely high
heterogeneity between studies (I2 ¼ 96.61%; τ2 ¼ 5.6 � 105),
the
random-effect model is used in the final analysis.
Empirical Analysis: The Role of Alternative Statistical Models
in Estimating Costs of Obesity
Study data
The medical costs of obesity were estimated using regression
analysis and the 2008-2010 Medical Expenditure Panel Surveys
(MEPS). The MEPS is a nationally representative survey of the
civilian
noninstitutionalized population, collecting detailed information
on
health care expenditures and utilization, health insurance, health
status, and sociodemographic factors. Nationally representative
estimates were obtained by using MEPS sampling weights.
Variables
As a dependent variable, medical care costs (which include
costs for
office-based visits, hospital outpatient visits, emergency room
visits, inpatient hospital stays, prescription drugs, dental visits,
and home care) are defined as the sum of direct payments from
all parties (out-of-pocket, private insurers, government, and
other
payers) for care provided during the year. For a primary inde-
pendent variable, we identified obesity status on the basis of the
constructed BMI through self-reported height and measure [29].
(Please note that because of confidentiality concerns and
restric-
tions, the self-reported weight and height variables were not
available from the public-access MEPS data sets.) Also, we
categorized potential confounding factors into four categories to
examine the impact of confounder adjustments on the magni-
tude of the cost estimates: 1) Demographic factors or cov1 (age,
sex, and race/ethnicity), 2) Socioeconomic factors or cov2 (edu-
cation, household income based on the federal poverty line,
smoking status, and marital status), 3) Additional factors or
cov3 (census region and insurance status), and 4) comorbidity
conditions or cov4. Comorbidity conditions are defined as a
con-
tinuous variable ranging from 0 to 10 by summing up 10
potential
health consequences that can be caused be obesity. These
conditions, called ORDs, which are defined by the Centers for
Disease Control and Prevention, include hypertension, heart
diseases (coronary heart disease, angina, myocardial infarction,
others), stroke, cancer, diabetes, arthritis, and high cholesterol
[30]. In this data set, children or adolescents (age o 18 years)
do not have any information on comorbidity conditions and
http://dx.dor.org/10.1016/j.jval.2016.02.008
Table 1 – Characteristics of 12 studies included in this review.
Study Data Sample
size
Statistical
methods*
Obesity
class
Target
population
Variable adjusted for Quality evaluation (score out of 4)
Medical care cost of obesity—Annual cost per person (common
confounders†)
Wolf et al. [17],
2008
US PROCEED 1,300 Log-linear Aggregate Adults (aged
35–75 y)
(� race/ethnicity, income, marital status)
(þ alcohol use, comorbidities, insurance)
2: Longitudinal data, confounder
adjustment
Finkelstein
et al. [11],
2009
MEPS (2006) 21,877 Two-part
(logit-GLM)
Aggregate All adults (age
Z 18 y)
(þ census region, insurance status) 3: Nationally representative
sample, all adults, confounder
adjustment
Cai et al. [20],
2010
MCBS (1991–
2000)
5,043 Unadjusted Aggregate Adults aged 35–
55 y in the
period 1971–
1975
Unadjusted 1: Nationally representative
sample
Finkelstein
et al. [21],
2010
MEPS (2006) 8,875 Two-part
(logit-GLM)
Obesity
class I,
II, and
III
All adults (age
Z 18 y) Full-
time
employees
only
(þ age2, census region, insurance status) 3: Nationally
representative
sample, all adults, confounder
adjustment
Bell et al. [23],
2011
MEPS (2000–
2005)
80,516 Two-part
(logit-log
(Y) OLS)
Aggregate Children and
adults aged
6–85 y
(� smoking, marital status) (þ age2, age3,
region, insurance status, survey year)
3: Nationally representative
sample, all adults, confounder
adjustment
Onwudiwe
et al. [22],
2011
MCBS (2002) 7,706 One-part
GLM
Obesity
class I
and II/
III
Medicare
beneficiaries
(age Z 65 y)
Not in HMO
plan
(þ insurance status) 2: Nationally representative
sample, confounder
adjustment
Alley et al. [25],
2012
MCBS (1997–
2006)
29,413 One-part
GLM
Aggregate Medicare
beneficiaries
(age Z 65 y)
(þ census region, metropolitan status,
mortality variable)
3: Nationally representative
sample, all adults, confounder
adjustment
Cawley and
Meyerhoefer
[12], 2012
MEPS (2000–
2005)
23,689 IV with two-
part (logit-
GLM) IV: a
weight of
biological
relative
Aggregate Adults (aged
20–64 y with
biological
children
aged 11–20 y)
(� income, smoking, marital status) (þ census
region, MSA, household composition, survey
information, employment status, fixed
effects for year, the sex and age of the oldest
children)
3: Nationally representative
sample, confounder
adjustment (IV)
Ma et al. [26],
2012
MEPS (2006) 15,164 Unadjusted Obesity
class I
and II/
III
All adults (age
Z 18 y)
Unadjusted 2: Nationally representative
sample, all adults
Moriarty et al.
[24], 2012
Mayo Clinic
Database
(2001–
2007)
30,529 GEE Obesity
class I,
II, and
III
Adults (18–65 y)
vs. adults
(465 y)
(� education, income) (þ comorbidity
conditions for an additional analysis)
3: Longitudinal data, all adults,
confounder adjustment
V
A
L
U
E
I
N
H
E
A
L
T
H
1
9
(
2
0
1
6
)
6
0
2
–
6
1
3
6
0
4
M
ed
ic
a
l
ca
re
co
st
of
ob
es
it
y
—
Li
fe
ti
m
e
co
st
p
er
p
er
so
n
(a
ll
a
d
ju
st
ed
fo
r
su
rv
iv
a
l)
F
in
k
e
ls
te
in
e
t
a
l.
[1
9
],
2
0
0
8
M
E
P
S
(2
0
0
1
–
2
0
0
4
)
6
6
,1
6
1
T
w
o
-p
a
rt
m
o
d
e
l
(l
o
g
it
-G
L
M
)
O
b
e
si
ty
cl
a
ss
I
a
n
d
II
/
II
I
A
ll
a
d
u
lt
s
(a
g
e
Z
1
8
y
)
(�
in
co
m
e
)
(þ
in
su
ra
n
ce
st
a
tu
s,
ce
n
su
s
re
g
io
n
,
p
o
p
u
la
ti
o
n
d
e
n
si
ty
,
a
g
e
2
,
a
g
e
3
)
3
:
N
a
ti
o
n
a
ll
y
re
p
re
se
n
ta
ti
v
e
sa
m
p
le
,
a
ll
a
d
u
lt
s,
co
n
fo
u
n
d
e
r
a
d
ju
st
m
e
n
t
Y
a
n
g
a
n
d
H
a
ll
[1
8
],
2
0
0
8
M
C
B
S
(1
9
9
2
–
2
0
0
1
)
2
8
,9
0
6
T
w
o
-p
a
rt
m
o
d
e
l
(l
o
g
it
-l
o
g
(Y
)
O
L
S
)
A
g
g
re
g
a
te
M
e
d
ic
a
re
b
e
n
e
fi
ci
a
ri
e
s
(a
g
e
Z
6
5
y
)
(þ
fu
n
ct
io
n
a
l
st
a
tu
s,
e
x
is
ti
n
g
ch
ro
n
ic
d
is
e
a
se
s,
a
cu
te
m
e
d
ic
a
l
e
v
e
n
ts
,
u
rb
a
n
/r
u
ra
l)
2
:
N
a
ti
o
n
a
ll
y
re
p
re
se
n
ta
ti
v
e
,
co
n
fo
u
n
d
e
r
a
d
ju
st
m
e
n
t
C
a
i
e
t
a
l.
[2
0
],
2
0
1
0
M
C
B
S
(1
9
9
1
–
2
0
0
0
)
5
,0
4
3
O
n
e
-p
a
rt
G
L
M
A
g
g
re
g
a
te
A
d
u
lt
s
a
g
e
d
3
5
–
5
5
y
in
th
e
p
e
ri
o
d
1
9
7
1
–
1
9
7
5
(�
e
d
u
ca
ti
o
n
,
in
co
m
e
,
m
a
ri
ta
l
st
a
tu
s)
(þ
ti
m
e
to
d
e
a
th
)
2
:
N
a
ti
o
n
a
ll
y
re
p
re
se
n
ta
ti
v
e
,
co
n
fo
u
n
d
e
r
a
d
ju
st
m
e
n
t
G
E
E
,
g
e
n
e
ra
li
z
e
d
e
st
im
a
ti
n
g
e
q
u
a
ti
o
n
;
G
L
M
,
g
e
n
e
ra
li
z
e
d
li
n
e
a
r
m
o
d
e
l;
H
M
O
,
h
e
a
lt
h
m
a
in
te
n
a
n
ce
o
rg
a
n
iz
a
ti
o
n
;
IV
,
in
st
ru
m
e
n
ta
l
v
a
ri
a
b
le
;
M
C
B
S
,
M
e
d
ic
a
re
C
u
rr
e
n
t
B
e
n
e
fi
ci
a
ry
S
u
rv
e
y
;
M
E
P
S
,
M
e
d
ic
a
l
E
x
p
e
n
d
it
u
re
P
a
n
e
l
S
u
rv
e
y
s;
M
S
A
,
M
e
tr
o
p
o
li
ta
n
st
a
ti
st
ic
a
l
a
re
a
;
O
L
S
,
o
rd
in
a
ry
le
a
st
sq
u
a
re
s;
P
R
O
C
E
E
D
,
P
ro
sp
e
ct
iv
e
O
b
e
si
ty
C
o
h
o
rt
o
f
E
co
n
o
m
ic
E
v
a
lu
a
ti
o
n
a
n
d
D
e
te
rm
in
a
n
ts
.
*
A
ll
G
L
M
a
n
d
G
E
E
m
o
d
e
ls
u
se
d
th
e
lo
g
li
n
k
a
n
d
th
e
g
a
m
m
a
d
is
tr
ib
u
ti
o
n
.
†
C
o
m
m
o
n
co
n
fo
u
n
d
in
g
co
v
a
ri
a
te
s:
A
g
e
,
se
x
,
ra
ce
/e
th
n
ic
it
y
,
e
d
u
ca
ti
o
n
,
in
co
m
e
,
sm
o
k
in
g
st
a
tu
s,
a
n
d
m
a
ri
ta
l
st
a
tu
s.
V A L U E I N H E A L T H 1 9 ( 2 0 1 6 ) 6 0 2 – 6 1 3 605
smoking status, and only very few individuals reported
education
(N ¼ 25) and marital status (N ¼ 6).
Study design and data analysis
To study the impact of various study designs, we examined
three
different aspects of estimating medical costs in a regression
analysis: age groups, statistical models, and confounder adjust-
ments. The age groups were 1) children/adolescents (aged 0–17
years), 2) all adults (aged Z 18 years), 3) adults aged 18 to 65
years, and 4) older adults (aged Z65 years). Considering the
nature of cost data, such as non-negative observations, a large
number of observations at zero, and positive skewness, we
examined five different statistical models that have been widely
used to estimate the medical costs: 1) linear regression, 2) log-
linear model (a simple ordinary least square for ln(y)), 3) one-
part
log-gamma generalized linear model (GLM), 4) two-part model
with a logistic regression and a log-gamma GLM, and 5)
extended
estimating equation (EEE) that used both a flexible link and a
flexible variance function estimated directly from the data to
capture the underlying nonlinearity in the data so that it can
produce efficient estimates [31–34]. Also, we tested the
goodness
of fit (GoF) of each statistical model to examine how well the
model fits a data set using Pearson correlation, Pregobon’s link
test, and Hosmer-Lemeshow test. In regard to confounder
adjust-
ment, four sets of confounders were studied: 1) Demographic
factors (cov1), 2) Demographic þ Socioeconomic factors (cov1
þ
cov2), 3) Demographic þ Socioeconomic þ Additional factors
(cov1 þ cov2 þ cov3), and 4) All three factors þ ORDs (cov1 þ
cov2 þ cov3 þ cov4). Using different combinations of the target
population, statistical models, and confounder adjustment, we
estimated medical care costs of nonobese individuals (so called
costs of normal) as well as incremental costs of obesity through
recycled predictions to estimate the counterfactual mean costs if
all individuals in the data set were suddenly to have obesity
while retained all other characteristics as compared with being
nonobese for all individuals. We also tested the GoF of five
different statistical models with each of four different sets of
confounding factors for the sample population of all adults. All
standard errors and confidence intervals (CIs) were estimated
from 1000 bootstrap replicates.
Results
A Systematic Review and Meta-Analysis
Descriptive results
Among the 12 studies included in this systematic review, 9
studies reported annual medical care costs per person while 2
studies provided lifetime medical care costs per person and 1
study reported both estimates. Six studies used the MEPS data-
base, whereas four studies used the Medicare Current
Beneficiary
Survey database. The remaining two studies used the
Prospective
Obesity Cohort of Economic Evaluation and Determinants data
set, which is a multinational, observational, prospective
Internet-
based cohort study and the Mayo clinic employment database,
respectively (Table 1).
Quality evaluation
Based on four quality criteria, no studies met all criteria,
because
all the studies that used a nationally representative data set were
not a longitudinal study or vice versa. Among 10 studies that
reported annual costs per person, 5 studies were designated as
“high-quality (score ¼ 3)” study (Table 1). Because Cawley’s
study
was the only study that estimated medical costs of obesity using
the instrumental variable IV approach to account for unobserved
Table 2 – Systematic review—Medical costs of obesity (2014
USD).
Study Cost of
normal*
Cost of
obesity*
Incremental cost of
obesity*
Year of cost
reporting
Note
Medical care cost of obesity—Annual cost per person
Wolf et al. [17], 2008 $2,541 $6,611 $4,070† 2004
Finkelstein et al. [11],
2009
$4,087 $5,783 $1,696† 2008
Cai et al. [20], 2010 $5,750 $13,019 $7,269 2000 Unadjusted
Finkelstein et al. [21],
2010
NA NA $1,024 2006 Obese I, medical costs only
$1,944 Obese II, medical costs only
$2,215 Obese III, medical costs only
$1,397† Aggregate, medical costs only
Bell et al. [23], 2011 $3,629 $5,488 $1,859† 2005
Onwudiwe et al. [22],
2011
$5,666 $5,578 �$88 2002 Obese I, uncorrected for the height
loss
$6,637 $971 Obese II/III, uncorrected for the height
loss
$5,892 $227† Aggregate obese, uncorrected for the
height loss
Alley et al. [25], 2012 $8,781 $7,338 �$1,443 2006 Annual
spending in 1997 converted to
2008 USD
$157 $191 $34 Expenditures increased per year from
1997 to 2006
Cawley and
Meyerhoefer [12], 2012
NA NA $877† 2005 Without using the instrumental
variable
$3,665† With using the instrumental variable
Ma et al. [26], 2012 $4,797 $6,152 $1,356 2006 Obese I,
unadjusted
$8,408 $3,611 Obese II/III, unadjusted
$7,082 $2,285 Aggregate, unadjusted
Moriarty et al. [24], 2012 NA NA $2,278 2007 Obese I, no
comorbidity adjustment
$3,759 Obese II, no comorbidity adjustment
$6,794 Obese III, no comorbidity adjustment
$3,302† Aggregate obese, no comorbidity
adjustment
Medical care cost of obesity—Lifetime costs per person (all
adjusted for survival)
Finkelstein et al. [19],
2008
NA NA $19,892 2007 From age 20 y, obese I—Discounted
lifetime costs
$28,441 From age 20 y, obese II/III—Discounted
lifetime costs
$23,123 From age 20 y, aggregate—Discounted
lifetime costs
$15,641 From age 65 y, obese I—Discounted
lifetime costs
$24,589 From age 65 y, obese II/III—Discounted
lifetime costs
$19,022 From age 65 y, aggregate—Discounted
lifetime costs
Yang and Hall [18], 2008 $288,934 $332,838 $43,904 2001
From age 65 y—Not discounted
Cai et al. [20], 2010 $194,013 $269,628 $75,615 2000 From age
45 y—Not discounted
NA, not applicable/available.
* All costs were converted to 2014 US dollar using Consumer
Price Index—Medical Care.
† Represents the cost estimates included in the meta-analysis to
calculate the pooled incremental cost of obesity.
V A L U E I N H E A L T H 1 9 ( 2 0 1 6 ) 6 0 2 – 6 1 3606
confounding factors, the study received an extra score for con-
founder adjustment criteria [12].
Cost estimates
The annual incremental costs of obesity per person ranged from
$227 to $7269 depending on the study designs and research
methods. Tables 2 and 3 provide details on different study
methodologies and reported cost estimates. From the meta-
analysis with the random-effect model, the pooled estimate of
annual medical costs of obesity was $1910 (95% CI $1239–
$2582).
A forest plot from the random-effect model is shown in
Figure 1.
Three studies reported the lifetime costs associated with
obesity after adjusting for survival. One study estimated the
lifetime costs of obesity with a 3% annual discount on the
dollar value, resulting in $23,123 from age 20 years and
$19,022
from age 65 years [19], whereas another study without using a
discount rate reported the lifetime costs of $43,904 from age 65
years [18].
Table 3 – Systematic review—Medical costs of obesity by study
methodologies (2014 USD).
Confounding factors Unadjusted Demographic
factors
Demographic þ
socioeconomic factors
Demographic þ SES þ
additional factors
All factors þ
comorbidities
Statistical
methods
Age groups
Linear regression Children/adolescents
All adults (age Z 18 y) $2,285 (Ma et al. [26], 2012)
Adults (18–65 y) $7,269 (Cai et al. [20], 2010)
Older adults (age Z 65 y)
Log-linear Children/adolescents
All adults (age Z 18 y)
Adults (18–65 y) $4,070 (Wolf, 2008)
Older adults (age Z 65 y)
One-part GLM Children/adolescents
All adults (age Z 18 y)
Adults (18–65 y)
Older adults (age Z 65 y) $227 (Onwudiwe, 2011)
�$1,443 (Alley, 2012)
Two-part GLM Children/adolescents
All adults (age Z 18 y) $1,696 (Finkelstein, 2009)
$1,359 (Finkelsten, 2010)
$1,859 (Bell, 2011)
Adults (18–65 y) $877 (Cawley, 2012)
Older adults (age Z 65 y)
Other methods Children/adolescents
All adults (age Z 18 y) $3,302 (Moriarty, 2012)—
GEE
Adults (18–65 y) $3,665 (Cawley, 2012)—IV
Older adults (age Z 65 y)
V
A
L
U
E
I
N
H
E
A
L
T
H
1
9
(
2
0
1
6
)
6
0
2
–
6
1
3
6
0
7
Fig. 1 – Meta-analysis: Medical costs of obesity (random-effect
model). CI, confidence interval; IV, instrumental variable.
V A L U E I N H E A L T H 1 9 ( 2 0 1 6 ) 6 0 2 – 6 1 3608
Stratified results
Among the studies that provided stratified estimates of the
medical costs attributable to obesity, the annual costs increased
in higher obese categories [21,22,24,26] and the lifetime costs
of
obesity were also positively associated with an increasing BMI
[19]. The magnitude of the annual costs related to obesity was
higher among women than among men [18–20,23]. Also, obese
blacks were found to spend less medical costs than obese
whites,
mainly due to more use of relatively inexpensive types of care
(office-based visits, outpatient care, medications) rather than
more costly ones (inpatient, emergency room) [19,26].
Different study methodology
Among the 10 studies that estimated annual medical care cost
attributable to obesity, a two-part model was the most popular
method used by four studies. Three of those four studies imple-
mented a logistic regression with a log-gamma GLM [11,12,21],
whereas another study used a logit model with a log-linear
model
[23]. Two studies used a one-part GLM method with a log link
and a
gamma distribution [22,25]. A generalized estimating equation
[24]
and a log-linear regression model [17] were used in other two
studies,
respectively, and the remaining two studies reported unadjusted
annual costs of obesity [20,26]. Because each study used
distinctive
data sets to various study methodologies, it is hard to predict
the
actual impact of a range of study methodologies on the
magnitude of
the costs of obesity. However, one study using both a two-part
model
and an IV approach provided that the effect of obesity on
medical
care costs was much greater with the IV method than was
previously
appreciated with the two-part model. The instrument used in the
study was the weight of a biological relative [12].
Different confounder adjustment
We defined confounding factors that were widely used to adjust
for the causal inference among these studies, including demo-
graphic factors, socioeconomic factors, additional factors, and
obesity-related comorbidity conditions. However, none of these
studies selected the same set of confounding factors. Table 1
presents a significant variability in choosing confounding
factors,
and the substantial variability poses an essential problem of
comparing these estimates directly. A study that examined two
models with and without adjusting for comorbidity conditions as
a confounding factor found that incremental costs of obesity
dropped significantly when adjusted for comorbidities [24].
Estimating Medical Costs of Obesity
With possible combinations of the four age groups, the five
statistical
models, and the four sets of potential confounders, 80 estimates
of
costs of normal and incremental costs of obesity were generated
with 95% CIs. All possible cost estimates are provided in Table
4.
Characteristics of individuals in the data set
Individual characteristics used in estimating medical costs of
obesity are presented in Appendix Table A in Supplemental
Materials found at http://dx.dor.org/10.1016/j.jval.2016.02.008.
In
this analysis, the data set includes 15,176 children and adoles-
cents and 69,382 adults aged 18 years and older, including
10,382
older adults (age Z 65 years) with existing obesity status.
Among
the obese, there was a significantly higher proportion of
females,
blacks, Hispanics, individuals in lower household income level
(o125% federal poverty line), only high school or equivalent
degree holder, those who were married, individuals with public
insurance, and those living in the South region, compared with
the nonobese. Also, as expected, individuals with obesity have a
higher number of obesity-related comorbidity conditions than
do
those without obesity.
Effect of different target populations
For children/adolescents, regardless of different statistical mod-
els and confounding factor adjustment, there was no significant
difference between costs of the nonobese and the obese, except
only one scenario with a one-part GLM controlling for all con-
founding factors available (no comorbidities and smoking) that
reported $1085 ($92–$2377) for the incremental costs of obesity
for
children/adolescents. However, for the adult population, the
http://dx.dor.org/10.1016/j.jval.2016.02.008
Table 4 – Factors affecting costs of normal (nonobese) and
incremental costs of obesity.
Confounding factors Unadjusted Demographic factors1
Demographic þ
socioeconomic factors2
Demographic þ SES þ
additional factors3
All factors þ comorbidities4
Statistical
methods
Age groups Cost of
normal
Incremental
cost of obesity
95% CI Cost of
normal
Incremental
cost of obesity
95% CI Cost of
normal
Incremental
cost of obesity
95% CI Cost of
normal
Incremental
cost of obesity
95% CI Cost of
normal
Incremental
cost of obesity
95% CI
Linear
regression
Children/
adolescents
1,851 �62 (�455
to 333)
1,265 182 (�198
to 563)
1,591 621 (�285
to
1528)
1,580 647 (�269
to
1563)
NA NA NA
All adults
(age Z 18 y)
4,574 1,766 (1477
to
2056)
4,252 1,411 (1096
to
1689)
4,436 1,453 (1139
to
1738)
4,443 1,406 (1101
to
1700)
4,792 153 (�156
to 456)
Adults
(18–65 y)
3,524 1,795 (1502
to
2088)
3,345 1,283 (995 to
1570)
3,494 1,312 (1006
to
1617)
3,559 1,153 (851 to
1456)
3,855 93 (�211
to 397)
Older adults
(age Z 65 y)
9,558 2,290 (1385
to
3195)
9,247 2,898 (1975
to
3820)
9,380 2,747 (1794
to
3701)
9,362 2,717 (1762
to
3673)
9,954 496 (�421
to
1413)
Log-linear Children/
adolescents
1,975 90 (�413
to 826)
1,640 366 (�178
to
1186)
2,145 1,112 (�67 to
2533)
2,074 1,191 (�36 to
2652)
NA NA NA
All adults (age
Z 18 y)
5,186 1,562 (1318
to
1823)
5,394 1,375 (1089
to
1705)
5,546 1,412 (1101
to
1753)
5,452 1,261 (950 to
1561)
6,236 61 (�250
to 358)
Adults
(18–65 y)
4,175 1,614 (1372
to
1858)
4,298 1,015 (759 to
1294)
4,407 1,031 (764 to
1312)
4,321 819 (544 to
1086)
4,935 �78 (�347
to 197)
Older adults
(age Z 65 y)
9,468 2,283 (1522
to
3012)
9,439 3,528 (2556
to
4456)
9,602 3,431 (2461
to
4371)
9,654 3,378 (2425
to
4354)
10,849 425 (�435
to
1273)
One-part
GLM
Children/
adolescents
1,851 �62 (�396
to 349)
1,376 140 (�140
to 532)
1,571 715 (�240
to
1567)
1,556 1,085 (92 to
2377)
NA NA NA
All adults (age
Z 18 y)
4,574 1,766 (1462
to
2056)
4,279 1,450 (1139
to1720)
4,446 1,506 (1210
to
1822)
4,511 1,397 (1091
to
1665)
5,048 429 (103 to
728)
Adults
(18–65 y)
3,524 1,795 (1509
to
2089)
3,383 1,088 (843 to
1336)
3,517 1,143 (890 to
1407)
3,580 970 (702 to
1216)
4,115 258 (�14 to
535)
Older adults
(age Z 65 y)
9,558 2,290 (1415
to
3193)
9,235 3,124 (2090
to
4046)
9,358 2,992 (1918
to
3977)
9,342 2,944 (1858
to
3859)
9,981 600 (�272
to
1496)
Two-part
GLM
Children/
adolescents
2,162 �62 (�359
to 455)
1,953 140 (�146
to 653)
2,063 475 (�175
to
1289)
2,066 750 (�2 to
1894)
NA NA NA
All adults (age
Z 18 y)
5,483 1,834 (1553
to
2170)
5,358 1,524 (1247
to
1803)
5,498 1,578 (1284
to
1848)
5,535 1,481 (1186
to
1754)
5,949 399 (112 to
665)
Adults
(18–65 y)
4,369 1,880 (1581
to
2206)
4,391 1,190 (938 to
1428)
4,528 1,234 (957 to
1467)
4,579 1,070 (813 to
1313)
4,974 269 (8 to
506)
Older adults
(age Z 65 y)
9,894 2,328 (1481
to
3280)
9,628 3,191 (2264
to
4187)
9,749 3,060 (2040
to
4017)
9,740 3,014 (1991
to
3993)
10,315 555 (�320
to
1451)
continued on next page
V
A
L
U
E
I
N
H
E
A
L
T
H
1
9
(
2
0
1
6
)
6
0
2
–
6
1
3
6
0
9
T
a
b
le
4
–
co
n
ti
n
u
ed
C
o
n
fo
u
n
d
in
g
fa
ct
o
rs
U
n
a
d
ju
st
e
d
D
e
m
o
g
ra
p
h
ic
fa
ct
o
rs
1
D
e
m
o
g
ra
p
h
ic
þ
so
ci
o
e
co
n
o
m
ic
fa
ct
o
rs
2
D
e
m
o
g
ra
p
h
ic
þ
S
E
S
þ
a
d
d
it
io
n
a
l
fa
ct
o
rs
3
A
ll
fa
ct
o
rs
þ
co
m
o
rb
id
it
ie
s4
E
E
E
C
h
il
d
re
n
/
a
d
o
le
sc
e
n
ts
1
,8
5
1
�
6
2
(�
3
7
6
to
3
8
9
)
N
A
N
A
N
A
1
,5
9
3
6
5
3
(�
3
3
to
1
5
5
6
)
N
A
N
A
N
A
N
A
N
A
N
A
A
ll
a
d
u
lt
s
(a
g
e
Z
1
8
y
)
4
,5
7
4
1
,7
6
6
(1
4
4
5
to
2
0
4
2
)
4
,2
5
0
1
,3
4
6
(1
0
6
5
to
1
6
0
4
)
4
,4
4
1
1
,3
5
6
(1
0
7
6
to
1
6
4
4
)
4
,4
1
4
1
,3
4
3
(1
0
7
6
to
1
6
2
1
)
4
,7
6
4
2
0
9
(�
2
1
to
4
3
4
)
A
d
u
lt
s
(1
8
–
6
5
y
)
3
,5
2
4
1
,7
9
5
(1
5
0
9
to
2
0
8
9
)
3
,3
5
8
1
,1
3
5
(9
0
4
to
1
3
8
3
)
3
,5
0
5
1
,1
7
0
(9
2
7
to
1
4
4
5
)
3
,4
9
2
1
,0
9
4
(8
5
9
to
1
3
5
9
)
3
,8
0
4
1
8
4
(�
4
1
to
3
9
8
)
O
ld
e
r
a
d
u
lt
s
(a
g
e
Z
6
5
y
)
9
,5
5
8
2
,2
9
0
(1
4
1
5
to
3
1
9
3
)
9
,2
4
6
2
,8
4
4
(1
8
1
9
to
3
7
7
6
)
9
,3
9
7
2
,6
9
9
(1
4
2
7
to
3
5
2
9
)
9
,4
4
7
2
,6
9
8
(9
7
8
to
4
4
1
8
)
9
,9
7
3
3
4
4
(�
3
8
7
to
1
2
3
1
)
C
I,
co
n
fi
d
e
n
ce
in
te
rv
a
l;
E
E
E
,
e
x
te
n
d
e
d
e
st
im
a
ti
n
g
e
q
u
a
ti
o
n
;
G
E
E
,
g
e
n
e
ra
li
z
e
d
e
st
im
a
ti
n
g
e
q
u
a
ti
o
n
;
G
L
M
,
g
e
n
e
ra
li
z
e
d
li
n
e
a
r
m
o
d
e
l;
IV
,
in
st
ru
m
e
n
ta
l
v
a
ri
a
b
le
;
N
A
,
n
o
t
a
p
p
li
ca
b
le
/a
v
a
il
a
b
le
.
1
.
D
e
m
o
g
ra
p
h
ic
fa
ct
o
rs
:
A
g
e
,
se
x
,
a
n
d
ra
ce
/e
th
n
ic
it
y
;
2
.
S
o
ci
o
e
co
n
o
m
ic
fa
ct
o
rs
:
E
d
u
ca
ti
o
n
,
h
o
u
se
h
o
ld
in
co
m
e
,
sm
o
k
in
g
st
a
tu
s,
a
n
d
m
a
ri
ta
l
st
a
tu
s;
3
.
A
d
d
it
io
n
a
l
fa
ct
o
rs
:
C
e
n
su
s
re
g
io
n
a
n
d
in
su
ra
n
ce
st
a
tu
s;
4
.
C
o
m
o
rb
id
it
ie
s:
T
h
e
p
re
se
n
ce
o
f
1
0
o
b
e
si
ty
-r
e
la
te
d
d
is
e
a
se
s
(0
–
1
0
)
V A L U E I N H E A L T H 1 9 ( 2 0 1 6 ) 6 0 2 – 6 1 3610
incremental costs of obesity were significantly higher than for
the
nonobese. Among adults, in most of the combinations with
statistical models and confounding factors, the incremental
costs
of obesity for older adults (age Z 65 years) were significantly
higher than those for adults aged 18 to 65 years (Fig. 2 and
Table 4).
From the EEE model controlling for demographic,
socioeconomic,
and additional factors (cov1 þ cov2 þ cov3), the incremental
costs
of obesity for adults aged 18 to 65 years were reported as $1094
($859–$1359) while the costs of obesity for older adults were
$2668
($978–$4418).
Effect of different statistical models
Medical care costs attributable to obesity did not differ signifi-
cantly by using different statistical models, although the GoF
tests showed that an EEE model fitted the data most thoroughly,
followed by a one-part GLM. For all adults, controlling for
demographic and socioeconomic and additional factors (cov1 þ
cov2 þ cov3), the EEE model reported $1343 ($1076–$1621) for
the
incremental costs of obesity, whereas the estimates ranged from
$1261 ($950–$1561) in the log-linear model to $1481 ($1186–
$1754)
in the two-part GLM (Fig. 2; Table 4). Also, compared with
other
models, the EEE model provided the most stable estimates over
the different sets of confounding factor adjustment, varying
only
from $1346 with cov1 to $1356 with cov1 þ cov2 to $1343 with
cov1 þ cov2 þ cov3.
Confounding factor adjustment
For children, regardless of statistical models, the point
estimates
of the incremental costs of obesity were increased as we
adjusted
with more sets of possible confounding factors (up to cov1 þ
cov2
þ cov3), despite a huge CI that made those estimates
statistically
insignificant. For adults, controlling for demographic, socioeco-
nomic, and additional confounding factors (cov1 þ cov2 þ cov3)
did not make any substantial impact on point estimates as well
as statistical significance. However, by controlling for ORDs
(cov4)
that were available only for adults in this data set, the incre-
mental costs of obesity reduced to one-fourth to one-seventh of
the original estimates. Among all adults, the EEE model esti-
mated the costs attributable to obesity as $1343 ($1076–$1621)
controlling for all confounding factors except the comorbidity
conditions, whereas after adding obesity-related comorbidities
in
the model the estimates were decreased to $209 (�$21 to $434),
which was statistically insignificant, compared with the costs of
the nonobese (Fig. 2; Table 4).
Discussion
This article provided a systematic review and meta-analysis of
the 12 recently published articles that reported the medical care
costs associated with obesity, and also performed an original
analysis to understand the impact of study methodology on the
magnitude of these estimates. From the meta-analysis, the
pooled estimate of annual medical costs attributable to obesity
was $1901 ($1239–$2582) in 2014 USD, accounting for $149.4
billion at the national level. The extremely high heterogeneity
score from the meta-analysis signified the presence of hetero-
geneity between different studies due to the use of different
data
sets from multiple time periods, various statistical methods, and
adjustment for a wide range of confounding factors to estimate
the costs. Compared with the findings from the previously
conducted systematic review that reported the incremental costs
of obesity as $2046 (2014 USD) [13], the estimate from this
analysis is very comparable.
From the empirical analysis, not surprisingly, different stat-
istical methods did not have a significant impact on the
Note: EEE, extended estimating equation; SES, socio-economic
status; GLM, generalized linear model;
ORDs, obesity-related diseases
Fig. 2 – Impact of age groups, statistical models, and
confounding factor adjustment on the estimates of costs
attributable to
obesity. EEE, extended estimating equation; GLM, generalized
linear model; ORDs, obesity-related diseases; SES,
socioeconomic status.
V A L U E I N H E A L T H 1 9 ( 2 0 1 6 ) 6 0 2 – 6 1 3 611
V A L U E I N H E A L T H 1 9 ( 2 0 1 6 ) 6 0 2 – 6 1 3612
variability of the estimates in this analysis. However, we
caution
that this analysis does not endorse that any statistical model can
be used in estimating highly skewed cost data. Ignoring the
nature of cost data and misspecification of statistical models
may lead to inefficient or sometimes biased estimates [32,33].
For
all adults, controlling for the demographic and socioeconomic
and additional factors (cov1 þ cov2 þ cov3), the EEE model,
which
had the best GoF among all models based on the GoF tests,
reported $1343 ($1076–$1621) for the incremental costs of
obesity.
This result provides that the estimate of the national medical
care costs attributable to obesity would be $94.3 billion ($75.6–
$113.2 billion), which accounts for 3.8% (2.8%–4.3%) of
national
health expenditures in 2010 [35]. This estimate of medical costs
attributable to obesity from the empirical analysis was lower
than the pooled estimate from the meta-analysis. The reporting
error in the BMI measure through self-reported height and
weight
is likely to bias the coefficient estimates, although the direction
of
bias is not clear. Also, the possibility of omitting unobserved
confounders or reverse causality of obesity on medical costs is
likely to underestimate the true costs attributable to obesity.
The
IV approach by Cawley et al. could address these problems
using
a weight of biological relative as an instrument. The estimate
from the IV approach, however, may not be generalizable to the
entire population because of the restriction of the study popula-
tion to only adults aged 20 to 64 years with biological children
aged 11 to 20 years.
The two most significant drivers of variability in the cost
estimates were age groups and adjustment for obesity-related
comorbid condition. First, as expected, there is no significant
difference in costs attributable to obesity in
children/adolescence
population because of the presence of very few ORDs that may
take a long time to develop among children. In contrast, the
incremental costs of obesity were significantly higher than
those
for the nonobese for the adult population, and the older pop-
ulation reported significantly higher costs associated with
obesity
than did adults aged 18 to 65 years. However, because we
included obesity-related comorbidity as a confounding factor in
the model, the medical costs of obesity were not significantly
higher that the costs among the nonobese. These findings
confirmed that most, if not all, of the costs attributable to
obesity
are mainly caused by ORDs, and as age increases, the obese
population is more likely to develop ORDs, incurring higher
costs
of obesity for the older population.
The main limitation of estimating costs attributable to obesity
is the lack of distinction between costs of obesity caused by
ORDs
and costs of obesity care itself. If the ORDs are caused by the
obesity, then by controlling for them, it estimates only the
“partial” effect of obesity alone on the cost. However, by
omitting
such comorbidities as covariates, it estimates the “total effect”
of
obesity directly on cost and indirectly through mediators, the
ORDs. Although the “partial” effect of obesity alone on medical
costs was represented by the estimates controlling for ORDs
(cov4) in my analysis, which were not significantly different
from
costs of the nonobese, the true “total effect” of obesity on costs
is
not easy to estimate, because the regression model could not
capture the true counterfactual costs of obesity by just omitting
comorbidities as covariates, ignoring the presence of ORDs in
the
nonobese population. Future study needs to be directed at
estimating true counterfactual costs related to the absence/
presence of obesity and ORDs.
After recognizing obesity as a disease, a national survey found
that survey participants are more likely to support the disease
classification of obesity, and they believe that this change
would
bring more attention to weight changes and more access to
obesity
treatment [36]. However, a recent evaluation of adherence to
national obesity clinical practice guidelines found the lack of
increase in documentation of diagnosis and planned
management
of obesity patients [37]. Thus, recognizing obesity as a disease
may
not lead to immediate changes in health care utilization or
significant policy changes. However, what we can do is produce
better evidence of effectiveness and cost-effectiveness of
obesity
treatment through future research. Then, better research alone
will increase obesity treatment and reduce the burden of illness,
and we hope the overall medical expenditure will be expected to
decrease in the long run as we make more diligent efforts to
fight
against the obesity epidemic. (We appreciate valuable insights
from an anonymous reviewer and David Arterburn.)
However, the utility of published estimates for the medical
costs of obesity should be examined carefully, because of their
wide variation, and the estimates should be applied cautiously
in
future research and health policy making.
Source of financial support: This work was supported by the
Agency for Healthcare Research and Quality predoctoral
training
fellowship (grant no. 5 T32 HS 013853-10).
Supplementary Materials
Supplemental material accompanying this article can be found
in
the online version as a hyperlink at http://dx.doi.org/10.1016/j.
jval.2016.02.008 or, if a hard copy of article, at
www.valueinhealth
journal.com/issues (select volume, issue, and article).
R E F E R E N C E S
[1] Sturm R, Ringel JS, Andreyeva T. Increasing obesity rates
and disability
trends. Health Aff (Millwood) 2004;23:199–205.
[2] Flegal KM, Carroll MD, Ogden CL, et al. Prevalence and
trends in obesity
among US adults, 1999–2008. JAMA 2010;303:235–41.
[3] Hu FB. Obesity Epidemiology. .. Oxford, UK: Oxford
University Press, 2008.
[4] Dixon JB. The effect of obesity on health outcomes. Mol
Cell Endocrinol
2010;316:104–8.
[5] Colditz GA. Economic costs of obesity. Am J Clin Nutr
1992;55:503S–7S.
[6] Wolf AM, Colditz GA. Current estimates of the economic
cost of obesity
in the United States. Obesity Res 1998;6:97–106.
[7] Kortt MA, Langley PC, Cox ER. A review of cost-of-illness
studies on
obesity. Clin Therapeut 1998;20:772–9.
[8] Colditz GA. Economic costs of obesity and inactivity. Med
Sci Sports
Exerc 1999;31:S663–7.
[9] Anis AH, Zhang W, Bansback N, et al. Obesity and
overweight in
Canada: an updated cost-of-illness study. Obesity Rev
2010;11:31–40.
[10] Thorpe KE, Florence CS, Howard DH, et al. The impact of
obesity on
rising medical spending. Health Aff (Millwood) 2004;Suppl.
Web
Exclusives:W4-480-6.
[11] Finkelstein EA, Trogdon JG, Cohen JW, et al. Annual
medical spending
attributable to obesity: payer-and service-specific estimates.
Health Aff
(Millwood) 2009;28:w822–31.
[12] Cawley J, Meyerhoefer C. The medical care costs of
obesity: an
instrumental variables approach. J Health Econ 2012;31:219–30.
[13] Tsai AG, Williamson DF, Glick HA. Direct medical cost of
overweight
and obesity in the USA: a quantitative systematic review.
Obesity Rev
2011;12:50–61.
[14] Gavard JA. Health care costs of obesity in women. Obstet
Gynecol Clin
North Am 2009;36:213–26, xii.
[15] Wang YC, McPherson K, Marsh T, et al. Health and
economic burden of
the projected obesity trends in the USA and the UK. Lancet
2011;378:815–25.
[16] Trogdon JG, Finkelstein EA, Feagan CW, et al. State- and
payer-specific
estimates of annual medical expenditures attributable to obesity.
Obesity (Silver Spring) 2012;20:214–20.
[17] Wolf AM, Finer N, Allshouse AA, et al. PROCEED:
Prospective Obesity
Cohort of Economic Evaluation and Determinants: baseline
health and
healthcare utilization of the US sample. Diabetes Obes Metab
2008;10:1248–60.
[18] Yang Z, Hall AG. The financial burden of overweight and
obesity among
elderly Americans: the dynamics of weight, longevity, and
health care
cost. Health Serv Res 2008;43:849–68.
[19] Finkelstein EA, Trogdon JG, Brown DS, et al. The lifetime
medical cost
burden of overweight and obesity: implications for obesity
prevention.
Obesity (Silver Spring) 2008;16:1843–8.
http://dx.doi.org/10.1016/j.jval.2016.02.008
http://www.valueinhealthjournal.com/issues
V A L U E I N H E A L T H 1 9 ( 2 0 1 6 ) 6 0 2 – 6 1 3 613
[20] Cai L, Lubitz J, Flegal KM, et al. The predicted effects of
chronic obesity
in middle age on Medicare costs and mortality. Med Care
2010;48:510–7.
[21] Finkelstein EA, DiBonaventura M, Burgess SM, et al. The
costs of obesity
in the workplace. J Occup Environ Med 2010;52:971–6.
[22] Onwudiwe NC, Stuart B, Zuckerman IH, et al. Obesity and
Medicare
expenditure: accounting for age-related height loss. Obesity
(Silver
Spring) 2011;19:204–11.
[23] Bell JF, Zimmerman FJ, Arterburn DE, et al. Health-care
expenditures of
overweight and obese males and females in the Medical
Expenditures
Panel Survey by age cohort. Obesity (Silver Spring)
2011;19:228–32.
[24] Moriarty JP, Branda ME, Olsen KD, et al. The effects of
incremental costs
of smoking and obesity on health care costs among adults: a 7-
year
longitudinal study. J Occup Environ Med 2012;54:286–91.
[25] Alley D, Lloyd J, Shaffer T, et al. Changes in the
association between
body mass index and Medicare costs, 1997–2006. Arch Intern
Med
2012;172:277–8.
[26] Ma S, Frick KD, Bleich S, et al. Racial disparities in
medical expenditures
within body weight categories. J Gen Intern Med 2012;27:780–
6.
[27] Bureau of Labor Statistics. Archived Consumer Price Index
Detailed
Report Information. Available at
http://www.bls.gov/cpi/cpi_dr.htm.
[28] StataCorp. Stata Statistical Software: Release 12. College
Station, TX:
StataCorp LP, 2011.
[29] Defining Overweight and Obesity, National Center for
Chronic Disease
Prevention and Health Promotion. Centers for Disease Control
and
Prevention, 2012. Available at
http://www.cdc.gov/obesity/adult/
defining.html.
[30] National Heart Lung and Blood Institute, National Institute
of Diabetes
and Digestive and Kidney Diseases (U.S.). Clinical Guidelines
on the
Identification, Evaluation, and Treatment of Overweight and
Obesity in Adults: The Evidence Report. Bethesda, MD:
National
Institutes of Health, National Heart, Lung, and Blood Institute,
1998.
[31] Jones A. Health econometrics. In: Culyer AJ, Newhouse
JP, eds.,
Handbook of Health Economics. Amsterdam: Elsevier, 2000.
[32] Manning WG, Mullahy J. Estimating log models: to
transform or not to
transform? J Health Econ 2001;20:461–94.
[33] Buntin MB, Zaslavsky AM. Too much ado about two-part
models and
transformation? Comparing methods of modeling Medicare
expenditures. J Health Econ 2004;23:525–42.
[34] Basu A, Rathouz PJ. Estimating marginal and incremental
effects on
health outcomes using flexible link and variance function
models.
Biostatistics 2005;6:93–109.
[35] Hartman M, Martin AB, Benson J, et al. National health
spending
in 2011: overall growth remains low, but some payers and
services show signs of acceleration. Health Aff (Millwood)
2013;32:87–99.
[36] Puhl RM, Liu S. A national survey of public views about
the classification
of obesity as a disease. Obesity (Silver Spring) 2015;23:1288–
95.
[37] Barnes ER, Theeke LA, Mallow J. Impact of the Provider
and Healthcare
team Adherence to Treatment Guidelines (PHAT-G)
intervention on
adherence to national obesity clinical practice guidelines in a
primary
care centre. J Eval Clin Pract 2015;21:300–6.
http://www.bls.gov/cpi/cpi_dr.htm
http://www.cdc.gov/obesity/adult/defining.html
http://www.cdc.gov/obesity/adult/defining.htmlEstimating the
Medical Care Costs of Obesity in the United States: Systematic
Review, Meta-Analysis, and Empirical
AnalysisIntroductionMethodsA Systematic Review and Meta-
AnalysisLiterature searchImprove comparability across
studiesEvaluating quality of studiesMeta-analysisEmpirical
Analysis: The Role of Alternative Statistical Models in
Estimating Costs of ObesityStudy dataVariablesStudy design
and data analysisResultsA Systematic Review and Meta-
AnalysisDescriptive resultsQuality evaluationCost
estimatesStratified resultsDifferent study methodologyDifferent
confounder adjustmentEstimating Medical Costs of
ObesityCharacteristics of individuals in the data setEffect of
different target populationsEffect of different statistical
modelsConfounding factor adjustmentDiscussionSupplementary
MaterialsReferences
Abstract
Over the past 3 decades, the prevalence of overweight and
obesity has increased dramatically worldwide. The rising
trend of obesity indicates that this increase is not only
confined to the developed world, but also extending
towards the developing world. In the context, Saudi Arabia
is now among the nations with the highest obesity and
overweight prevalence rates due to a number of factors.
This research explores and evaluates the prevalence of
obesity in Saudi Arabia on the basis of the findings of
previous literature. The research reveals that the rate of
obesity is significantly high in the country among different
age groups and occupations; at different locations in the
country; and among both males and females. The main
factors causing obesity include family history, diet pattern
and eating habits, genetic factors, marital status,
hypertension and lack of physical activities; while, the major
consequences are cardiovascular diseases, diabetes,
cancers, and Ischemic heart disease. The research stresses
on the need to raise awareness regarding obesity and
design efforts and strategies to combat it in the country.
Keywords: Obesity, Heart disease, Cardiovascular,
Overweight, Sedentary lifestyles, Osteoarthritis, Body mass
index, Anthropometric
Introduction
The prevalence of obesity, over the past 3 decades, has
increased in many countries around the world. It is defined by a
30 or higher body mass index (BMI) [1]. The problem of obesity
extends globally as estimated by the WHO. In 2008, worldwide
1.5 billion adults were overweight, where nearly 300 million
women and over 200 million men were obese. However, across
different nations, the prevalence of obesity varies, ranging from
below 5% in Japan, China, Indonesia, India, and certain African
countries to over 75% in Nauru and Samoa. In addition,
childhood obesity is also on the rise globally, and an epidemic
in
some countries. Worldwide, 22 million children approximately,
under age 5, are estimated to be overweight. Obesity prevalence
has also increased dramatically among children aged 6-17 years,
which is extending into the developing world from the
developed nations. The rising trend, as indicated by
international data, is not confined to the developed world, and it
is predicted that by 2030, a majority of adult population of the
world would be either obese or overweight [2].
In the rise of obesity and overweight, the interaction of a
number of factors is contributing, which include metabolic,
genetic, environmental, and behavioural influences. According
to Mahmood and Arulkumaran, the rapid growth in the rate of
obesity is directly contributed by environmental and
behavioural
factors, rather than the biological factors. Moreover, racial or
ethnic differences, consumption pattern, and lifestyle also
influence the rate of obesity. For instance, as compared to rural
areas, people in urban areas have higher obesity rate, possibly
due to consumption of high-fat diets and more sedentary
lifestyles. For daily living, the amount of energy spent has also
reduced over the years, which also promotes obesity. Obesity is
also often associated with high socio-economic status; as
populations in the developed world are mostly affected by
obesity.
Over the past few decades, Saudi Arabia has become
increasingly westernized, and now it has one of the highest
obesity and overweight prevalence rates [3]. Obesity in the
county is a major cause of concern, where 7 out of 10 people
are
experiencing the problem [4]. Previous studies related to
prevalence of obesity in the Kingdom of Saudi Arabia (KSA)
indicate an increasing trend in obesity and overweight, which
are major sources of a number of other diseases, including
hypertension, diabetes, obstructive sleep apnea, hyperlipidemia,
and osteoarthritis [5].
The current research study aims to explore and evaluate the
prevalence of obesity in Saudi Arabia. Based on findings of
previous literature, the study examines the prevalence rate in
the country, and explains its causes and consequences.
Methodology
The study adopts a qualitative approach and follows a review-
design to explore the research problem. It performs a literature
review to evaluate the prevalence of obesity in the KSA, and
explain its causes and consequences in the country. It focuses
on
recent Saudi-specific literature and studies on obesity and
Review
iMedPub Journals
http://www.imedpub.com/
.
A Review of Prevalence of Obesity in Saudi Arabia
Saad Salman M. Alqarni*
Department of Basic Sciences, College of Science and Health
Professions, King Saud bin Abdualziz University for Health
Sciences (KSAU-HS), Riyadh,
Kingdom of Saudi Arabia
*Corresponding author: Saad Salman M Alqarni, Department of
Basic Sciences, College of Science and Health Professions,
King Saud bin Abdualziz
University for Health Sciences (KSAU-HS), Riyadh, Kingdom
of Saudi Arabia, Tel: 011 4295668; E-mail: [email protected]
Received date: September 13, 2016; Accepted date: October 20,
2016; Published date: October 25, 2016
Citation: M Alqarni SS (2016) A Review of Prevalence of
Obesity in Saudi Arabia. J Obes Eat Disord 2:2. doi:
10.21767/2471-8203.100025
Copyright: © 2016 M Alqarni SS. This is an open-access article
distributed u nder t he terms o f t he Creative Co mmons
Attribution Lice nse, which
permits unrestricted use, distribution, and reproduction in any
medium, provided the original author and source are credited.
Obesity & Eating Disorders
ISSN 2471-8203
Vol.2 No.2:25
2016
© Under License of Creative Commons Attribution 3.0 License |
This article is available from: 10.21767/2471-8203.100025 1
http://www.imedpub.com/
analyses the key findings. The research also evaluates and
analyses secondary quantitative data specific to obesity in the
KSA.
Literature Review
Obesity is regarded as a significant public health issue, which
has raised a concern globally. The WHO claims that, obesity has
more than doubled worldwide, since 1980. More than 1.9 adults
were overweight, in the year 2014, including over 600 million
obese individuals. 39% of the adults were overweight and 14%
were obese. Moreover, it is found that 41 million children
(under
age 5) around the world in 2014 were either overweight or
obese [6]. Previous studies have revealed that obesity is among
the major cause of co-morbidities, including cardiovascular
diseases, diabetes, cancers, and the related issues that may lead
to morbidity and mortality. In most of the countries, the high
total obesity and overweight cost represents a relative economic
burden on the GDP. Over the last decade, the prevalence of
obesity has increased significantly in several developed and
developing countries [7]. The current research paper focuses on
obesity in Saudi Arabia, which has now one of the highest
obesity and overweight prevalence rates [3].
Sabra examine obesity among female nursing students in
Dammam, Saudi Arabia using waist to hip ratio (WHR) and
body
mass index (BMI). The study collected data with the help of an
interviewer-administered questionnaire, from a sample of 260
female nursing students. The results of the study indicate the
Arterial Destiffening With Weight Loss in Overweight and Obese.docx

More Related Content

Similar to Arterial Destiffening With Weight Loss in Overweight and Obese.docx

Cardiothoracic Surgery.pptx
Cardiothoracic Surgery.pptxCardiothoracic Surgery.pptx
Cardiothoracic Surgery.pptxKiikConsultores
 
A Comparative Study of Pre Prandial and Post Prandial Heart Rate Variability ...
A Comparative Study of Pre Prandial and Post Prandial Heart Rate Variability ...A Comparative Study of Pre Prandial and Post Prandial Heart Rate Variability ...
A Comparative Study of Pre Prandial and Post Prandial Heart Rate Variability ...ijsrd.com
 
Nutritional Status, Lifestyle, and Risk Behaviors for Eating Disorders in Nut...
Nutritional Status, Lifestyle, and Risk Behaviors for Eating Disorders in Nut...Nutritional Status, Lifestyle, and Risk Behaviors for Eating Disorders in Nut...
Nutritional Status, Lifestyle, and Risk Behaviors for Eating Disorders in Nut...dewisetiyana52
 
Investigation of the changes on muscular endurance in response to aerobic and...
Investigation of the changes on muscular endurance in response to aerobic and...Investigation of the changes on muscular endurance in response to aerobic and...
Investigation of the changes on muscular endurance in response to aerobic and...Sports Journal
 
Assess The Effect of Resistance Training Compared To a Weight Loss Diet Progr...
Assess The Effect of Resistance Training Compared To a Weight Loss Diet Progr...Assess The Effect of Resistance Training Compared To a Weight Loss Diet Progr...
Assess The Effect of Resistance Training Compared To a Weight Loss Diet Progr...IOSR Journals
 
2013 List_Weight Cycling
2013 List_Weight Cycling2013 List_Weight Cycling
2013 List_Weight CyclingEdward List
 
To Assess the Effect of Body Mass Index on Cardiac Efficiency in Adolescent B...
To Assess the Effect of Body Mass Index on Cardiac Efficiency in Adolescent B...To Assess the Effect of Body Mass Index on Cardiac Efficiency in Adolescent B...
To Assess the Effect of Body Mass Index on Cardiac Efficiency in Adolescent B...iosrjce
 
Exercise or exercise and diet for preventing type 2 dm
Exercise or exercise and diet for preventing type 2 dmExercise or exercise and diet for preventing type 2 dm
Exercise or exercise and diet for preventing type 2 dmDiabetes for all
 
Clinical portfolio
Clinical portfolioClinical portfolio
Clinical portfolioBen Gonano
 
Plugin jago -effect of-4_weeks_of_pilates_on_the_
Plugin jago -effect of-4_weeks_of_pilates_on_the_Plugin jago -effect of-4_weeks_of_pilates_on_the_
Plugin jago -effect of-4_weeks_of_pilates_on_the_Dra. Welker Fisioterapeuta
 
Effect of 4 weeks of Pilates on the body composition of young girls
Effect of 4 weeks of Pilates on the body composition of young girlsEffect of 4 weeks of Pilates on the body composition of young girls
Effect of 4 weeks of Pilates on the body composition of young girlsDra. Welker Fisioterapeuta
 
The effect of high-fat versus high-carb diet on body composition in strength-...
The effect of high-fat versus high-carb diet on body composition in strength-...The effect of high-fat versus high-carb diet on body composition in strength-...
The effect of high-fat versus high-carb diet on body composition in strength-...RefoRefaat
 
vaishnavi journal presentation obg (1).pptx
vaishnavi journal presentation obg (1).pptxvaishnavi journal presentation obg (1).pptx
vaishnavi journal presentation obg (1).pptxVaishnaviElumalai
 
Impact-of-weight-reduction-on-pericardial-adipose-tissue-and-cardiac-structur...
Impact-of-weight-reduction-on-pericardial-adipose-tissue-and-cardiac-structur...Impact-of-weight-reduction-on-pericardial-adipose-tissue-and-cardiac-structur...
Impact-of-weight-reduction-on-pericardial-adipose-tissue-and-cardiac-structur...Hany Abed
 

Similar to Arterial Destiffening With Weight Loss in Overweight and Obese.docx (20)

Agostinis sobrinho2018
Agostinis sobrinho2018Agostinis sobrinho2018
Agostinis sobrinho2018
 
Queen's Study
Queen's StudyQueen's Study
Queen's Study
 
Flechtner
FlechtnerFlechtner
Flechtner
 
Cardiothoracic Surgery.pptx
Cardiothoracic Surgery.pptxCardiothoracic Surgery.pptx
Cardiothoracic Surgery.pptx
 
A Comparative Study of Pre Prandial and Post Prandial Heart Rate Variability ...
A Comparative Study of Pre Prandial and Post Prandial Heart Rate Variability ...A Comparative Study of Pre Prandial and Post Prandial Heart Rate Variability ...
A Comparative Study of Pre Prandial and Post Prandial Heart Rate Variability ...
 
Nutritional Status, Lifestyle, and Risk Behaviors for Eating Disorders in Nut...
Nutritional Status, Lifestyle, and Risk Behaviors for Eating Disorders in Nut...Nutritional Status, Lifestyle, and Risk Behaviors for Eating Disorders in Nut...
Nutritional Status, Lifestyle, and Risk Behaviors for Eating Disorders in Nut...
 
Investigation of the changes on muscular endurance in response to aerobic and...
Investigation of the changes on muscular endurance in response to aerobic and...Investigation of the changes on muscular endurance in response to aerobic and...
Investigation of the changes on muscular endurance in response to aerobic and...
 
Cardio vascular functional capacity and reactivity to exercise in Normotensiv...
Cardio vascular functional capacity and reactivity to exercise in Normotensiv...Cardio vascular functional capacity and reactivity to exercise in Normotensiv...
Cardio vascular functional capacity and reactivity to exercise in Normotensiv...
 
Assess The Effect of Resistance Training Compared To a Weight Loss Diet Progr...
Assess The Effect of Resistance Training Compared To a Weight Loss Diet Progr...Assess The Effect of Resistance Training Compared To a Weight Loss Diet Progr...
Assess The Effect of Resistance Training Compared To a Weight Loss Diet Progr...
 
2013 List_Weight Cycling
2013 List_Weight Cycling2013 List_Weight Cycling
2013 List_Weight Cycling
 
To Assess the Effect of Body Mass Index on Cardiac Efficiency in Adolescent B...
To Assess the Effect of Body Mass Index on Cardiac Efficiency in Adolescent B...To Assess the Effect of Body Mass Index on Cardiac Efficiency in Adolescent B...
To Assess the Effect of Body Mass Index on Cardiac Efficiency in Adolescent B...
 
Waist circumference
Waist circumferenceWaist circumference
Waist circumference
 
Exercise or exercise and diet for preventing type 2 dm
Exercise or exercise and diet for preventing type 2 dmExercise or exercise and diet for preventing type 2 dm
Exercise or exercise and diet for preventing type 2 dm
 
Clinical portfolio
Clinical portfolioClinical portfolio
Clinical portfolio
 
Plugin jago -effect of-4_weeks_of_pilates_on_the_
Plugin jago -effect of-4_weeks_of_pilates_on_the_Plugin jago -effect of-4_weeks_of_pilates_on_the_
Plugin jago -effect of-4_weeks_of_pilates_on_the_
 
Effect of 4 weeks of Pilates on the body composition of young girls
Effect of 4 weeks of Pilates on the body composition of young girlsEffect of 4 weeks of Pilates on the body composition of young girls
Effect of 4 weeks of Pilates on the body composition of young girls
 
The effect of high-fat versus high-carb diet on body composition in strength-...
The effect of high-fat versus high-carb diet on body composition in strength-...The effect of high-fat versus high-carb diet on body composition in strength-...
The effect of high-fat versus high-carb diet on body composition in strength-...
 
vaishnavi journal presentation obg (1).pptx
vaishnavi journal presentation obg (1).pptxvaishnavi journal presentation obg (1).pptx
vaishnavi journal presentation obg (1).pptx
 
Annotated Bibliography
Annotated BibliographyAnnotated Bibliography
Annotated Bibliography
 
Impact-of-weight-reduction-on-pericardial-adipose-tissue-and-cardiac-structur...
Impact-of-weight-reduction-on-pericardial-adipose-tissue-and-cardiac-structur...Impact-of-weight-reduction-on-pericardial-adipose-tissue-and-cardiac-structur...
Impact-of-weight-reduction-on-pericardial-adipose-tissue-and-cardiac-structur...
 

More from rossskuddershamus

As a human resources manager, you need to advise top leadership (CEO.docx
As a human resources manager, you need to advise top leadership (CEO.docxAs a human resources manager, you need to advise top leadership (CEO.docx
As a human resources manager, you need to advise top leadership (CEO.docxrossskuddershamus
 
As a homeowner, you have become more concerned about the energy is.docx
As a homeowner, you have become more concerned about the energy is.docxAs a homeowner, you have become more concerned about the energy is.docx
As a homeowner, you have become more concerned about the energy is.docxrossskuddershamus
 
As a healthcare professional, you will be working closely with o.docx
As a healthcare professional, you will be working closely with o.docxAs a healthcare professional, you will be working closely with o.docx
As a healthcare professional, you will be working closely with o.docxrossskuddershamus
 
As a future teacher exposed to the rising trend of blogs and adv.docx
As a future teacher exposed to the rising trend of blogs and adv.docxAs a future teacher exposed to the rising trend of blogs and adv.docx
As a future teacher exposed to the rising trend of blogs and adv.docxrossskuddershamus
 
As a fresh research intern, you are a part of the hypothetical.docx
As a fresh research intern, you are a part of the hypothetical.docxAs a fresh research intern, you are a part of the hypothetical.docx
As a fresh research intern, you are a part of the hypothetical.docxrossskuddershamus
 
As a fresh research intern, you are a part of the hypothetical Nat.docx
As a fresh research intern, you are a part of the hypothetical Nat.docxAs a fresh research intern, you are a part of the hypothetical Nat.docx
As a fresh research intern, you are a part of the hypothetical Nat.docxrossskuddershamus
 
As a former emergency department Registered Nurse for over seven.docx
As a former emergency department Registered Nurse for over seven.docxAs a former emergency department Registered Nurse for over seven.docx
As a former emergency department Registered Nurse for over seven.docxrossskuddershamus
 
As a doctorally prepared nurse, you are writing a Continuous Qua.docx
As a doctorally prepared nurse, you are writing a Continuous Qua.docxAs a doctorally prepared nurse, you are writing a Continuous Qua.docx
As a doctorally prepared nurse, you are writing a Continuous Qua.docxrossskuddershamus
 
As a consumer of information, do you generally look for objectivity .docx
As a consumer of information, do you generally look for objectivity .docxAs a consumer of information, do you generally look for objectivity .docx
As a consumer of information, do you generally look for objectivity .docxrossskuddershamus
 
As a center of intellectual life and learning, Timbuktua. had ver.docx
As a center of intellectual life and learning, Timbuktua. had ver.docxAs a center of intellectual life and learning, Timbuktua. had ver.docx
As a center of intellectual life and learning, Timbuktua. had ver.docxrossskuddershamus
 
ary AssignmentCertified medical administrative assistants (CMAAs) .docx
ary AssignmentCertified medical administrative assistants (CMAAs) .docxary AssignmentCertified medical administrative assistants (CMAAs) .docx
ary AssignmentCertified medical administrative assistants (CMAAs) .docxrossskuddershamus
 
As (or after) you read The Declaration of Independence, identify.docx
As (or after) you read The Declaration of Independence, identify.docxAs (or after) you read The Declaration of Independence, identify.docx
As (or after) you read The Declaration of Independence, identify.docxrossskuddershamus
 
ARTWORK Markus Linnenbrink HOWTOSURVIVE, 2012, epoxy resin .docx
ARTWORK Markus Linnenbrink HOWTOSURVIVE, 2012, epoxy resin  .docxARTWORK Markus Linnenbrink HOWTOSURVIVE, 2012, epoxy resin  .docx
ARTWORK Markus Linnenbrink HOWTOSURVIVE, 2012, epoxy resin .docxrossskuddershamus
 
AS 4678—2002www.standards.com.au © Standards Australia .docx
AS 4678—2002www.standards.com.au © Standards Australia .docxAS 4678—2002www.standards.com.au © Standards Australia .docx
AS 4678—2002www.standards.com.au © Standards Australia .docxrossskuddershamus
 
arugumentative essay on article given belowIn Parents Keep Chil.docx
arugumentative essay on article given belowIn Parents Keep Chil.docxarugumentative essay on article given belowIn Parents Keep Chil.docx
arugumentative essay on article given belowIn Parents Keep Chil.docxrossskuddershamus
 
artsArticleCircling Round Vitruvius, Linear Perspectiv.docx
artsArticleCircling Round Vitruvius, Linear Perspectiv.docxartsArticleCircling Round Vitruvius, Linear Perspectiv.docx
artsArticleCircling Round Vitruvius, Linear Perspectiv.docxrossskuddershamus
 
ARTS & NATURE MARKETING PROJECT OF SHEFFIELDYang yux.docx
ARTS & NATURE MARKETING PROJECT OF SHEFFIELDYang yux.docxARTS & NATURE MARKETING PROJECT OF SHEFFIELDYang yux.docx
ARTS & NATURE MARKETING PROJECT OF SHEFFIELDYang yux.docxrossskuddershamus
 
ARTIGO ORIGINALRevista Cient.docx
ARTIGO ORIGINALRevista Cient.docxARTIGO ORIGINALRevista Cient.docx
ARTIGO ORIGINALRevista Cient.docxrossskuddershamus
 
Artist Analysis Project – Due Week 61)Powerpoint project at le.docx
Artist Analysis Project – Due Week 61)Powerpoint project at le.docxArtist Analysis Project – Due Week 61)Powerpoint project at le.docx
Artist Analysis Project – Due Week 61)Powerpoint project at le.docxrossskuddershamus
 
Artist Research Paper RequirementsYou are to write a 3 page double.docx
Artist Research Paper RequirementsYou are to write a 3 page double.docxArtist Research Paper RequirementsYou are to write a 3 page double.docx
Artist Research Paper RequirementsYou are to write a 3 page double.docxrossskuddershamus
 

More from rossskuddershamus (20)

As a human resources manager, you need to advise top leadership (CEO.docx
As a human resources manager, you need to advise top leadership (CEO.docxAs a human resources manager, you need to advise top leadership (CEO.docx
As a human resources manager, you need to advise top leadership (CEO.docx
 
As a homeowner, you have become more concerned about the energy is.docx
As a homeowner, you have become more concerned about the energy is.docxAs a homeowner, you have become more concerned about the energy is.docx
As a homeowner, you have become more concerned about the energy is.docx
 
As a healthcare professional, you will be working closely with o.docx
As a healthcare professional, you will be working closely with o.docxAs a healthcare professional, you will be working closely with o.docx
As a healthcare professional, you will be working closely with o.docx
 
As a future teacher exposed to the rising trend of blogs and adv.docx
As a future teacher exposed to the rising trend of blogs and adv.docxAs a future teacher exposed to the rising trend of blogs and adv.docx
As a future teacher exposed to the rising trend of blogs and adv.docx
 
As a fresh research intern, you are a part of the hypothetical.docx
As a fresh research intern, you are a part of the hypothetical.docxAs a fresh research intern, you are a part of the hypothetical.docx
As a fresh research intern, you are a part of the hypothetical.docx
 
As a fresh research intern, you are a part of the hypothetical Nat.docx
As a fresh research intern, you are a part of the hypothetical Nat.docxAs a fresh research intern, you are a part of the hypothetical Nat.docx
As a fresh research intern, you are a part of the hypothetical Nat.docx
 
As a former emergency department Registered Nurse for over seven.docx
As a former emergency department Registered Nurse for over seven.docxAs a former emergency department Registered Nurse for over seven.docx
As a former emergency department Registered Nurse for over seven.docx
 
As a doctorally prepared nurse, you are writing a Continuous Qua.docx
As a doctorally prepared nurse, you are writing a Continuous Qua.docxAs a doctorally prepared nurse, you are writing a Continuous Qua.docx
As a doctorally prepared nurse, you are writing a Continuous Qua.docx
 
As a consumer of information, do you generally look for objectivity .docx
As a consumer of information, do you generally look for objectivity .docxAs a consumer of information, do you generally look for objectivity .docx
As a consumer of information, do you generally look for objectivity .docx
 
As a center of intellectual life and learning, Timbuktua. had ver.docx
As a center of intellectual life and learning, Timbuktua. had ver.docxAs a center of intellectual life and learning, Timbuktua. had ver.docx
As a center of intellectual life and learning, Timbuktua. had ver.docx
 
ary AssignmentCertified medical administrative assistants (CMAAs) .docx
ary AssignmentCertified medical administrative assistants (CMAAs) .docxary AssignmentCertified medical administrative assistants (CMAAs) .docx
ary AssignmentCertified medical administrative assistants (CMAAs) .docx
 
As (or after) you read The Declaration of Independence, identify.docx
As (or after) you read The Declaration of Independence, identify.docxAs (or after) you read The Declaration of Independence, identify.docx
As (or after) you read The Declaration of Independence, identify.docx
 
ARTWORK Markus Linnenbrink HOWTOSURVIVE, 2012, epoxy resin .docx
ARTWORK Markus Linnenbrink HOWTOSURVIVE, 2012, epoxy resin  .docxARTWORK Markus Linnenbrink HOWTOSURVIVE, 2012, epoxy resin  .docx
ARTWORK Markus Linnenbrink HOWTOSURVIVE, 2012, epoxy resin .docx
 
AS 4678—2002www.standards.com.au © Standards Australia .docx
AS 4678—2002www.standards.com.au © Standards Australia .docxAS 4678—2002www.standards.com.au © Standards Australia .docx
AS 4678—2002www.standards.com.au © Standards Australia .docx
 
arugumentative essay on article given belowIn Parents Keep Chil.docx
arugumentative essay on article given belowIn Parents Keep Chil.docxarugumentative essay on article given belowIn Parents Keep Chil.docx
arugumentative essay on article given belowIn Parents Keep Chil.docx
 
artsArticleCircling Round Vitruvius, Linear Perspectiv.docx
artsArticleCircling Round Vitruvius, Linear Perspectiv.docxartsArticleCircling Round Vitruvius, Linear Perspectiv.docx
artsArticleCircling Round Vitruvius, Linear Perspectiv.docx
 
ARTS & NATURE MARKETING PROJECT OF SHEFFIELDYang yux.docx
ARTS & NATURE MARKETING PROJECT OF SHEFFIELDYang yux.docxARTS & NATURE MARKETING PROJECT OF SHEFFIELDYang yux.docx
ARTS & NATURE MARKETING PROJECT OF SHEFFIELDYang yux.docx
 
ARTIGO ORIGINALRevista Cient.docx
ARTIGO ORIGINALRevista Cient.docxARTIGO ORIGINALRevista Cient.docx
ARTIGO ORIGINALRevista Cient.docx
 
Artist Analysis Project – Due Week 61)Powerpoint project at le.docx
Artist Analysis Project – Due Week 61)Powerpoint project at le.docxArtist Analysis Project – Due Week 61)Powerpoint project at le.docx
Artist Analysis Project – Due Week 61)Powerpoint project at le.docx
 
Artist Research Paper RequirementsYou are to write a 3 page double.docx
Artist Research Paper RequirementsYou are to write a 3 page double.docxArtist Research Paper RequirementsYou are to write a 3 page double.docx
Artist Research Paper RequirementsYou are to write a 3 page double.docx
 

Recently uploaded

Interactive Powerpoint_How to Master effective communication
Interactive Powerpoint_How to Master effective communicationInteractive Powerpoint_How to Master effective communication
Interactive Powerpoint_How to Master effective communicationnomboosow
 
Call Girls in Dwarka Mor Delhi Contact Us 9654467111
Call Girls in Dwarka Mor Delhi Contact Us 9654467111Call Girls in Dwarka Mor Delhi Contact Us 9654467111
Call Girls in Dwarka Mor Delhi Contact Us 9654467111Sapana Sha
 
Z Score,T Score, Percential Rank and Box Plot Graph
Z Score,T Score, Percential Rank and Box Plot GraphZ Score,T Score, Percential Rank and Box Plot Graph
Z Score,T Score, Percential Rank and Box Plot GraphThiyagu K
 
The byproduct of sericulture in different industries.pptx
The byproduct of sericulture in different industries.pptxThe byproduct of sericulture in different industries.pptx
The byproduct of sericulture in different industries.pptxShobhayan Kirtania
 
JAPAN: ORGANISATION OF PMDA, PHARMACEUTICAL LAWS & REGULATIONS, TYPES OF REGI...
JAPAN: ORGANISATION OF PMDA, PHARMACEUTICAL LAWS & REGULATIONS, TYPES OF REGI...JAPAN: ORGANISATION OF PMDA, PHARMACEUTICAL LAWS & REGULATIONS, TYPES OF REGI...
JAPAN: ORGANISATION OF PMDA, PHARMACEUTICAL LAWS & REGULATIONS, TYPES OF REGI...anjaliyadav012327
 
Measures of Central Tendency: Mean, Median and Mode
Measures of Central Tendency: Mean, Median and ModeMeasures of Central Tendency: Mean, Median and Mode
Measures of Central Tendency: Mean, Median and ModeThiyagu K
 
Introduction to Nonprofit Accounting: The Basics
Introduction to Nonprofit Accounting: The BasicsIntroduction to Nonprofit Accounting: The Basics
Introduction to Nonprofit Accounting: The BasicsTechSoup
 
Ecosystem Interactions Class Discussion Presentation in Blue Green Lined Styl...
Ecosystem Interactions Class Discussion Presentation in Blue Green Lined Styl...Ecosystem Interactions Class Discussion Presentation in Blue Green Lined Styl...
Ecosystem Interactions Class Discussion Presentation in Blue Green Lined Styl...fonyou31
 
microwave assisted reaction. General introduction
microwave assisted reaction. General introductionmicrowave assisted reaction. General introduction
microwave assisted reaction. General introductionMaksud Ahmed
 
Nutritional Needs Presentation - HLTH 104
Nutritional Needs Presentation - HLTH 104Nutritional Needs Presentation - HLTH 104
Nutritional Needs Presentation - HLTH 104misteraugie
 
social pharmacy d-pharm 1st year by Pragati K. Mahajan
social pharmacy d-pharm 1st year by Pragati K. Mahajansocial pharmacy d-pharm 1st year by Pragati K. Mahajan
social pharmacy d-pharm 1st year by Pragati K. Mahajanpragatimahajan3
 
Mastering the Unannounced Regulatory Inspection
Mastering the Unannounced Regulatory InspectionMastering the Unannounced Regulatory Inspection
Mastering the Unannounced Regulatory InspectionSafetyChain Software
 
Beyond the EU: DORA and NIS 2 Directive's Global Impact
Beyond the EU: DORA and NIS 2 Directive's Global ImpactBeyond the EU: DORA and NIS 2 Directive's Global Impact
Beyond the EU: DORA and NIS 2 Directive's Global ImpactPECB
 
Sports & Fitness Value Added Course FY..
Sports & Fitness Value Added Course FY..Sports & Fitness Value Added Course FY..
Sports & Fitness Value Added Course FY..Disha Kariya
 
Organic Name Reactions for the students and aspirants of Chemistry12th.pptx
Organic Name Reactions  for the students and aspirants of Chemistry12th.pptxOrganic Name Reactions  for the students and aspirants of Chemistry12th.pptx
Organic Name Reactions for the students and aspirants of Chemistry12th.pptxVS Mahajan Coaching Centre
 
Accessible design: Minimum effort, maximum impact
Accessible design: Minimum effort, maximum impactAccessible design: Minimum effort, maximum impact
Accessible design: Minimum effort, maximum impactdawncurless
 
The Most Excellent Way | 1 Corinthians 13
The Most Excellent Way | 1 Corinthians 13The Most Excellent Way | 1 Corinthians 13
The Most Excellent Way | 1 Corinthians 13Steve Thomason
 

Recently uploaded (20)

Código Creativo y Arte de Software | Unidad 1
Código Creativo y Arte de Software | Unidad 1Código Creativo y Arte de Software | Unidad 1
Código Creativo y Arte de Software | Unidad 1
 
Interactive Powerpoint_How to Master effective communication
Interactive Powerpoint_How to Master effective communicationInteractive Powerpoint_How to Master effective communication
Interactive Powerpoint_How to Master effective communication
 
Call Girls in Dwarka Mor Delhi Contact Us 9654467111
Call Girls in Dwarka Mor Delhi Contact Us 9654467111Call Girls in Dwarka Mor Delhi Contact Us 9654467111
Call Girls in Dwarka Mor Delhi Contact Us 9654467111
 
Advance Mobile Application Development class 07
Advance Mobile Application Development class 07Advance Mobile Application Development class 07
Advance Mobile Application Development class 07
 
Z Score,T Score, Percential Rank and Box Plot Graph
Z Score,T Score, Percential Rank and Box Plot GraphZ Score,T Score, Percential Rank and Box Plot Graph
Z Score,T Score, Percential Rank and Box Plot Graph
 
The byproduct of sericulture in different industries.pptx
The byproduct of sericulture in different industries.pptxThe byproduct of sericulture in different industries.pptx
The byproduct of sericulture in different industries.pptx
 
JAPAN: ORGANISATION OF PMDA, PHARMACEUTICAL LAWS & REGULATIONS, TYPES OF REGI...
JAPAN: ORGANISATION OF PMDA, PHARMACEUTICAL LAWS & REGULATIONS, TYPES OF REGI...JAPAN: ORGANISATION OF PMDA, PHARMACEUTICAL LAWS & REGULATIONS, TYPES OF REGI...
JAPAN: ORGANISATION OF PMDA, PHARMACEUTICAL LAWS & REGULATIONS, TYPES OF REGI...
 
Measures of Central Tendency: Mean, Median and Mode
Measures of Central Tendency: Mean, Median and ModeMeasures of Central Tendency: Mean, Median and Mode
Measures of Central Tendency: Mean, Median and Mode
 
Introduction to Nonprofit Accounting: The Basics
Introduction to Nonprofit Accounting: The BasicsIntroduction to Nonprofit Accounting: The Basics
Introduction to Nonprofit Accounting: The Basics
 
Ecosystem Interactions Class Discussion Presentation in Blue Green Lined Styl...
Ecosystem Interactions Class Discussion Presentation in Blue Green Lined Styl...Ecosystem Interactions Class Discussion Presentation in Blue Green Lined Styl...
Ecosystem Interactions Class Discussion Presentation in Blue Green Lined Styl...
 
microwave assisted reaction. General introduction
microwave assisted reaction. General introductionmicrowave assisted reaction. General introduction
microwave assisted reaction. General introduction
 
Nutritional Needs Presentation - HLTH 104
Nutritional Needs Presentation - HLTH 104Nutritional Needs Presentation - HLTH 104
Nutritional Needs Presentation - HLTH 104
 
social pharmacy d-pharm 1st year by Pragati K. Mahajan
social pharmacy d-pharm 1st year by Pragati K. Mahajansocial pharmacy d-pharm 1st year by Pragati K. Mahajan
social pharmacy d-pharm 1st year by Pragati K. Mahajan
 
INDIA QUIZ 2024 RLAC DELHI UNIVERSITY.pptx
INDIA QUIZ 2024 RLAC DELHI UNIVERSITY.pptxINDIA QUIZ 2024 RLAC DELHI UNIVERSITY.pptx
INDIA QUIZ 2024 RLAC DELHI UNIVERSITY.pptx
 
Mastering the Unannounced Regulatory Inspection
Mastering the Unannounced Regulatory InspectionMastering the Unannounced Regulatory Inspection
Mastering the Unannounced Regulatory Inspection
 
Beyond the EU: DORA and NIS 2 Directive's Global Impact
Beyond the EU: DORA and NIS 2 Directive's Global ImpactBeyond the EU: DORA and NIS 2 Directive's Global Impact
Beyond the EU: DORA and NIS 2 Directive's Global Impact
 
Sports & Fitness Value Added Course FY..
Sports & Fitness Value Added Course FY..Sports & Fitness Value Added Course FY..
Sports & Fitness Value Added Course FY..
 
Organic Name Reactions for the students and aspirants of Chemistry12th.pptx
Organic Name Reactions  for the students and aspirants of Chemistry12th.pptxOrganic Name Reactions  for the students and aspirants of Chemistry12th.pptx
Organic Name Reactions for the students and aspirants of Chemistry12th.pptx
 
Accessible design: Minimum effort, maximum impact
Accessible design: Minimum effort, maximum impactAccessible design: Minimum effort, maximum impact
Accessible design: Minimum effort, maximum impact
 
The Most Excellent Way | 1 Corinthians 13
The Most Excellent Way | 1 Corinthians 13The Most Excellent Way | 1 Corinthians 13
The Most Excellent Way | 1 Corinthians 13
 

Arterial Destiffening With Weight Loss in Overweight and Obese.docx

  • 1. Arterial Destiffening With Weight Loss in Overweight and Obese Middle-Aged and Older Adults A. Laura Dengo, Elizabeth A. Dennis, Jeb S. Orr, Elaina L. Marinik, Elizabeth Ehrlich, Brenda M. Davy, and Kevin P. Davy From the Human Integrative Physiology Laboratory, Department of Human Nutrition, Foods, and Exercise, Virginia Polytechnic Institute and State University, Blacksburg, Va. Abstract We tested the hypothesis that weight loss via a hypocaloric diet would reduce arterial stiffness in overweight and obese middle-aged and older adults. Thirty-six individuals were randomly assigned to a weight loss (n=25; age: 61.2±0.8 years; body mass index: 30.0±0.6 kg/m2) or a control (n=11; age: 66.1±1.9 years; body mass index: 31.8±1.4 kg/m2) group. Arterial stiffness was measured via carotid artery ultrasonography combined with applanation tonometry and carotid-femoral pulse wave velocity via applanation tonometry at baseline and after the 12-week intervention. Body weight, body fat, abdominal adiposity, blood pressure, β-stiffness index, and carotid-femoral pulse wave velocity were similar in the 2 groups at baseline (all P>0.05). Body weight (−7.1±0.7 versus −0.7±1.1 kg), body fat, and abdominal adiposity decreased in the weight loss group but not in the control group (all P<0.05). Brachial
  • 2. systolic and diastolic blood pressures declined (P<0.05) only in the weight loss group. Central systolic and pulse pressures did not change significantly in either group. β-Stiffness index (−1.24±0.22 versus 0.52±0.37 U) and carotid-femoral pulse wave velocity (−187±29 versus 15±42 cm/s) decreased in the weight loss group but not in the control group (all P<0.05). The reductions in carotid-femoral pulse wave velocity were correlated with reductions in total body and abdominal adiposity (r=0.357– 0.602; all P<0.05). However, neither total body nor abdominal adiposity independently predicted reductions in arterial stiffness indices. In summary, our findings indicate that weight loss reduces arterial stiffness in overweight/obese middle-aged and older adults, and the magnitudes of these improvements are related to the loss of total and abdominal adiposity. Keywords arterial structure; arterial compliance; aging; pulse wave velocity; caloric restriction Advancing age is associated with stiffening of the large elastic arteries of the cardiothoracic region.1,2 Total body and abdominal adiposity increase with advancing age,3 and excess fat accumulation, particularly in the abdominal visceral region, is associated with accelerated large artery stiffening in middle-aged and older adults.4,5 Importantly, large artery stiffening contributes to the age-related rise in systolic blood pressure (BP; SBP)6 and is an independent predictor of total and cardiovascular mortality among older adults.7
  • 3. © 2010 American Heart Association, Inc. Correspondence to Kevin P. Davy, Human Integrative Physiology Laboratory, Department of Human Nutrition, Foods, and Exercise, Virginia Polytechnic Institute and State University, Blacksburg, VA 24061. [email protected] Disclosures None. NIH Public Access Author Manuscript Hypertension. Author manuscript; available in PMC 2011 April 1. Published in final edited form as: Hypertension. 2010 April ; 55(4): 855–861. doi:10.1161/HYPERTENSIONAHA.109.147850. N IH -P A A uthor M anuscript N IH -P A A
  • 4. uthor M anuscript N IH -P A A uthor M anuscript The results of several studies suggest that weight loss may be efficacious in reducing large artery stiffness in the cardiothoracic region.8–12 To date, only 1 randomized, controlled trial has been conducted to address this issue.8 Balkestein et al8 reported that weight loss increased carotid artery distensibility and that exercise did not result in an additive effect. However, the lack of an adequate control group, small sample size, and focus on primarily young and middle-aged males limits generalizability and precludes a clear understanding of the impact of weight loss on arterial stiffness. This is a critical void given that weight loss is the cornerstone of obesity management and there are currently few strategies available for reducing arterial stiffness. Accordingly, we tested the hypothesis that weight loss via a hypocaloric diet alone would reduce arterial stiffness in
  • 5. overweight and obese middle-aged and older adults. We further hypothesized that the reduction in arterial stiffness with weight loss, if observed, would be associated with the magnitude of reduction in total body or abdominal adiposity. Methods Subjects Thirty-six men (n=15) and women (n=21) 55 to 75 years of age volunteered to participate in the study. All of the subjects were sedentary to recreationally active and free of overt disease. None of the subjects were smokers or taking medications that affect body weight or appetite. The Virginia Polytechnic Institute and State University Institutional Review Board approved the protocol. The nature, purpose, risks, and benefits were explained to each subject before obtaining informed consent. Intervention After baseline testing, subjects were randomly assigned to a weight loss (n=25) intervention or a control group (n=11). The subjects randomized to the weight loss intervention followed a hypocaloric diet (1200 to 1500 kcal) based on the US Department of Agriculture food guide pyramid guidelines10 and were instructed to maintain their habitual physical activity level. The control group was instructed to maintain their current body weight, habitual physical activity level, and dietary intake. During the 12-week weight loss intervention period, subjects met with a dietitian and had their body weight
  • 6. measured weekly. Each subject was weight stable for ≥2 weeks before follow-up testing. All of the measurements were performed between 8:00 AM and 11:00 AM after a 12-hour fast and having performed no vigorous physical activity for the previous 48 hours. All of the subjects reported being free of acute illness during the week before testing. Measurements Body weight was measured to the nearest 0.1 kg on a digital scale (Scale-Tronix model 5002). Height was measured using a stadiometer. Waist circumference was measured at the umbilical level with a spring-loaded Gulick measuring tape. Body composition was determined via dual energy x-ray absorptiometry (GE Lunar Prodigy Advance, software version 8.10e). Abdominal fat distribution was measured using computed tomography (HiSpeed CT/I, GE Medical), as described previously.13 Total, subcutaneous, and visceral fat areas were quantified using commercially available software (SliceOmatic, version 4.3, Tomovision). Resting heart rate was obtained from lead II of an ECG. Habitual dietary intake and physical activity were assessed via self-reported 4- day food intake records and accelerometry (GT1M, Actigraph Inc), respectively. Energy and macronutrient intake were assessed using nutritional analysis software (NDS-R 6.0, University of Minnesota). Plasma lipid and lipoprotein concentrations were measured in a commercial laboratory using conventional methods. Plasma glucose concentration was measured using a YSI glucose
  • 7. Dengo et al. Page 2 Hypertension. Author manuscript; available in PMC 2011 April 1. N IH -P A A uthor M anuscript N IH -P A A uthor M anuscript N IH -P A A uthor M
  • 8. anuscript analyzer (model 2300, Yellow Springs Instruments). Plasma insulin concentration was quantified using a commercially available ELISA kit (Linco Research, Inc). β-Stiffness index (β-SI)14 was measured as described previously.15,16 Briefly, left common carotid artery diameters were obtained 1 to 2 cm from the carotid bulb with an ultrasound unit equipped with a high-resolution linear array transducer (3 to 11 MHz). Systolic and diastolic carotid diameters were quantified offline using commercially available software (Vascular Research Tools 5, Medical Imaging Applications, LLC). Carotid waveforms were obtained using applanation tonometry of the contralateral common carotid artery and calibrated to brachial diastolic BP (DBP) and mean arterial BP obtained by automated sphygmomanometry in the supine posture. Brachial pulse pressure (PP) was calculated as the difference between SBP and DBP. Central SBP and PP were obtained from the peak and the difference between the peak and nadir of the calibrated waveform, respectively. Amplifications of SBP and PP were calculated as the difference between central and brachial SBP and PP, respectively. Carotid-femoral (C–F) pulse wave velocity (PWV) measurements were obtained after 20 minutes of quiet rest in the supine position, as described
  • 9. previously.16 Pulse waveforms were obtained via applanation tonometry (Probe SPT-301, Millar Instruments) and recorded simultaneously at the right C–F arteries. The linear distance between the carotid and femoral arteries at the highest point on the patient between the recording sites was measured with a tape measure to the nearest 0.5 cm. The C–F distance did not change (P>0.05) with the weight loss intervention, and the baseline and postinterventions distances were highly correlated (Spearman ρ=0.886; P<0.05). In addition, the effects of weight loss on C–F PWV were virtually identical when the postintervention distance was substituted for the baseline distance in the calculation of baseline C–F PWV (data not shown). C–F recordings of waveforms over 10 to 20 cardiac cycles were analyzed using signal processing software (Windaq, Dataq Instruments). PWV was calculated by dividing travel distance by travel time from foot to foot of the pulse waves. Although C–F PWV is a close surrogate for aortic PWV, we also report estimated aortic PWV using the equation developed by Vermeersch et al17 for comparison. Statistical Analysis Independent sample t tests were used to compare subject characteristics and dependent variables at baseline in the weight loss and control groups. χ2 analysis was used to compare the overall frequency of medication use between the 2 groups. Repeated-measures ANOVA was used to compare changes in subject characteristics and dependent variables over time
  • 10. between the 2 groups. Our study was not powered to test sex differences. As such, the pooled data are presented. Simple correlations were performed to assess relations among variables of interest. Linear regression was used to test the independent effects of measures of total body and abdominal adiposity on the reduction in arterial stiffness (C–F PWV). Furthermore, a test of mediation using linear regression was used to determine whether the change in C–F PWV with treatment was mediated by the reduction in mean BP.18 Mediation would be supported if weight loss significantly predicted the change in C–F PWV, weight loss significantly predicted the change in mean BP, and mean BP significantly predicted C– F PWV. This approach was also used to determine whether the change in C–F PWV with treatment was mediated by the reduction in sodium intake. All of the data are expressed as mean±SE. The significance level was set a priori at the P<0.05 level. Results Subject characteristics at baseline and after the intervention are shown in Table 1. There were no significant differences in body weight, body composition, abdominal fat Dengo et al. Page 3 Hypertension. Author manuscript; available in PMC 2011 April 1. N IH
  • 11. -P A A uthor M anuscript N IH -P A A uthor M anuscript N IH -P A A uthor M anuscript distribution, BP, or lipid and lipoprotein concentrations between the 2 groups at baseline. Plasma glucose and insulin concentrations were also similar (P>0.05) in the 2 groups. Body
  • 12. weight decreased (−7.1±0.7 versus −0.7±0.4 kg; P<0.05) after the intervention in the weight loss compared with the control group because of reductions in both body fat (≤4.6±0.6 versus −0.1±0.4 kg; P<0.05) and fat free mass (−1.5±0.3 versus 0.1±0.4 kg; P<0.05; Table 1). Total abdominal fat decreased (−101±14 versus −8±13 cm2; P<0.05) in the weight loss group because of reductions in abdominal subcutaneous (−55±9 versus −9±14 cm2; P<0.05) and abdominal visceral fat (−44±8 versus −3±7 cm2; P<0.05). Brachial SBP and DBP, as well as heart rate, decreased (P<0.05) in the weight loss group, but no significant changes were observed in the control group (Table 1). Central SBPs and PPs declined in both groups, but the magnitude of reduction did not differ significantly. SBP and PP amplification did not change in either group (data not shown). In addition, total cholesterol, low-density lipoprotein cholesterol, and triglycerides decreased only in the weight loss group (all P<0.05). High-density lipoprotein cholesterol did not change (P>0.05) in either group. Glucose (P<0.05) and insulin (P=0.05) concentrations decreased in the weight loss group but not in the control group. Medication use in the 2 groups is shown in Table 2. All of the individuals had been on their current regiment for ≥8 months, and no changes were made during the weight loss intervention. None of the individuals were taking >1 medication. The frequency of medication use did not differ between the 2 groups (P>0.05).
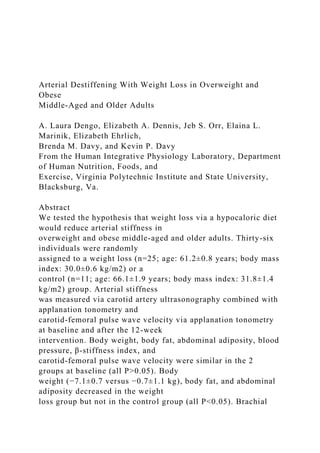
  • 13. Habitual physical activity and dietary intake at baseline and after the intervention are shown in Table 3. Habitual physical activity and dietary intake were similar (P>0.05) at baseline in the weight loss and control groups. There was no significant change in habitual physical activity after the intervention in either group. Energy intake decreased (P<0.05) after the intervention in the weight loss group but not the control group. There was no significant reduction in the percentage of fat or carbohydrate intake after the intervention. However, the percentage of protein intake increased (P<0.05) in the weight loss group but not the control group. Saturated, monounsaturated, polyunsaturated, and trans- fatty acid intake, as well as cholesterol intake, declined (all P<0.05) in the weight loss group, but there were no such significant changes observed in the control group after the intervention. Alcohol intake did not change (P<0.05) after the intervention in either group. Sodium and potassium intakes decreased (P<0.05) after the intervention in both groups; the reduction tended to be greater in the weight loss group (both P<0.05). Magnesium intake did not change (P>0.05) after the intervention in either group. β-Stiffness index, arterial compliance, and C–F PWV (and aortic PWV) at baseline and after the intervention are shown in Table 4. There were no differences in these arterial stiffness indices between the 2 groups at baseline. The reductions in β-SI (−1.24±0.22 versus 0.52±0.37 U; Figure 1A) and C–F PWV (−187±29 versus 15±42 cm/s; Figure 1C) and
  • 14. increases in arterial compliance (0.0125±0.0038 versus −0.0056±0.0061 mm2/mm Hg×10−1; Figure 1B) after the intervention were greater (all P<0.05) in the weight loss compared with the control group, respectively. In the pooled sample, the magnitude of change in β-SI was correlated with the percentage of initial weight loss (Figure 2A), change in body mass index, and change body fat percentage (Table 5). The magnitude of change in C–F PWV was correlated with the percentage of initial weight loss (Figure 2B), the magnitude of reduction in visceral fat (Figure 2C) and waist circumference (Figure 2D), and the change in the absolute amount of weight loss, body mass index, body fat percentage, total fat mass, total abdominal fat, and subcutaneous abdominal fat (Table 5). However, linear regression analysis revealed that only the changes in body mass index (model 1: β=68.4; P<0.05), total weight loss (model 2: β=21.6; P<0.05), Dengo et al. Page 4 Hypertension. Author manuscript; available in PMC 2011 April 1. N IH -P A A uthor M
  • 15. anuscript N IH -P A A uthor M anuscript N IH -P A A uthor M anuscript percentage of weight loss (model 3: β=19.4; P<0.05), and total fat loss (model 4: β=23.6; P<0.05) independently predicted the reduction in C–F PWV when indices of total and abdominal adiposity were considered for inclusion. In addition, the magnitude of reduction in C–F PWV with weight loss was correlated with the changes in triglyceride, total cholesterol, and low-density lipoprotein cholesterol concentrations (Table 5). The magnitude
  • 16. of reduction in arterial compliance was correlated with the change in fat free mass. There were no other significant correlates in the magnitudes of reduction in β-SI, arterial compliance, or C–F PWV. In an attempt to gain further insight into the potential impact of BP lowering, we compared β-SI and C–F PWV in subjects above and below the median reduction in mean BP with weight loss (n=12 per group for β-SI and n=11 per group for C– F PWV). The median reduction in mean BP for the weight loss group was −7 mm Hg. The reductions in β-SI (−1.20±0.28 versus −1.29±0.41 U) and C–F PWV (−198±43 versus −175±50 cm/s) were similar in individuals with larger (−11±1 versus −4±1 mm Hg) compared with smaller reductions in mean BP, respectively. In our mediation analysis (see the Statistical Analysis section), weight loss predicted the change in C–F PWV (β=201.68; P<0.05). However, weight loss was not a predictor of the change in mean BP (β=4.53; P>0.05). Therefore, mediation of the reduction in C–F PWV with weight loss by changes in mean BP was not supported. The relation between change in mean arterial pressure and change in C–F PWV in the weight loss and control groups is shown in Figure 3. There was no significant correlation between change in mean arterial pressure and change in C–F PWV in the pooled sample (r=0.129) or among the individual groups (r=−0.17, P>0.05 and r=0.405, P>0.05 for weight
  • 17. loss and control groups, respectively). We also compared the reduction in β-SI and C–F PWV in subjects above (n=10 for β-SI; n=11 for C–F PWV) and below (n=12 for β-SI; n=11 for C–F PWV) the median reduction in dietary sodium intake. The median reduction in dietary sodium was −733 mg/d. There were no differences in the magnitude of reduction in either β-SI (−1.01±0.32 versus −1.44±0.39 U; P>0.05) or C–F PWV (−192±51 versus −157±38 cm/s; P>0.05) in the groups. Mediation of the change in C–F PWV with weight loss by the change in sodium intake was not supported by linear regression analysis. Discussion The major finding of the present study is that intentional weight loss via hypocaloric diet alone reduces arterial stiffness in overweight and obese middle- aged and older adults. The magnitude of this improvement in arterial stiffness was related to the magnitude of reduction in total body and abdominal adiposity. However, only reductions in indices of weight loss or total fat loss independently predicted reductions in arterial stiffness. Importantly, the improvement in arterial stiffness was observed with a modest amount of weight loss, that is, the 5% to 10% weight loss believed necessary to reduce the risk of cardiovascular diseases. 19 Although previous studies have attempted to address this issue,8–12 our study is the first to demonstrate with a randomized, controlled design that
  • 18. intentional weight loss via hypocaloric diet alone (ie, without increases in physical activity) reduces large artery stiffness. Importantly, our findings extend the results of previous studies to overweight and obese middle-aged and older adults, a population with accelerated arterial stiffening and at increased risk of adverse cardiovascular events. Dengo et al. Page 5 Hypertension. Author manuscript; available in PMC 2011 April 1. N IH -P A A uthor M anuscript N IH -P A A uthor M anuscript N
  • 19. IH -P A A uthor M anuscript In the present study, only reductions in indices of weight loss or total fat loss independently predicted reduction in arterial stiffness. As such, our results suggest that weight loss, irrespective of reductions in abdominal adiposity, is associated with favorable reductions in arterial stiffness. The mechanisms responsible for the reduction in arterial stiffness with weight loss observed are not clear. However, several possibilities exist. First, it is possible that changes in the elastic material content of the arterial wall may have occurred and contributed to the reductions in arterial stiffness with weight loss. Future studies in animal models will be necessary to address this important issue. Second, collagen cross-linking that occurs in large elastic arteries as a consequence of nonenzymatic glycation of collagen is a major cause of age- related arterial stiffening. Whether short-term weight loss might also reduce arterial stiffness by reducing collagen
  • 20. cross-links is unclear. Finally, the ability to reduce arterial stiffness over a relatively short time frame, such as occurred in the present study, is thought to be the result of changes in local, humoral, or neural modulation of smooth muscle tone.20 Thus, improved nitric oxide bioavailability, reductions in angiotensin II, reductions in sympathetic neural activity, and/or other factors may contribute to the favorable changes in arterial stiffness observed with weight loss. There are some limitations of the present study that should be acknowledged. First, our sample size was small, and the age range of our subjects was restricted to 55 to 75 years. Thus, we were not able to test sex or age differences in the arterial destiffening response to our intervention. However, given the known age and sex differences in body fat distribution and potential depot specific responses to weight loss, future studies will be necessary. Second, our weight loss intervention was relatively short in duration. Thus, whether the reductions in arterial stiffness would be sustained over time is unclear. Third, we cannot exclude the possibility that the observed reductions in arterial stiffness were the result of the BP-lowering effects of weight loss and/or the reduction in sodium intake accompanying calorie restriction. However, we observed significant reductions in β- SI, a presumed BP-independent measure of arterial stiffness.14
  • 21. In addition, changes in SBP, DBP, or mean BP (or sodium intake) were not related to changes in any of our measures of arterial stiffness. Furthermore, there were no significant differences in the magnitude of reduction in either β-SI or C–F PWV in individuals above compared with below the median reduction in mean BP or sodium intake. Taken together, our findings suggest that the reduction in arterial stiffness with weight loss is, at least in part, independent of the reductions in BP and sodium intake. Finally, our study was not designed to address the hemodynamic consequences of arterial destiffening with weight loss. However, this will be an important objective for the future. We recently reported that high-dose atorvastatin (80 mg once daily) reduces arterial stiffness in overweight and obese middle-aged and older adults.16 The post-treatment levels of arterial stiffness achieved in both our previous study16 and the present study suggest that arterial stiffness remains elevated compared with healthy young individuals.15 Whether weight loss (or therapeutic lifestyle change in general) combined with statin therapy (or other drugs) can reduce arterial stiffness in an additive or synergistic manner is unclear. Future studies are needed to address this important issue, because greater reductions in arterial stiffness should translate into superior cardiovascular risk reduction. Dengo et al. Page 6
  • 22. Hypertension. Author manuscript; available in PMC 2011 April 1. N IH -P A A uthor M anuscript N IH -P A A uthor M anuscript N IH -P A A uthor M anuscript
  • 23. In summary, the findings from the present study suggest that modest weight loss by hypocaloric diet alone is efficacious in reducing arterial stiffness in overweight and obese middle-aged and older adults. The reductions in arterial stiffness appear to be determined, at least in part, by the magnitude of total and abdominal fat loss. Future studies will be necessary to determine the impact of long-term weight maintenance and the efficacy of combined arterial destiffening therapies. Perspectives Large artery stiffening is a potent risk factor for cardiovascular mortality among older adults. The findings of our present study suggest that weight loss by hypocaloric diet alone is efficacious in reducing large artery stiffness in overweight and obese middle-aged and older adults. The observed reductions in C–F PWV (ie, ≈150 to 200 cm/s) would translate into a reversal of age-related arterial stiffening by ≈15 to 20 years.1,2 These observations provide additional support for recommending weight loss to middle-aged and older adults who are overweight or obese. The reductions in arterial stiffness observed in the present study are similar in magnitude to the arterial destiffening effect that we observed previously with high-dose atorvastatin therapy in a similar population.16 Taken together, these observations suggest that a combination of these therapies could be particularly efficacious in reversing arterial aging. Future studies will be necessary to
  • 24. address this important issue. Acknowledgments We thank the participants for their time, effort, and commitment to the study. Sources of Funding This study was supported by an American Heart Association Grant-in-Aid (to K.P.D.). References 1. Avolio A, Chen S, Wang R, Zhang C, Li M, O’Rourke M. Effects of aging on change arterial compliance and left ventricular load in a northern Chinese urban community. Circulation 1983;68:50–58. [PubMed: 6851054] 2. Vaitkevicius PV, Fleg JL, Engel JH, O’Connor FC, Wright JG, Lakatta LE, Yin FC, Lakatta EG. Effects of age and aerobic capacity on arterial stiffness in healthy adults. Circulation 1993;88:1456– 1462. [PubMed: 8403292] 3. Kuk JL, Saunders TJ, Davidson LE, Ross R. Age-related changes in total and regional fat distribution. Ageing Res Rev 2009;8:339–348. [PubMed: 19576300] 4. Resnick L, Militianu D, Cunnings A, Pipe J, Evelhoch J, Soulen R. Direct magnetic resonance determination of aortic distensibility in essential hypertension: relation to age, abdominal visceral fat, and in situ intracellular free magnesium. Hypertension 1997;30:654–659. [PubMed: 9322999]
  • 25. 5. Sutton-Tyrrell K, Newman A, Simonsick EM, Havlik R, Pahor M, Lakatta E, Spurgeon H, Vaitkevicius P. Aortic stiffness is associated with visceral adiposity in older adults enrolled in the study of health, aging, and body composition. Hypertension 2001;38:429–433. [PubMed: 11566917] 6. O’Rourke M. Arterial stiffness, systolic blood pressure, and logical treatment of arterial hypertension. Hypertension 1990;15:339–347. [PubMed: 2180816] 7. Sutton-Tyrrell K, Najjar SS, Boudreau RM, Venkitachalam L, Kupelian V, Simonsick EM, Havlik R, Lakatta EG, Spurgeon H, Kritchevsky S, Pahor M, Bauer D, Newman A. Elevated aortic pulse wave velocity, a marker of arterial stiffness, predicts cardiovascular events in well-functioning older adults. Circulation 2005;111:3384–3390. [PubMed: 15967850] 8. Balkestein EJ, van Aggel-Leijssen DP, van Baak MA, Struijker-Boudier HA, Van Bortel LM. The effect of weight loss with or without exercise training on large artery compliance in healthy obese men. J Hypertens 1999;17:1831–1835. [PubMed: 10703876] Dengo et al. Page 7 Hypertension. Author manuscript; available in PMC 2011 April 1. N IH
  • 26. -P A A uthor M anuscript N IH -P A A uthor M anuscript N IH -P A A uthor M anuscript 9. Barinas-Mitchell E, Kuller LH, Sutton-Tyrrell K, Hegazi R, Harper P, Mancino J, Kelley DE. Effect of weight loss and nutritional intervention on arterial stiffness in type 2 diabetes. Diabetes Care 2006;29:2218–2222. [PubMed: 17003296]
  • 27. 10. US Department of Health and Human Services. Dietary Guidelines for Americans, 2005. 6th ed.. Washington, DC: US Department of Agriculture; 2005. 11. Miyaki A, Maeda S, Yoshizawa M, Misono M, Saito Y, Sasai H, Endo T, Nakata Y, Tanaka K, Ajisaka R. Effect of weight reduction with dietary intervention on arterial distensibility and endothelial function in obese men. Angiology 2009;60:351–357. [PubMed: 19022788] 12. Toto-Moukouo JJ, Achimastos A, Asmar RG, Hugues CJ, Safar ME. Pulse wave velocity in patients with obesity and hypertension. Am Heart J 1986;112:136–140. [PubMed: 3728268] 13. Alvarez GE, Beske SD, Ballard TP, Davy KP. Sympathetic neural activation in visceral obesity. Circulation 2002;106:2533–2536. [PubMed: 12427647] 14. Hirai T, Sasayama S, Kawasaki T, Yagi S. Stiffness of systemic arteries in patients with myocardial infarction: a noninvasive method to predict severity of coronary atherosclerosis. Circulation 1989;80:78–86. [PubMed: 2610739] 15. Orr JS, Gentile CL, Davy BM, Davy KP. Large artery stiffening with weight gain in humans: role of visceral fat accumulation. Hypertension 2008;51:1519–1524. [PubMed: 18458161] 16. Orr JS, Dengo AL, Rivero JM, Davy KP. Arterial destiffening with atorvastatin in overweight and obese middle-aged and older adults. Hypertension 2009;54:763– 768. [PubMed: 19687343]
  • 28. 17. Vermeersch SJ, Rietzschel ER, De Buyzere ML, Van Bortel LM, Gillebert TC, Verdonck PR, Laurent S, Segers P, Boutouyrie P. Distance measurements for the assessment of carotid to femoral pulse wave velocity. J Hypertens 2009;27:2377–2385. [PubMed: 19898251] 18. Baron RM, Kenny DA. The moderator-mediator variable distinction in social psychological research: conceptual, strategic, and statistical considerations. J Pers Soc Psychol 1986;51:1173– 1182. [PubMed: 3806354] 19. National Institutes of Health. Clinical guidelines on the identification, evaluation, and treatment of overweight and obesity in adults: the evidence report. 1998;6:51S–209S. 20. Zieman SJ, Melenovsky V, Kass DA. Mechanisms, pathophysiology, and therapy of arterial stiffness. Arterioscler Thromb Vasc Biol 2005;25:932–943. [PubMed: 15731494] Dengo et al. Page 8 Hypertension. Author manuscript; available in PMC 2011 April 1. N IH -P A A
  • 29. uthor M anuscript N IH -P A A uthor M anuscript N IH -P A A uthor M anuscript Figure 1. Change in β-SI after control and weight loss intervention (A). Change in arterial compliance after control and weight loss intervention (B). Change in C–F PWV after control and weight loss intervention (C). Values are mean±SE *P<0.05 vs control. Dengo et al. Page 9
  • 30. Hypertension. Author manuscript; available in PMC 2011 April 1. N IH -P A A uthor M anuscript N IH -P A A uthor M anuscript N IH -P A A uthor M anuscript
  • 31. Figure 2. Relation between changes in β-SI and percentage of weight loss in the pooled sample (A); relation between changes in C–F PWV and percentage of weight loss (B); relation between changes in C–F PWV and changes in visceral fat (C); and relation between changes in C–F PWV and changes in waist circumference (D). Dengo et al. Page 10 Hypertension. Author manuscript; available in PMC 2011 April 1. N IH -P A A uthor M anuscript N IH -P A A uthor M anuscript
  • 32. N IH -P A A uthor M anuscript Figure 3. Relation between changes in mean arterial pressure and change in C–F PWV. Dengo et al. Page 11 Hypertension. Author manuscript; available in PMC 2011 April 1. N IH -P A A uthor M anuscript N IH -P
  • 34. A uthor M anuscript N IH -P A A uthor M anuscript Dengo et al. Page 12 Table 1 Subject Characteristics Before and After the Control or Weight Loss Intervention Control (5 Women and 6 Men) Weight Loss (16 Women and 9 Men) Variable Before After Before After Age, y 66.1±1.8 61.2±0.8 Body weight, kg 91.0±4.8 90.4±4.9 84.6±2.6 77.5±2.2*†‡ Body mass index, kg/m2 31.8±1.4 31.5±1.5 30.0±0.6
  • 35. 27.5±0.6*†‡ Waist circumference, cm 109.1±3.4 109.2±3.6 101.6±1.6 95.0.±1.3*†‡ Body fat, % 39.3±3.0 39.3±2.9 40.7±1.5 37.7±1.7*‡ Total fat mass, kg 32.5±2.5 32.4±2.4 32.7±1.5 28.0±1.6*‡ Fat free mass, kg 51.0±4.0 50.9±4.0 47.7±1.9 46.3±1.9*‡ Total abdominal fat, cm2 611±58 603±51 570±28 469±27*‡ Abdominal subcut. fat, cm2 391±44 382±38 391±24 336±23*‡ Abdominal visceral fat, cm2 188±18 186±17 177±15 133±12*‡ Brachial SBP, mmHg 132±3 128±2 126±1 119±2*† Brachial DBP, mmHg 74±2 73±1 74±1 69±2*‡ Brachial MAP, mmHg 93±2 92±2 91±1 85±2*§‡ Brachial PP, mm Hg 58±2 55±3 52±1 50±2† Carotid SBP, mm Hg 120±3 117±2 115±2 111±2* Carotid PP, mm Hg 45±2 43±3 40±1 41±1 Heart rate, bpm 57±2 57±3 62±2 57±1* Triglycerides, mg/dL 97±17 108±22 110±9 95±10‡ Total cholesterol, mg/dL 192±5 193±4 207±8 190±8‡ HDL cholesterol, mg/dL 51±7 50±7 47±3 46±2
  • 36. LDL cholesterol, mg/dL 122±6 122±5 139±7 126±7 Glucose, mg/dL 87±5 90±5 89±3 85±3‡ Insulin, pmol/L 45±8 45±9 33±3 28±4§ All values are expressed as mean±SE. HDL indicates high- density lipoprotein; LDL, low-density lipoprotein; VLDL, very low-density lipoprotein; MAP, mean arterial pressure; subcut., subcutaneous. * Data show the effect of time, P<0.05. † Data show the effect of group, P<0.05. ‡ Data show the effect of time×group interaction, P<0.05. § Data show the group effect, P=0.05. Hypertension. Author manuscript; available in PMC 2011 April 1. N IH -P A A
  • 37. uthor M anuscript N IH -P A A uthor M anuscript N IH -P A A uthor M anuscript Dengo et al. Page 13 Table 2 Frequency of Medication Use Group Medication Women Men Control HRT 2 … Plavix … 1
  • 38. HCTZ 1 … Lisinopril … 1 Weight loss HRT 2 … Flomax … 1 Avodart … 1 Dyazide … 1 Lipitor … 3 Crestor 1 … Fosamax 2 … HRT indicates hormone replacement therapy. Hypertension. Author manuscript; available in PMC 2011 April 1. N IH -P A A uthor M anuscript
  • 39. N IH -P A A uthor M anuscript N IH -P A A uthor M anuscript Dengo et al. Page 14 Table 3 Physical Activity and Dietary Intake Before and After the Control or Weight Loss Intervention Control Weight Loss Variable Before After Before After PA counts/d ×103 229±32 219±24 253±28 288±21 Energy, kcal 1897±103 1770±154 1998±100 1382±73*‡
  • 40. Fat, % 37±2 38±1 36±1 32±2 Carbohydrates, % 46±3 46±2 47±2 50±3 Protein, % 16±1 16±1 16±1 18±1*‡ Alcohol, % 3.5±1.0 2.5±1.2 4.1±1.3 3.6±1.0 Cholesterol, mg 226±27 244±37 272±25 164±18*‡ SFA, g 24±2 24±3 25±2 15±1*‡ MUFA, g 30±3 29±3 30±2 19±2*‡ PUFA, g 19±2 16±2 17±1 11±1*† TFA, g 5±1 5±1 5±1 3±1* Sodium, mg 3304±276 3034±285 3203±185 2364±144* Potassium, mg 2717±151 2627±221 3104±170 2536±133* Magnesium, mg 305±26 298±35 339±19 309±18 All of the values are expressed as mean±SE. PA indicates physical activity; SFA, saturated fatty acids; MUFA, monounsaturated fatty acids; PUFA, polyunsaturated fatty acids; TFA, trans fatty acids. * Data show the effect of time, P<0.05. † Data show the effect of group, P<0.05.
  • 41. ‡ Data show the effect of time×group interaction, P<0.05. Hypertension. Author manuscript; available in PMC 2011 April 1. N IH -P A A uthor M anuscript N IH -P A A uthor M anuscript N IH -P A A
  • 42. uthor M anuscript Dengo et al. Page 15 Table 4 Indices of Arterial Stiffness Before and After the Control or Weight Loss Intervention Control Weight Loss Variable Before After Before After β-SI, U 11.73±0.89 12.25±0.82 10.68±0.58 9.44±0.52† AC, mm2/ mm Hg ×10−1 0.126±0.011 0.120±0.010 0.120±0.014 0.133±0.012† C–F PWV, cm/s 1176±76 1190±77 1155±46 968±36*† Aortic PWV, cm/s 818±54 883±62 833±35 706±25*† All values are expressed as mean±SE. Aortic PWV was estimated using the equation developed by Vermeersch et al.17 AC indicates arterial
  • 43. compliance. * Data show the effect of time, P<0.05. † Data show the effect of time×group interaction, P<0.05. Hypertension. Author manuscript; available in PMC 2011 April 1. N IH -P A A uthor M anuscript N IH -P A A uthor M anuscript N IH
  • 44. -P A A uthor M anuscript Dengo et al. Page 16 Table 5 Correlations Between Change Indices of Arterial Stiffness With the Intervention and Other Variables Variable C–F PWV β-SI Arterial Compliance Weight loss, kg 0.602* … … Weight loss, % 0.592* 0.340* … Body mass index, kg/m2 0.618* 0.296 … Waist circumference, cm 0.519* … … Body fat, % 0.386* 0.326 … Total fat mass, kg 0.482* … … Fat free mass, kg … … −0.357* Total abdominal fat, cm2 0.461* … …
  • 45. Abdominal subcutaneous fat, cm2 0.360* … … Abdominal visceral fat, cm2 0.357* … … Heart rate, bpm … … … Triglycerides, mg/dL 0.298 … … Total cholesterol, mg/dL 0.431* … … LDL cholesterol, mg/dL 0.356* … … LDL indicates low-density lipoprotein. * P<0.05. Hypertension. Author manuscript; available in PMC 2011 April 1. A v a i l a b l e o n l i n e a t w w w . s c i e n c e d i r e c t . c o m V A L U E I N H E A L T H 1 9 ( 2 0 1 6 ) 6 0 2 – 6 1 3 1098-3015$36.00 – s Published by Elsevie http://dx.doi.org/10 E-mail: ddkim62 * Address correspo
  • 46. NE Pacific Street, Bo j o u r n a l h o m e p a g e : w w w . e l s e v i e r . c o m / l o c a t e / j v a l Systematic Review Estimating the Medical Care Costs of Obesity in the United States: Systematic Review, Meta-Analysis, and Empirical Analysis David D. Kim, MS1,*, Anirban Basu, PhD1,2 1Department of Health Services, University of Washington, Seattle, WA, USA; 2The National Bureau of Economic Research, Cambridge, MA, USA A B S T R A C T Background: The prevalence of adult obesity exceeds 30% in the United States, posing a significant public health concern as well as a substantial financial burden. Although the impact of obesity on medical spending is undeniably significant, the estimated magnitude of the cost of obesity has varied considerably, perhaps driven by different study method- ologies. Objectives: To document variations in study design and meth- odology in existing literature and to understand the impact of those variations on the estimated costs of obesity. Methods: We conducted a systematic review of the twelve recently published articles that reported costs of obesity and performed a meta-analysis to generate a pooled estimate across those studies. Also, we performed an original analysis
  • 47. to understand the impact of different age groups, statistical models, and confounder adjustment on the magnitude of estimated costs using the nationally representative Medical Expenditure Panel Surveys from 2008- 2010. Results: We found significant variations among cost estimates in ee front matter Copyright & 2016, International S r Inc. .1016/j.jval.2016.02.008 @uw.edu. ndence to: David D. Kim, MS, Department of Health x 357660, Seattle, WA 98195. the existing literature. The meta-analysis found that the annual medical spending attributable to an obese individual was $1901 ($1239-$2582) in 2014 USD, accounting for $149.4 billion at the national level. The two most significant drivers of variability in the cost estimates were age groups and adjustment for obesity- related comorbid conditions. Conclusions: It would be important to acknowledge variations in the magnitude of the medical cost of obesity driven by different study design and methodology. Research- ers and policy-makers need to be cautious on determining appropriate cost estimates according to their scientific and political questions. Keywords: economic burden, medical care costs, obesity, United States.
  • 48. Copyright & 2016, International Society for Pharmacoeconomics and Outcomes Research (ISPOR). Published by Elsevier Inc. Introduction The prevalence of obesity, which is defined as a body mass index (BMI) of greater than 30, has increased dramatically in the United States since the late 1990s [1]. So much so that recently obesity has been officially recognized as a disease by the American Medical Association, an action that could put more emphasis on the health condition by doctors and insurance companies so as to minimize its adverse effects. Currently, rates of obesity exceed 30% in most sex and adult age groups, whereas its prevalence among children and adolescents, defined as a BMI of more than 95th percentile, has reached 17% [2]. The alarming rates of the high prevalence of obesity have posed a significant public health concern as well as a substantial financial burden on our society because obesity is known to be a risk factor for many chronic diseases, such as type 2 diabetes, cancer, hypertension, asthma, myocardial infarction, stroke, and other conditions�[3,4]. To understand the economic burden of obesity, several studies have attempted to estimate the attribut- able costs of obesity, following the burden-of-illness literature on other disease areas [5–9]. A previous cost-of-illness study esti- mated that health care spending attributable to the rising prevalence of obesity has increased by 27% between 1987 and 2001 [10]. In gross terms, the annual medical costs of obesity were estimated to be $40 billion in 2006 [11]. The latest study using an instrumental variable (IV) approach even showed that the esti-
  • 49. mated medical costs related to obesity could reach $209.7 billion, which is twice higher than the previous estimate, $86 billion [12]. As evidenced by the aforementioned estimates, although the impact of obesity on the medical care spending is undeniably significant, the estimated magnitude of the medical care costs attributable to obesity has varied considerably, perhaps driven by different study methodologies, including data, statistical models, confounder adjustment, and target populations. In this article, ociety for Pharmacoeconomics and Outcomes Research (ISPOR). Services, School of Public Health, University of Washington, 1959 http://dx.doi.org/10.1016/j.jval.2016.02.008 http://dx.doi.org/10.1016/j.jval.2016.02.008 http://dx.doi.org/10.1016/j.jval.2016.02.008 http://crossmark.crossref.org/dialog/?doi=10.1016/j.jval.2016.0 2.008&domain=pdf http://crossmark.crossref.org/dialog/?doi=10.1016/j.jval.2016.0 2.008&domain=pdf http://crossmark.crossref.org/dialog/?doi=10.1016/j.jval.2016.0 2.008&domain=pdf mailto:[email protected] http://dx.doi.org/10.1016/j.jval.2016.02.008 V A L U E I N H E A L T H 1 9 ( 2 0 1 6 ) 6 0 2 – 6 1 3 603 we approach these issues systematically with two goals: 1) to conduct a systematic review and meta-analysis of recently published articles that estimated the medical costs associated
  • 50. with obesity between 2008 and 2012 and to document the variations in study methodologies and 2) to demonstrate the importance of study methodologies by performing an original analysis to examine the impact of age group, confounder adjust- ment, and statistical methods on the cost estimates of obesity through the empirical analysis of a nationally representative US population. Especially, we also examined the impact of obesity- related diseases (ORDs) on the medical costs of obesity to show that most, if not all, of those costs are attributable to ORDs. We believe that it would be important to recognize significant variations among estimates of obesity-attributable costs in the existing literature and to understand the impact of study meth- odology on the magnitude of these estimates so that researchers and policymakers are able to determine the appropriate estimate and methods according to their scientific and political questions. Methods A Systematic Review and Meta-Analysis Literature search We searched the MEDLINE and Cochran database to identify articles related to medical costs of obesity using keywords “obesity AND (cost OR expenditure) AND healthcare)) AND “united states.” To account for the unique health care system and the impact of costs attributable to obesity in the United States, we limited the search to studies conducted in the US settings. We initially identified 567 articles from the search, then narrowed down to 16 articles for in-depth reviews. Following the extensive reviews, we excluded three studies that did not provide explicit methods and/or aggregate annual costs per person, in addition to a previously conducted systematic review [13–16].
  • 51. Finally, we included 12 studies in this study for the systematic review [17–26]. Appendix Figure A in Supplemental Materials found at http://dx.dor.org/10.1016/j.jval.2016.02.008 provides details on search strategies for identifying studies included in this review. Improve comparability across studies To improve comparability across heterogeneous studies, we performed appropriate adjustments to convert estimates from each study into annual per-person costs among all obese pop- ulation (BMI Z 30). First, we converted cost estimates to 2014 USD to adjust for the inflation over time using annual average consumer price index for medical care [27]. One study reported the quarter-per- person medical costs, and we annualized the cost estimate [17]. All the 12 studies reported direct medical costs, including the out- of-pocket costs for inpatient, noninpatient (outpatient, emer- gency room, and other), and prescription drug spending. Then, we aggregated all BMI-specific estimates into a single composite estimate of costs attributable to all obese individuals. Among the 12 studies, 8 studies defined obesity as a BMI of greater than 30 whereas 4 studies implemented more comprehensive obesity categories, defined as class I obesity (30 o BMI r 35), class II obesity (35 o BMI r 40), and class III obesity (40 o BMI) [21,22,24,26]. Two of the four studies combined class II and class III obesity into a single category because of the sample size issue [22,26]. To generate comparable cost estimates, we calculated a weighted average among subgroup-specific estimates on the basis of the number of each subgroup reported in each of the four
  • 52. studies. In addition, three studies estimated sex-specific costs of obesity [18,20,23], and one study provided race (non-Hispanic whites vs. blacks) stratified results [26]. Another study reported both sex and race (non-Hispanic whites vs. blacks) stratified estimates [19]. Based on the sample size of each stratum presented in each study, only the weighted average estimates for aggregating sex and race categories are presented in Table 2. Evaluating quality of studies We evaluated the quality of studies on the basis of four criteria: the use of nationally representative samples, longitudinal data sets, analysis of adults of all ages, and appropriate confounding factor adjustments. A previous systematic review also used a similar set of criteria for evaluating cost-of-illness studies of obesity [13]. Meta-analysis To generate a pooled estimate of medical costs of obesity across different studies, we conducted a meta-analysis using the metaan command in STATA 12 (StataCorp., College Station, TX) [28]. The metaan command is used to conduct random-effect meta-anal- ysis for one-variable relationship. Because the meta-analysis for one-variable relationship requires both the effect size estimate and the standard error, we were able to include only eight estimates of annual incremental costs of obesity from seven studies (Table 2). Because of the presence of extremely high heterogeneity between studies (I2 ¼ 96.61%; τ2 ¼ 5.6 � 105), the random-effect model is used in the final analysis.
  • 53. Empirical Analysis: The Role of Alternative Statistical Models in Estimating Costs of Obesity Study data The medical costs of obesity were estimated using regression analysis and the 2008-2010 Medical Expenditure Panel Surveys (MEPS). The MEPS is a nationally representative survey of the civilian noninstitutionalized population, collecting detailed information on health care expenditures and utilization, health insurance, health status, and sociodemographic factors. Nationally representative estimates were obtained by using MEPS sampling weights. Variables As a dependent variable, medical care costs (which include costs for office-based visits, hospital outpatient visits, emergency room visits, inpatient hospital stays, prescription drugs, dental visits, and home care) are defined as the sum of direct payments from all parties (out-of-pocket, private insurers, government, and other payers) for care provided during the year. For a primary inde- pendent variable, we identified obesity status on the basis of the constructed BMI through self-reported height and measure [29]. (Please note that because of confidentiality concerns and restric- tions, the self-reported weight and height variables were not available from the public-access MEPS data sets.) Also, we categorized potential confounding factors into four categories to examine the impact of confounder adjustments on the magni- tude of the cost estimates: 1) Demographic factors or cov1 (age, sex, and race/ethnicity), 2) Socioeconomic factors or cov2 (edu- cation, household income based on the federal poverty line, smoking status, and marital status), 3) Additional factors or cov3 (census region and insurance status), and 4) comorbidity
  • 54. conditions or cov4. Comorbidity conditions are defined as a con- tinuous variable ranging from 0 to 10 by summing up 10 potential health consequences that can be caused be obesity. These conditions, called ORDs, which are defined by the Centers for Disease Control and Prevention, include hypertension, heart diseases (coronary heart disease, angina, myocardial infarction, others), stroke, cancer, diabetes, arthritis, and high cholesterol [30]. In this data set, children or adolescents (age o 18 years) do not have any information on comorbidity conditions and http://dx.dor.org/10.1016/j.jval.2016.02.008 Table 1 – Characteristics of 12 studies included in this review. Study Data Sample size Statistical methods* Obesity class Target population Variable adjusted for Quality evaluation (score out of 4) Medical care cost of obesity—Annual cost per person (common confounders†) Wolf et al. [17], 2008
  • 55. US PROCEED 1,300 Log-linear Aggregate Adults (aged 35–75 y) (� race/ethnicity, income, marital status) (þ alcohol use, comorbidities, insurance) 2: Longitudinal data, confounder adjustment Finkelstein et al. [11], 2009 MEPS (2006) 21,877 Two-part (logit-GLM) Aggregate All adults (age Z 18 y) (þ census region, insurance status) 3: Nationally representative sample, all adults, confounder adjustment Cai et al. [20], 2010 MCBS (1991– 2000) 5,043 Unadjusted Aggregate Adults aged 35– 55 y in the period 1971– 1975 Unadjusted 1: Nationally representative
  • 56. sample Finkelstein et al. [21], 2010 MEPS (2006) 8,875 Two-part (logit-GLM) Obesity class I, II, and III All adults (age Z 18 y) Full- time employees only (þ age2, census region, insurance status) 3: Nationally representative sample, all adults, confounder adjustment Bell et al. [23], 2011 MEPS (2000– 2005) 80,516 Two-part (logit-log (Y) OLS) Aggregate Children and
  • 57. adults aged 6–85 y (� smoking, marital status) (þ age2, age3, region, insurance status, survey year) 3: Nationally representative sample, all adults, confounder adjustment Onwudiwe et al. [22], 2011 MCBS (2002) 7,706 One-part GLM Obesity class I and II/ III Medicare beneficiaries (age Z 65 y) Not in HMO plan (þ insurance status) 2: Nationally representative sample, confounder adjustment Alley et al. [25], 2012 MCBS (1997–
  • 58. 2006) 29,413 One-part GLM Aggregate Medicare beneficiaries (age Z 65 y) (þ census region, metropolitan status, mortality variable) 3: Nationally representative sample, all adults, confounder adjustment Cawley and Meyerhoefer [12], 2012 MEPS (2000– 2005) 23,689 IV with two- part (logit- GLM) IV: a weight of biological relative Aggregate Adults (aged 20–64 y with biological children aged 11–20 y)
  • 59. (� income, smoking, marital status) (þ census region, MSA, household composition, survey information, employment status, fixed effects for year, the sex and age of the oldest children) 3: Nationally representative sample, confounder adjustment (IV) Ma et al. [26], 2012 MEPS (2006) 15,164 Unadjusted Obesity class I and II/ III All adults (age Z 18 y) Unadjusted 2: Nationally representative sample, all adults Moriarty et al. [24], 2012 Mayo Clinic Database (2001– 2007) 30,529 GEE Obesity class I, II, and III
  • 60. Adults (18–65 y) vs. adults (465 y) (� education, income) (þ comorbidity conditions for an additional analysis) 3: Longitudinal data, all adults, confounder adjustment V A L U E I N H E A L T H 1 9 ( 2 0 1 6 )
  • 90. o k in g st a tu s, a n d m a ri ta l st a tu s. V A L U E I N H E A L T H 1 9 ( 2 0 1 6 ) 6 0 2 – 6 1 3 605 smoking status, and only very few individuals reported education (N ¼ 25) and marital status (N ¼ 6). Study design and data analysis To study the impact of various study designs, we examined three different aspects of estimating medical costs in a regression analysis: age groups, statistical models, and confounder adjust- ments. The age groups were 1) children/adolescents (aged 0–17 years), 2) all adults (aged Z 18 years), 3) adults aged 18 to 65 years, and 4) older adults (aged Z65 years). Considering the
  • 91. nature of cost data, such as non-negative observations, a large number of observations at zero, and positive skewness, we examined five different statistical models that have been widely used to estimate the medical costs: 1) linear regression, 2) log- linear model (a simple ordinary least square for ln(y)), 3) one- part log-gamma generalized linear model (GLM), 4) two-part model with a logistic regression and a log-gamma GLM, and 5) extended estimating equation (EEE) that used both a flexible link and a flexible variance function estimated directly from the data to capture the underlying nonlinearity in the data so that it can produce efficient estimates [31–34]. Also, we tested the goodness of fit (GoF) of each statistical model to examine how well the model fits a data set using Pearson correlation, Pregobon’s link test, and Hosmer-Lemeshow test. In regard to confounder adjust- ment, four sets of confounders were studied: 1) Demographic factors (cov1), 2) Demographic þ Socioeconomic factors (cov1 þ cov2), 3) Demographic þ Socioeconomic þ Additional factors (cov1 þ cov2 þ cov3), and 4) All three factors þ ORDs (cov1 þ cov2 þ cov3 þ cov4). Using different combinations of the target population, statistical models, and confounder adjustment, we estimated medical care costs of nonobese individuals (so called costs of normal) as well as incremental costs of obesity through recycled predictions to estimate the counterfactual mean costs if all individuals in the data set were suddenly to have obesity while retained all other characteristics as compared with being nonobese for all individuals. We also tested the GoF of five different statistical models with each of four different sets of confounding factors for the sample population of all adults. All standard errors and confidence intervals (CIs) were estimated from 1000 bootstrap replicates. Results
  • 92. A Systematic Review and Meta-Analysis Descriptive results Among the 12 studies included in this systematic review, 9 studies reported annual medical care costs per person while 2 studies provided lifetime medical care costs per person and 1 study reported both estimates. Six studies used the MEPS data- base, whereas four studies used the Medicare Current Beneficiary Survey database. The remaining two studies used the Prospective Obesity Cohort of Economic Evaluation and Determinants data set, which is a multinational, observational, prospective Internet- based cohort study and the Mayo clinic employment database, respectively (Table 1). Quality evaluation Based on four quality criteria, no studies met all criteria, because all the studies that used a nationally representative data set were not a longitudinal study or vice versa. Among 10 studies that reported annual costs per person, 5 studies were designated as “high-quality (score ¼ 3)” study (Table 1). Because Cawley’s study was the only study that estimated medical costs of obesity using the instrumental variable IV approach to account for unobserved Table 2 – Systematic review—Medical costs of obesity (2014 USD). Study Cost of normal*
  • 93. Cost of obesity* Incremental cost of obesity* Year of cost reporting Note Medical care cost of obesity—Annual cost per person Wolf et al. [17], 2008 $2,541 $6,611 $4,070† 2004 Finkelstein et al. [11], 2009 $4,087 $5,783 $1,696† 2008 Cai et al. [20], 2010 $5,750 $13,019 $7,269 2000 Unadjusted Finkelstein et al. [21], 2010 NA NA $1,024 2006 Obese I, medical costs only $1,944 Obese II, medical costs only $2,215 Obese III, medical costs only $1,397† Aggregate, medical costs only Bell et al. [23], 2011 $3,629 $5,488 $1,859† 2005 Onwudiwe et al. [22], 2011 $5,666 $5,578 �$88 2002 Obese I, uncorrected for the height loss
  • 94. $6,637 $971 Obese II/III, uncorrected for the height loss $5,892 $227† Aggregate obese, uncorrected for the height loss Alley et al. [25], 2012 $8,781 $7,338 �$1,443 2006 Annual spending in 1997 converted to 2008 USD $157 $191 $34 Expenditures increased per year from 1997 to 2006 Cawley and Meyerhoefer [12], 2012 NA NA $877† 2005 Without using the instrumental variable $3,665† With using the instrumental variable Ma et al. [26], 2012 $4,797 $6,152 $1,356 2006 Obese I, unadjusted $8,408 $3,611 Obese II/III, unadjusted $7,082 $2,285 Aggregate, unadjusted Moriarty et al. [24], 2012 NA NA $2,278 2007 Obese I, no comorbidity adjustment $3,759 Obese II, no comorbidity adjustment $6,794 Obese III, no comorbidity adjustment $3,302† Aggregate obese, no comorbidity adjustment Medical care cost of obesity—Lifetime costs per person (all adjusted for survival)
  • 95. Finkelstein et al. [19], 2008 NA NA $19,892 2007 From age 20 y, obese I—Discounted lifetime costs $28,441 From age 20 y, obese II/III—Discounted lifetime costs $23,123 From age 20 y, aggregate—Discounted lifetime costs $15,641 From age 65 y, obese I—Discounted lifetime costs $24,589 From age 65 y, obese II/III—Discounted lifetime costs $19,022 From age 65 y, aggregate—Discounted lifetime costs Yang and Hall [18], 2008 $288,934 $332,838 $43,904 2001 From age 65 y—Not discounted Cai et al. [20], 2010 $194,013 $269,628 $75,615 2000 From age 45 y—Not discounted NA, not applicable/available. * All costs were converted to 2014 US dollar using Consumer Price Index—Medical Care. † Represents the cost estimates included in the meta-analysis to calculate the pooled incremental cost of obesity. V A L U E I N H E A L T H 1 9 ( 2 0 1 6 ) 6 0 2 – 6 1 3606 confounding factors, the study received an extra score for con- founder adjustment criteria [12]. Cost estimates
  • 96. The annual incremental costs of obesity per person ranged from $227 to $7269 depending on the study designs and research methods. Tables 2 and 3 provide details on different study methodologies and reported cost estimates. From the meta- analysis with the random-effect model, the pooled estimate of annual medical costs of obesity was $1910 (95% CI $1239– $2582). A forest plot from the random-effect model is shown in Figure 1. Three studies reported the lifetime costs associated with obesity after adjusting for survival. One study estimated the lifetime costs of obesity with a 3% annual discount on the dollar value, resulting in $23,123 from age 20 years and $19,022 from age 65 years [19], whereas another study without using a discount rate reported the lifetime costs of $43,904 from age 65 years [18]. Table 3 – Systematic review—Medical costs of obesity by study methodologies (2014 USD). Confounding factors Unadjusted Demographic factors Demographic þ socioeconomic factors Demographic þ SES þ additional factors All factors þ comorbidities
  • 97. Statistical methods Age groups Linear regression Children/adolescents All adults (age Z 18 y) $2,285 (Ma et al. [26], 2012) Adults (18–65 y) $7,269 (Cai et al. [20], 2010) Older adults (age Z 65 y) Log-linear Children/adolescents All adults (age Z 18 y) Adults (18–65 y) $4,070 (Wolf, 2008) Older adults (age Z 65 y) One-part GLM Children/adolescents All adults (age Z 18 y) Adults (18–65 y) Older adults (age Z 65 y) $227 (Onwudiwe, 2011) �$1,443 (Alley, 2012) Two-part GLM Children/adolescents All adults (age Z 18 y) $1,696 (Finkelstein, 2009) $1,359 (Finkelsten, 2010) $1,859 (Bell, 2011) Adults (18–65 y) $877 (Cawley, 2012) Older adults (age Z 65 y) Other methods Children/adolescents All adults (age Z 18 y) $3,302 (Moriarty, 2012)—
  • 98. GEE Adults (18–65 y) $3,665 (Cawley, 2012)—IV Older adults (age Z 65 y) V A L U E I N H E A L T H 1 9 ( 2 0 1 6 ) 6 0 2 – 6 1 3
  • 99. 6 0 7 Fig. 1 – Meta-analysis: Medical costs of obesity (random-effect model). CI, confidence interval; IV, instrumental variable. V A L U E I N H E A L T H 1 9 ( 2 0 1 6 ) 6 0 2 – 6 1 3608 Stratified results Among the studies that provided stratified estimates of the medical costs attributable to obesity, the annual costs increased in higher obese categories [21,22,24,26] and the lifetime costs of obesity were also positively associated with an increasing BMI [19]. The magnitude of the annual costs related to obesity was higher among women than among men [18–20,23]. Also, obese blacks were found to spend less medical costs than obese whites, mainly due to more use of relatively inexpensive types of care (office-based visits, outpatient care, medications) rather than more costly ones (inpatient, emergency room) [19,26]. Different study methodology Among the 10 studies that estimated annual medical care cost attributable to obesity, a two-part model was the most popular method used by four studies. Three of those four studies imple- mented a logistic regression with a log-gamma GLM [11,12,21], whereas another study used a logit model with a log-linear model [23]. Two studies used a one-part GLM method with a log link and a gamma distribution [22,25]. A generalized estimating equation [24]
  • 100. and a log-linear regression model [17] were used in other two studies, respectively, and the remaining two studies reported unadjusted annual costs of obesity [20,26]. Because each study used distinctive data sets to various study methodologies, it is hard to predict the actual impact of a range of study methodologies on the magnitude of the costs of obesity. However, one study using both a two-part model and an IV approach provided that the effect of obesity on medical care costs was much greater with the IV method than was previously appreciated with the two-part model. The instrument used in the study was the weight of a biological relative [12]. Different confounder adjustment We defined confounding factors that were widely used to adjust for the causal inference among these studies, including demo- graphic factors, socioeconomic factors, additional factors, and obesity-related comorbidity conditions. However, none of these studies selected the same set of confounding factors. Table 1 presents a significant variability in choosing confounding factors, and the substantial variability poses an essential problem of comparing these estimates directly. A study that examined two models with and without adjusting for comorbidity conditions as a confounding factor found that incremental costs of obesity dropped significantly when adjusted for comorbidities [24]. Estimating Medical Costs of Obesity With possible combinations of the four age groups, the five statistical
  • 101. models, and the four sets of potential confounders, 80 estimates of costs of normal and incremental costs of obesity were generated with 95% CIs. All possible cost estimates are provided in Table 4. Characteristics of individuals in the data set Individual characteristics used in estimating medical costs of obesity are presented in Appendix Table A in Supplemental Materials found at http://dx.dor.org/10.1016/j.jval.2016.02.008. In this analysis, the data set includes 15,176 children and adoles- cents and 69,382 adults aged 18 years and older, including 10,382 older adults (age Z 65 years) with existing obesity status. Among the obese, there was a significantly higher proportion of females, blacks, Hispanics, individuals in lower household income level (o125% federal poverty line), only high school or equivalent degree holder, those who were married, individuals with public insurance, and those living in the South region, compared with the nonobese. Also, as expected, individuals with obesity have a higher number of obesity-related comorbidity conditions than do those without obesity. Effect of different target populations For children/adolescents, regardless of different statistical mod- els and confounding factor adjustment, there was no significant difference between costs of the nonobese and the obese, except only one scenario with a one-part GLM controlling for all con- founding factors available (no comorbidities and smoking) that reported $1085 ($92–$2377) for the incremental costs of obesity for children/adolescents. However, for the adult population, the
  • 102. http://dx.dor.org/10.1016/j.jval.2016.02.008 Table 4 – Factors affecting costs of normal (nonobese) and incremental costs of obesity. Confounding factors Unadjusted Demographic factors1 Demographic þ socioeconomic factors2 Demographic þ SES þ additional factors3 All factors þ comorbidities4 Statistical methods Age groups Cost of normal Incremental cost of obesity 95% CI Cost of normal Incremental cost of obesity 95% CI Cost of normal Incremental cost of obesity
  • 103. 95% CI Cost of normal Incremental cost of obesity 95% CI Cost of normal Incremental cost of obesity 95% CI Linear regression Children/ adolescents 1,851 �62 (�455 to 333) 1,265 182 (�198 to 563) 1,591 621 (�285 to 1528) 1,580 647 (�269 to 1563)
  • 104. NA NA NA All adults (age Z 18 y) 4,574 1,766 (1477 to 2056) 4,252 1,411 (1096 to 1689) 4,436 1,453 (1139 to 1738) 4,443 1,406 (1101 to 1700) 4,792 153 (�156 to 456) Adults (18–65 y) 3,524 1,795 (1502 to 2088)
  • 105. 3,345 1,283 (995 to 1570) 3,494 1,312 (1006 to 1617) 3,559 1,153 (851 to 1456) 3,855 93 (�211 to 397) Older adults (age Z 65 y) 9,558 2,290 (1385 to 3195) 9,247 2,898 (1975 to 3820) 9,380 2,747 (1794 to 3701) 9,362 2,717 (1762 to
  • 106. 3673) 9,954 496 (�421 to 1413) Log-linear Children/ adolescents 1,975 90 (�413 to 826) 1,640 366 (�178 to 1186) 2,145 1,112 (�67 to 2533) 2,074 1,191 (�36 to 2652) NA NA NA All adults (age Z 18 y) 5,186 1,562 (1318 to 1823) 5,394 1,375 (1089 to
  • 107. 1705) 5,546 1,412 (1101 to 1753) 5,452 1,261 (950 to 1561) 6,236 61 (�250 to 358) Adults (18–65 y) 4,175 1,614 (1372 to 1858) 4,298 1,015 (759 to 1294) 4,407 1,031 (764 to 1312) 4,321 819 (544 to 1086) 4,935 �78 (�347 to 197) Older adults (age Z 65 y)
  • 108. 9,468 2,283 (1522 to 3012) 9,439 3,528 (2556 to 4456) 9,602 3,431 (2461 to 4371) 9,654 3,378 (2425 to 4354) 10,849 425 (�435 to 1273) One-part GLM Children/ adolescents 1,851 �62 (�396 to 349) 1,376 140 (�140 to 532)
  • 109. 1,571 715 (�240 to 1567) 1,556 1,085 (92 to 2377) NA NA NA All adults (age Z 18 y) 4,574 1,766 (1462 to 2056) 4,279 1,450 (1139 to1720) 4,446 1,506 (1210 to 1822) 4,511 1,397 (1091 to 1665) 5,048 429 (103 to 728) Adults (18–65 y)
  • 110. 3,524 1,795 (1509 to 2089) 3,383 1,088 (843 to 1336) 3,517 1,143 (890 to 1407) 3,580 970 (702 to 1216) 4,115 258 (�14 to 535) Older adults (age Z 65 y) 9,558 2,290 (1415 to 3193) 9,235 3,124 (2090 to 4046) 9,358 2,992 (1918 to 3977)
  • 111. 9,342 2,944 (1858 to 3859) 9,981 600 (�272 to 1496) Two-part GLM Children/ adolescents 2,162 �62 (�359 to 455) 1,953 140 (�146 to 653) 2,063 475 (�175 to 1289) 2,066 750 (�2 to 1894) NA NA NA All adults (age Z 18 y) 5,483 1,834 (1553 to
  • 112. 2170) 5,358 1,524 (1247 to 1803) 5,498 1,578 (1284 to 1848) 5,535 1,481 (1186 to 1754) 5,949 399 (112 to 665) Adults (18–65 y) 4,369 1,880 (1581 to 2206) 4,391 1,190 (938 to 1428) 4,528 1,234 (957 to 1467) 4,579 1,070 (813 to
  • 113. 1313) 4,974 269 (8 to 506) Older adults (age Z 65 y) 9,894 2,328 (1481 to 3280) 9,628 3,191 (2264 to 4187) 9,749 3,060 (2040 to 4017) 9,740 3,014 (1991 to 3993) 10,315 555 (�320 to 1451) continued on next page V A
  • 140. o f 1 0 o b e si ty -r e la te d d is e a se s (0 – 1 0 ) V A L U E I N H E A L T H 1 9 ( 2 0 1 6 ) 6 0 2 – 6 1 3610 incremental costs of obesity were significantly higher than for the nonobese. Among adults, in most of the combinations with statistical models and confounding factors, the incremental costs of obesity for older adults (age Z 65 years) were significantly higher than those for adults aged 18 to 65 years (Fig. 2 and
  • 141. Table 4). From the EEE model controlling for demographic, socioeconomic, and additional factors (cov1 þ cov2 þ cov3), the incremental costs of obesity for adults aged 18 to 65 years were reported as $1094 ($859–$1359) while the costs of obesity for older adults were $2668 ($978–$4418). Effect of different statistical models Medical care costs attributable to obesity did not differ signifi- cantly by using different statistical models, although the GoF tests showed that an EEE model fitted the data most thoroughly, followed by a one-part GLM. For all adults, controlling for demographic and socioeconomic and additional factors (cov1 þ cov2 þ cov3), the EEE model reported $1343 ($1076–$1621) for the incremental costs of obesity, whereas the estimates ranged from $1261 ($950–$1561) in the log-linear model to $1481 ($1186– $1754) in the two-part GLM (Fig. 2; Table 4). Also, compared with other models, the EEE model provided the most stable estimates over the different sets of confounding factor adjustment, varying only from $1346 with cov1 to $1356 with cov1 þ cov2 to $1343 with cov1 þ cov2 þ cov3. Confounding factor adjustment For children, regardless of statistical models, the point estimates of the incremental costs of obesity were increased as we adjusted with more sets of possible confounding factors (up to cov1 þ cov2
  • 142. þ cov3), despite a huge CI that made those estimates statistically insignificant. For adults, controlling for demographic, socioeco- nomic, and additional confounding factors (cov1 þ cov2 þ cov3) did not make any substantial impact on point estimates as well as statistical significance. However, by controlling for ORDs (cov4) that were available only for adults in this data set, the incre- mental costs of obesity reduced to one-fourth to one-seventh of the original estimates. Among all adults, the EEE model esti- mated the costs attributable to obesity as $1343 ($1076–$1621) controlling for all confounding factors except the comorbidity conditions, whereas after adding obesity-related comorbidities in the model the estimates were decreased to $209 (�$21 to $434), which was statistically insignificant, compared with the costs of the nonobese (Fig. 2; Table 4). Discussion This article provided a systematic review and meta-analysis of the 12 recently published articles that reported the medical care costs associated with obesity, and also performed an original analysis to understand the impact of study methodology on the magnitude of these estimates. From the meta-analysis, the pooled estimate of annual medical costs attributable to obesity was $1901 ($1239–$2582) in 2014 USD, accounting for $149.4 billion at the national level. The extremely high heterogeneity score from the meta-analysis signified the presence of hetero- geneity between different studies due to the use of different data sets from multiple time periods, various statistical methods, and adjustment for a wide range of confounding factors to estimate the costs. Compared with the findings from the previously conducted systematic review that reported the incremental costs of obesity as $2046 (2014 USD) [13], the estimate from this analysis is very comparable.
  • 143. From the empirical analysis, not surprisingly, different stat- istical methods did not have a significant impact on the Note: EEE, extended estimating equation; SES, socio-economic status; GLM, generalized linear model; ORDs, obesity-related diseases Fig. 2 – Impact of age groups, statistical models, and confounding factor adjustment on the estimates of costs attributable to obesity. EEE, extended estimating equation; GLM, generalized linear model; ORDs, obesity-related diseases; SES, socioeconomic status. V A L U E I N H E A L T H 1 9 ( 2 0 1 6 ) 6 0 2 – 6 1 3 611 V A L U E I N H E A L T H 1 9 ( 2 0 1 6 ) 6 0 2 – 6 1 3612 variability of the estimates in this analysis. However, we caution that this analysis does not endorse that any statistical model can be used in estimating highly skewed cost data. Ignoring the nature of cost data and misspecification of statistical models may lead to inefficient or sometimes biased estimates [32,33]. For all adults, controlling for the demographic and socioeconomic and additional factors (cov1 þ cov2 þ cov3), the EEE model, which had the best GoF among all models based on the GoF tests, reported $1343 ($1076–$1621) for the incremental costs of obesity. This result provides that the estimate of the national medical
  • 144. care costs attributable to obesity would be $94.3 billion ($75.6– $113.2 billion), which accounts for 3.8% (2.8%–4.3%) of national health expenditures in 2010 [35]. This estimate of medical costs attributable to obesity from the empirical analysis was lower than the pooled estimate from the meta-analysis. The reporting error in the BMI measure through self-reported height and weight is likely to bias the coefficient estimates, although the direction of bias is not clear. Also, the possibility of omitting unobserved confounders or reverse causality of obesity on medical costs is likely to underestimate the true costs attributable to obesity. The IV approach by Cawley et al. could address these problems using a weight of biological relative as an instrument. The estimate from the IV approach, however, may not be generalizable to the entire population because of the restriction of the study popula- tion to only adults aged 20 to 64 years with biological children aged 11 to 20 years. The two most significant drivers of variability in the cost estimates were age groups and adjustment for obesity-related comorbid condition. First, as expected, there is no significant difference in costs attributable to obesity in children/adolescence population because of the presence of very few ORDs that may take a long time to develop among children. In contrast, the incremental costs of obesity were significantly higher than those for the nonobese for the adult population, and the older pop- ulation reported significantly higher costs associated with obesity than did adults aged 18 to 65 years. However, because we included obesity-related comorbidity as a confounding factor in
  • 145. the model, the medical costs of obesity were not significantly higher that the costs among the nonobese. These findings confirmed that most, if not all, of the costs attributable to obesity are mainly caused by ORDs, and as age increases, the obese population is more likely to develop ORDs, incurring higher costs of obesity for the older population. The main limitation of estimating costs attributable to obesity is the lack of distinction between costs of obesity caused by ORDs and costs of obesity care itself. If the ORDs are caused by the obesity, then by controlling for them, it estimates only the “partial” effect of obesity alone on the cost. However, by omitting such comorbidities as covariates, it estimates the “total effect” of obesity directly on cost and indirectly through mediators, the ORDs. Although the “partial” effect of obesity alone on medical costs was represented by the estimates controlling for ORDs (cov4) in my analysis, which were not significantly different from costs of the nonobese, the true “total effect” of obesity on costs is not easy to estimate, because the regression model could not capture the true counterfactual costs of obesity by just omitting comorbidities as covariates, ignoring the presence of ORDs in the nonobese population. Future study needs to be directed at estimating true counterfactual costs related to the absence/ presence of obesity and ORDs. After recognizing obesity as a disease, a national survey found that survey participants are more likely to support the disease classification of obesity, and they believe that this change
  • 146. would bring more attention to weight changes and more access to obesity treatment [36]. However, a recent evaluation of adherence to national obesity clinical practice guidelines found the lack of increase in documentation of diagnosis and planned management of obesity patients [37]. Thus, recognizing obesity as a disease may not lead to immediate changes in health care utilization or significant policy changes. However, what we can do is produce better evidence of effectiveness and cost-effectiveness of obesity treatment through future research. Then, better research alone will increase obesity treatment and reduce the burden of illness, and we hope the overall medical expenditure will be expected to decrease in the long run as we make more diligent efforts to fight against the obesity epidemic. (We appreciate valuable insights from an anonymous reviewer and David Arterburn.) However, the utility of published estimates for the medical costs of obesity should be examined carefully, because of their wide variation, and the estimates should be applied cautiously in future research and health policy making. Source of financial support: This work was supported by the Agency for Healthcare Research and Quality predoctoral training fellowship (grant no. 5 T32 HS 013853-10). Supplementary Materials Supplemental material accompanying this article can be found in the online version as a hyperlink at http://dx.doi.org/10.1016/j.
  • 147. jval.2016.02.008 or, if a hard copy of article, at www.valueinhealth journal.com/issues (select volume, issue, and article). R E F E R E N C E S [1] Sturm R, Ringel JS, Andreyeva T. Increasing obesity rates and disability trends. Health Aff (Millwood) 2004;23:199–205. [2] Flegal KM, Carroll MD, Ogden CL, et al. Prevalence and trends in obesity among US adults, 1999–2008. JAMA 2010;303:235–41. [3] Hu FB. Obesity Epidemiology. .. Oxford, UK: Oxford University Press, 2008. [4] Dixon JB. The effect of obesity on health outcomes. Mol Cell Endocrinol 2010;316:104–8. [5] Colditz GA. Economic costs of obesity. Am J Clin Nutr 1992;55:503S–7S. [6] Wolf AM, Colditz GA. Current estimates of the economic cost of obesity in the United States. Obesity Res 1998;6:97–106. [7] Kortt MA, Langley PC, Cox ER. A review of cost-of-illness studies on obesity. Clin Therapeut 1998;20:772–9. [8] Colditz GA. Economic costs of obesity and inactivity. Med Sci Sports Exerc 1999;31:S663–7. [9] Anis AH, Zhang W, Bansback N, et al. Obesity and overweight in
  • 148. Canada: an updated cost-of-illness study. Obesity Rev 2010;11:31–40. [10] Thorpe KE, Florence CS, Howard DH, et al. The impact of obesity on rising medical spending. Health Aff (Millwood) 2004;Suppl. Web Exclusives:W4-480-6. [11] Finkelstein EA, Trogdon JG, Cohen JW, et al. Annual medical spending attributable to obesity: payer-and service-specific estimates. Health Aff (Millwood) 2009;28:w822–31. [12] Cawley J, Meyerhoefer C. The medical care costs of obesity: an instrumental variables approach. J Health Econ 2012;31:219–30. [13] Tsai AG, Williamson DF, Glick HA. Direct medical cost of overweight and obesity in the USA: a quantitative systematic review. Obesity Rev 2011;12:50–61. [14] Gavard JA. Health care costs of obesity in women. Obstet Gynecol Clin North Am 2009;36:213–26, xii. [15] Wang YC, McPherson K, Marsh T, et al. Health and economic burden of the projected obesity trends in the USA and the UK. Lancet 2011;378:815–25. [16] Trogdon JG, Finkelstein EA, Feagan CW, et al. State- and payer-specific
  • 149. estimates of annual medical expenditures attributable to obesity. Obesity (Silver Spring) 2012;20:214–20. [17] Wolf AM, Finer N, Allshouse AA, et al. PROCEED: Prospective Obesity Cohort of Economic Evaluation and Determinants: baseline health and healthcare utilization of the US sample. Diabetes Obes Metab 2008;10:1248–60. [18] Yang Z, Hall AG. The financial burden of overweight and obesity among elderly Americans: the dynamics of weight, longevity, and health care cost. Health Serv Res 2008;43:849–68. [19] Finkelstein EA, Trogdon JG, Brown DS, et al. The lifetime medical cost burden of overweight and obesity: implications for obesity prevention. Obesity (Silver Spring) 2008;16:1843–8. http://dx.doi.org/10.1016/j.jval.2016.02.008 http://dx.doi.org/10.1016/j.jval.2016.02.008 http://dx.doi.org/10.1016/j.jval.2016.02.008 http://www.valueinhealthjournal.com/issues http://www.valueinhealthjournal.com/issues V A L U E I N H E A L T H 1 9 ( 2 0 1 6 ) 6 0 2 – 6 1 3 613 [20] Cai L, Lubitz J, Flegal KM, et al. The predicted effects of chronic obesity in middle age on Medicare costs and mortality. Med Care 2010;48:510–7. [21] Finkelstein EA, DiBonaventura M, Burgess SM, et al. The
  • 150. costs of obesity in the workplace. J Occup Environ Med 2010;52:971–6. [22] Onwudiwe NC, Stuart B, Zuckerman IH, et al. Obesity and Medicare expenditure: accounting for age-related height loss. Obesity (Silver Spring) 2011;19:204–11. [23] Bell JF, Zimmerman FJ, Arterburn DE, et al. Health-care expenditures of overweight and obese males and females in the Medical Expenditures Panel Survey by age cohort. Obesity (Silver Spring) 2011;19:228–32. [24] Moriarty JP, Branda ME, Olsen KD, et al. The effects of incremental costs of smoking and obesity on health care costs among adults: a 7- year longitudinal study. J Occup Environ Med 2012;54:286–91. [25] Alley D, Lloyd J, Shaffer T, et al. Changes in the association between body mass index and Medicare costs, 1997–2006. Arch Intern Med 2012;172:277–8. [26] Ma S, Frick KD, Bleich S, et al. Racial disparities in medical expenditures within body weight categories. J Gen Intern Med 2012;27:780– 6. [27] Bureau of Labor Statistics. Archived Consumer Price Index Detailed Report Information. Available at
  • 151. http://www.bls.gov/cpi/cpi_dr.htm. [28] StataCorp. Stata Statistical Software: Release 12. College Station, TX: StataCorp LP, 2011. [29] Defining Overweight and Obesity, National Center for Chronic Disease Prevention and Health Promotion. Centers for Disease Control and Prevention, 2012. Available at http://www.cdc.gov/obesity/adult/ defining.html. [30] National Heart Lung and Blood Institute, National Institute of Diabetes and Digestive and Kidney Diseases (U.S.). Clinical Guidelines on the Identification, Evaluation, and Treatment of Overweight and Obesity in Adults: The Evidence Report. Bethesda, MD: National Institutes of Health, National Heart, Lung, and Blood Institute, 1998. [31] Jones A. Health econometrics. In: Culyer AJ, Newhouse JP, eds., Handbook of Health Economics. Amsterdam: Elsevier, 2000. [32] Manning WG, Mullahy J. Estimating log models: to transform or not to transform? J Health Econ 2001;20:461–94. [33] Buntin MB, Zaslavsky AM. Too much ado about two-part models and transformation? Comparing methods of modeling Medicare expenditures. J Health Econ 2004;23:525–42.
  • 152. [34] Basu A, Rathouz PJ. Estimating marginal and incremental effects on health outcomes using flexible link and variance function models. Biostatistics 2005;6:93–109. [35] Hartman M, Martin AB, Benson J, et al. National health spending in 2011: overall growth remains low, but some payers and services show signs of acceleration. Health Aff (Millwood) 2013;32:87–99. [36] Puhl RM, Liu S. A national survey of public views about the classification of obesity as a disease. Obesity (Silver Spring) 2015;23:1288– 95. [37] Barnes ER, Theeke LA, Mallow J. Impact of the Provider and Healthcare team Adherence to Treatment Guidelines (PHAT-G) intervention on adherence to national obesity clinical practice guidelines in a primary care centre. J Eval Clin Pract 2015;21:300–6. http://www.bls.gov/cpi/cpi_dr.htm http://www.cdc.gov/obesity/adult/defining.html http://www.cdc.gov/obesity/adult/defining.htmlEstimating the Medical Care Costs of Obesity in the United States: Systematic Review, Meta-Analysis, and Empirical AnalysisIntroductionMethodsA Systematic Review and Meta- AnalysisLiterature searchImprove comparability across studiesEvaluating quality of studiesMeta-analysisEmpirical Analysis: The Role of Alternative Statistical Models in Estimating Costs of ObesityStudy dataVariablesStudy design and data analysisResultsA Systematic Review and Meta-
  • 153. AnalysisDescriptive resultsQuality evaluationCost estimatesStratified resultsDifferent study methodologyDifferent confounder adjustmentEstimating Medical Costs of ObesityCharacteristics of individuals in the data setEffect of different target populationsEffect of different statistical modelsConfounding factor adjustmentDiscussionSupplementary MaterialsReferences Abstract Over the past 3 decades, the prevalence of overweight and obesity has increased dramatically worldwide. The rising trend of obesity indicates that this increase is not only confined to the developed world, but also extending towards the developing world. In the context, Saudi Arabia is now among the nations with the highest obesity and overweight prevalence rates due to a number of factors. This research explores and evaluates the prevalence of obesity in Saudi Arabia on the basis of the findings of previous literature. The research reveals that the rate of obesity is significantly high in the country among different age groups and occupations; at different locations in the country; and among both males and females. The main factors causing obesity include family history, diet pattern and eating habits, genetic factors, marital status, hypertension and lack of physical activities; while, the major consequences are cardiovascular diseases, diabetes, cancers, and Ischemic heart disease. The research stresses on the need to raise awareness regarding obesity and design efforts and strategies to combat it in the country. Keywords: Obesity, Heart disease, Cardiovascular, Overweight, Sedentary lifestyles, Osteoarthritis, Body mass index, Anthropometric
  • 154. Introduction The prevalence of obesity, over the past 3 decades, has increased in many countries around the world. It is defined by a 30 or higher body mass index (BMI) [1]. The problem of obesity extends globally as estimated by the WHO. In 2008, worldwide 1.5 billion adults were overweight, where nearly 300 million women and over 200 million men were obese. However, across different nations, the prevalence of obesity varies, ranging from below 5% in Japan, China, Indonesia, India, and certain African countries to over 75% in Nauru and Samoa. In addition, childhood obesity is also on the rise globally, and an epidemic in some countries. Worldwide, 22 million children approximately, under age 5, are estimated to be overweight. Obesity prevalence has also increased dramatically among children aged 6-17 years, which is extending into the developing world from the developed nations. The rising trend, as indicated by international data, is not confined to the developed world, and it is predicted that by 2030, a majority of adult population of the world would be either obese or overweight [2]. In the rise of obesity and overweight, the interaction of a number of factors is contributing, which include metabolic, genetic, environmental, and behavioural influences. According to Mahmood and Arulkumaran, the rapid growth in the rate of obesity is directly contributed by environmental and behavioural factors, rather than the biological factors. Moreover, racial or ethnic differences, consumption pattern, and lifestyle also influence the rate of obesity. For instance, as compared to rural areas, people in urban areas have higher obesity rate, possibly due to consumption of high-fat diets and more sedentary lifestyles. For daily living, the amount of energy spent has also
  • 155. reduced over the years, which also promotes obesity. Obesity is also often associated with high socio-economic status; as populations in the developed world are mostly affected by obesity. Over the past few decades, Saudi Arabia has become increasingly westernized, and now it has one of the highest obesity and overweight prevalence rates [3]. Obesity in the county is a major cause of concern, where 7 out of 10 people are experiencing the problem [4]. Previous studies related to prevalence of obesity in the Kingdom of Saudi Arabia (KSA) indicate an increasing trend in obesity and overweight, which are major sources of a number of other diseases, including hypertension, diabetes, obstructive sleep apnea, hyperlipidemia, and osteoarthritis [5]. The current research study aims to explore and evaluate the prevalence of obesity in Saudi Arabia. Based on findings of previous literature, the study examines the prevalence rate in the country, and explains its causes and consequences. Methodology The study adopts a qualitative approach and follows a review- design to explore the research problem. It performs a literature review to evaluate the prevalence of obesity in the KSA, and explain its causes and consequences in the country. It focuses on recent Saudi-specific literature and studies on obesity and Review iMedPub Journals http://www.imedpub.com/
  • 156. . A Review of Prevalence of Obesity in Saudi Arabia Saad Salman M. Alqarni* Department of Basic Sciences, College of Science and Health Professions, King Saud bin Abdualziz University for Health Sciences (KSAU-HS), Riyadh, Kingdom of Saudi Arabia *Corresponding author: Saad Salman M Alqarni, Department of Basic Sciences, College of Science and Health Professions, King Saud bin Abdualziz University for Health Sciences (KSAU-HS), Riyadh, Kingdom of Saudi Arabia, Tel: 011 4295668; E-mail: [email protected] Received date: September 13, 2016; Accepted date: October 20, 2016; Published date: October 25, 2016 Citation: M Alqarni SS (2016) A Review of Prevalence of Obesity in Saudi Arabia. J Obes Eat Disord 2:2. doi: 10.21767/2471-8203.100025 Copyright: © 2016 M Alqarni SS. This is an open-access article distributed u nder t he terms o f t he Creative Co mmons Attribution Lice nse, which permits unrestricted use, distribution, and reproduction in any medium, provided the original author and source are credited. Obesity & Eating Disorders ISSN 2471-8203 Vol.2 No.2:25 2016 © Under License of Creative Commons Attribution 3.0 License |
  • 157. This article is available from: 10.21767/2471-8203.100025 1 http://www.imedpub.com/ analyses the key findings. The research also evaluates and analyses secondary quantitative data specific to obesity in the KSA. Literature Review Obesity is regarded as a significant public health issue, which has raised a concern globally. The WHO claims that, obesity has more than doubled worldwide, since 1980. More than 1.9 adults were overweight, in the year 2014, including over 600 million obese individuals. 39% of the adults were overweight and 14% were obese. Moreover, it is found that 41 million children (under age 5) around the world in 2014 were either overweight or obese [6]. Previous studies have revealed that obesity is among the major cause of co-morbidities, including cardiovascular diseases, diabetes, cancers, and the related issues that may lead to morbidity and mortality. In most of the countries, the high total obesity and overweight cost represents a relative economic burden on the GDP. Over the last decade, the prevalence of obesity has increased significantly in several developed and developing countries [7]. The current research paper focuses on obesity in Saudi Arabia, which has now one of the highest obesity and overweight prevalence rates [3]. Sabra examine obesity among female nursing students in Dammam, Saudi Arabia using waist to hip ratio (WHR) and body mass index (BMI). The study collected data with the help of an interviewer-administered questionnaire, from a sample of 260 female nursing students. The results of the study indicate the