2. SERUM ALBUMIN AND MUSCLE IN THE ELDERLY 553
‘ ± SD.
2 Significantly different from men.P < 0.02.
area of Albuquerque. NM. Ninety-six percent of the partici-
pants are non-Hispanic whites, whereas 4% claim Hispanic
origin: the cohort does not represent a population-based sample
of Albuquerque, which is 33% Hispanic. The entrance crite-
na for the study excluded persons with serious diseases, for
example, cancer (other than skin) within the past5 y; recent,
acute myocardial infarction; or chronic obstructive pulmonary
disease, and persons taking a meaningful number of medica-
tions, such as those undergoing chemotherapy or taking car-
diac, respiratory, or antipsychotic medications. About 56% of
the participants in the present data set were recruited between
1980 and 1985: the remainder were recruited in 1992-1993.
Because the maintenance of good health is not required to
remain in the study, participants who developed chronic ill-
nesses before or during the 1993 study year are included in the
present analyses. All participants gave their informed consent
to participate in the study. The study protocol was approved by
the Human Subjects Research Review Committee of the Uni-
versity of New Mexico School of Medicine.
Serum albumin concentrations were determined with the
bromcresol green procedure on a 747 SMA (Hitachi, Tokyo) at
the New Mexico Medical Reference Laboratory (Albuquerque,
NM). Usual dietary intake was estimated through amodified,
standard food-frequency questionnaire administered in an in-
terview (Health Habits and History Questionnaire, version 2.2;
16). Physical activity was graded using a modification of the
self-administered instrument first described by Shapiro et al
( I 7) and later adapted by Cassel et al ( 18) to study the relation
of physical activity to coronary heart disease. The modifica-
tions were a substitution of questions on job-related activities
with a more extended set relating to leisure-time activities
appropriate to ambulatory, community-dwelling elderly peo-
pIe. The questionnaire results in a summary score (range: 0-65)
that grades individuals with regard to self-reported “usual”
physical activity, rather than in anestimate of energy expen-
diture. Past and current morbidity and medication use were
ascertained from medical histories and examinations. Prevalent
major chronic diseases were ascertained by physical examina-
tion and from medical records and grouped by International
Classification of Diseases codes ( I 9). An index of comorbidity
was defined as the sum of the current, chronic conditions
present at the time of the body-composition examinations.
Subjects with current, acute infectious illness or recent trauma
(eg, hip fractures) were excluded.
Body composition (fat, fat-free soft tissue, and bone mineral
content) was estimated using DXA (Lunar DPX, version 3.6z
software: Lunar Corp. Madison, WI), as described previously
(14). Fat-free mass (FFM) was defined as the sum of the
fat-free soft tissue and total-body bone mineral content from
whole-body scans. Medium-length scans (20 mm) were used
for all subjects except for those with> 27-cm anteroposterior
thicknesses, for whom the slow (40-mm) scan speed was used.
The technical errors of body-composition determinations by
DXA were estimated to be ± 0.77 kg for FFM or ± 1 .2% for
percentage body fat from two repeated scans taken on separate
days for five randomly selected subjects. Appendicular skeletal
muscle mass (ASM) was derived as the sum of the fat-free soft
tissue masses of the arms and the legs, as described by Heyms-
field et al (20). Anthropometric measurements were taken
using standardized methods (2 1). Weight was measured to the
nearest 0. 1 kg on a balance scale and stature was measured to
the nearest 0.1 cm with a wall-mounted stadiometer. Knee
height was measured with a sliding caliper as described previ-
ously (22). All anthropometric measurements were taken twice
and the reported values are the means of the repeated
measurements.
Data for men and women were analyzed separately. All
variables were regressed on age to describe age differences.
Regressions of muscle mass on age were adjusted additionally
for body weight, knee height, comorbidity, energy and protein
intakes, and physical activity score. Muscle was also expressed
as a percentage of lean soft tissue mass (FFM less bone) and
protein intake as a percentage of total energy intake. Univariate
associations of muscle mass, percentage muscle mass,protein
and energy intakes, and physical activity with serum albumin
were tested by linear regression. The association of serum
albumin with levels of comorbidity (0 to4 comorbid con-
ditions) was tested by analysis of variance. Differences in
age-adjusted mean serum albumin concentrations across levels
of comorbidity were tested using analysis of covariance. Mul-
tiple regression was used to test for the independent effects of
age, protein intake, comorbidity, physical activity, and muscle
mass on serum albumin. Estrogen replacement therapy (ERT)
was also entered as a variable in regression analyses for
women. Statistical significance was evaluated at a 0.05.
RESULTS
Descriptive statistics for the study variables are shown in
Table 1. Twenty-six percent of the men and 3 1% of the women
had BMIs > 27. Percentage body fat ranged from 7% to 40%
in the men and from 17% to 53% in the women. ASM, as
quantified from DXA, was 41.3% of FFM in the men and
38.8% in the women. Dietary energy and protein intakes were
comparable with those reported elsewhere for healthy elderly
adults (23). Protein as a percentage of energy intake was
15.8 ± 2.6% and there was no significant difference between
the men and the women. Protein intake was 0.90 g/kg body wt
( I .46 glkg FFM) in the women and 0.89 gfkg body wt ( I .22
g/kg FFM) in the men.
Physical activity scores were significantly higher in the men
than in the women (P < 0.02). The scores were positively
TABLE I
Descriptive statistics for study variables’
Men
(ii - 108)
Women
(ii 167)
Age (y) 76.0 ± 5.4 75.7 ± 6.4
Weight (kg) 76.2 ± 10.8 63.1 ± 10.7
Stature (cm) 172.6 ± 6.9 158.3 ± 6.1
Knee height (cm) 53.6 ± 2.5 48.5 ± 2.5
BMI (kg/m2) 25.6 3.4 25.1 ± 3.8
Body fat(%) 27.0 ± 6.9 37.3 7.3
Fat-free mass (kg) 55.0 ± 6.1 38.1 ± 3.7
Appendicular skeletal muscle (kg) 22.7 ± 2.9 14.8 ± 1.8
Energy intake (kJ/d) 7065.9 ± 189.6 6010.0 ± 152.5
Protein intake (g/d) 66.3 20.9 55.5 ± 16.6
Serum albumin (gIL) 41.3 ± 2.9 40.9 ± 2.4
Physical activity score 18.5 ± 0.6 16.7 ± 0.52
byguestonJanuary18,2015ajcn.nutrition.orgDownloadedfrom
3. 554 BAUMGARTNER ET AL
correlated with ASM in the men(r 0.28, P < 0.003) and the
women (r = 0. 13, P < 0.09). Correlations with percentage
body fat, however, were negative, were about the same mag-
nitude in both sexes, and were also significant (r = -0.22, P <
0.04).
As shown in Table 2, only 2% and 2.5% of serum albumin
concentrations in the men and women, respectively, were< 35
g/L, the lower limit of the normal reference range (10). Ten
percent of serum albumin values were< 38 g/L in each sex,
the concentration below which risk has been reported to in-
crease (6). None of the men and only 3.6% of the women were
current smokers. There was no detectable difference in serum
albumin concentration between smoking and nonsmoking
women. Alcohol consumption (not shown) was light to mod-
erate. About 26% of the women were receiving ERT and mean
serum albumin concentrations were slightly but significantly
lower in these women (40.3 ± 0.4 gIL) than in those not
receiving ERT (4 1. I ± 0.2 gIL, P < 0.03). None of the
participants was taking any other steroid hormones at the time
of data collection.
Table 2 also shows the prevalences of major chronic diseases
in the study population. Osteoarthritis was the most common
condition, occurring in more than one-half of all participants,
followed by hypertension. None of the men or women had
rheumatoid arthritis or other acute or chronic inflammatory
conditions known to affect serum albumin (24). About 10% of
the men and 3% of the women had diagnosed renal or liver
diseases. Although renal and liver disease may significantly
affect serum albumin, this group did not differ significantly for
mean age, protein intake, physical activity, body composition,
or serum albumin concentration from the group without these
diseases. The exclusion of participants with diagnosed renal or
liver disease did not materially affect the results of the analyses
except in terms of reduced statistical power, as would be
expected as a result of the somewhat smaller sample sizes. As
a result, the analyses reported were made with data for the
complete study population.
Results for the linear regressions of the variables on age are
shown in Table 3. Serum albumin, ASM, ASM as a percentage
of lean soft tissue mass, and physical activity score had signif-
TABLE 2
Percentages of men and women with low serum albumin concentrations,
smoking habit, medication use, or chronic disease’
Men
(n 108)
Women
(n 167)
%
Serum albumin
35g/L 2.0 2.5
38 g/L 10.0 10.0
Current smokers 0.0 3.6
Estrogen replacement therapy NA 26.3
CHD or CVD 19.4 16.8
Neoplasias2 14.8 9.0
Osteoarthritis 51.9 66.5
Hypertension 24.1 28.7
Renal or liver disease 10.2 3.0
‘ NA, not applicable; CHD, coronary heart disease; CVD, cardiovascu-
lar disease.
2 Benign or in remission during 1993.
icant negative correlations with age in both sexes(P < 0.05),
whereas comorbidity had significant positive correlations. Pro-
tein and energy intakes were not associated significantly with
age in either sex. Albumin decreased with age in both men
(slope = -0.16 g L_i . y_i) and women (slope = -0.08
g L y I) ASM (absolute as well as a percentage of lean
soft tissue mass) decreased significantly with age in the men
and women even after adjustment for weight, knee height,
comorbidity, energy and protein intakes, and physical activity.
There were no significant differences in age-adjusted mean
serum albumin concentrations across levels of comorbidity
(Table 4). In addition, therewere no differences in age-ad-
justed mean serum albumin concentrations between those with
and without specific categories of morbidity. It is recognized,
however, that the statistical power to detect significant differ-
ences is low for some of these comparisons because of the
small numbers of cases.
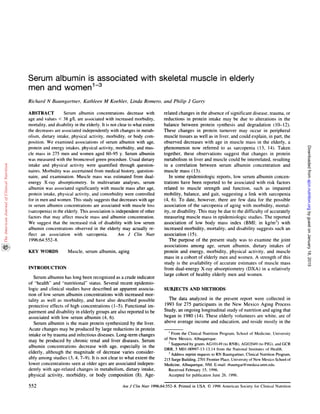
Serum albumin concentrations were positively associated
with total muscle mass in the men (Figure 1), even after age,
protein intake, comorbidity, and physical activity were con-
trolled for, as shown in Table 5. Serum albumin concentrations
were positively associated with muscle as a percentage of lean
soft tissue mass in the women (Figure 2), even after age,
protein intake, comorbidity, ERT, and physical activity were
controlled for (Table 5). Age remained significantly associated
(P < 0.05) with serum albumin in both men and women after
adjustment for the other independent variables. Physical activ-
ity had a significant negative association with serum albumin in
the women but not in the men. Serum albumin also had a
significant negative association with ERT in the women after
adjustment for age, protein intake, comorbidity, physical ac-
tivity, and muscle. The inclusion of dietary energy intake in
these regression models had no meaningful effect on the
results.
DISCUSSION
This study suggests that low serum albumin concentrations
are associated with reduced muscle mass (sarcopenia) in rela-
tively healthy, well-nourished elderly men and women. In our
study population, serum albumin concentrations were generally
within the normal reference range(35-50 g/L), but decreased
significantly with age. The concentrations were not associated
significantly with either protein or energy intake and did not
differ among categories of chronic morbidity or across levels of
comorbidity. Serum albumin was associated significantly with
skeletal muscle mass independent of age, dietary protein and
energy intakes, physical activity, ERT in women, and morbid-
ity. This association suggests some connection between serum
albumin and muscle mass such that losses of somatic (muscle)
protein stores either covary with or affect decreases in serum
albumin concentrations. This association is independent of
factors known to affect protein metabolism, such as dietary
intake and physical activity. The mechanism or mechanism
connecting serum albumin and skeletal muscle is not known
but could involve changes in eitherI) the extravascular distri-
bution of albumin in muscle or2) protein synthesis and deg-
radation in both muscle and liver.
Rall Ct al (10) recently reviewed current knowledge about
serum albumin as an indicator of nutritional and health status.
byguestonJanuary18,2015ajcn.nutrition.orgDownloadedfrom
4. SERUM ALBUMIN AND MUSCLE IN THE ELDERLY 555
TABLE 3
Correlation and regression of study variables with age (y)’
Men (n = 108) Women (n = 167)
r Slope2 r Slope2
Serum albumin (gIL) -0.29” -0.158 ± 0.050 -0.077 0.028
ASM (g) -0.34 - 1 83.45 ± 50.08 -0.34 -94.97 ± 20.1
ASM/LSTM (Ck) 0.341 -0.1 17 ± 0.032 -0.32” -0.1 16 0.026
Protein intake
(g/d) -0.06 -0.254 ± 0.377 -0.1 1 -0.295 ± 0.199
(‘7c of energy) -0.09 -0.036 ± 0.040 -0.1 1 -0.049 0.034
Energy (kJ/d) -0.02 -9.28 ± 39.94 -0.05 - 15.49 ± 21.73
Comorbidity 0.34” 0.061 ± 0.017 0.40” 0.060 ± 0.01 1
Physical activity score -0.38 -0.448 ± 0.105 -0.23” -0.212 ± 0.684
‘ ASM, appendicular skeletal muscle mass; LSTM, lean soft tissue mass.
2 SE.
“P < 0.05.
In brief summary, albumin is the main protein synthesized by acute reduction in albumin production and serum albumin
the liver. Serum concentrations depend on liver synthesis, concentrations are often low in patients with alcoholic cirrhosis
degradation in peripheral tissue, and intra- and extravascular (1 1). The effects of chronic diseases, other than renal and liver
distribution in extracellular fluids. The functions of serum disease, are unclear. Heavy smoking is reported to be inversely
albumin are 1) to maintain osmotic pressure, 2) to act as a associated with serum albumin and may confound associations
transport vehicle for amino acids and other substances to pe- with chronic morbidity and mortality in some studies (4). There
ripheral tissues, and 3) to serve as a temporary amino acid is little evidence that hepatic synthesis of albumin is impaired
storage site. About 120-220 mg albumin/kg body wt is syn- with age independent of disease( 1 1).
thesized daily and its half-life is= 17-20 d. About one-third of Protein distribution and turnover in the visceral and muscle
the amino acids in daily dietary intake are used in the synthesis compartments were not measured in the present study. As a
of albumin and other plasma proteins. Hepatic synthesis of result, we can only speculate as to the underlying nature of the
albumin increases after a meal in response to the increased association observed between serum albumin and muscle mass,
availability of amino acids and decreases during fasting in which could be direct or indirect. Sixty percent of total body
association with the reduction of the amino acid pool (1 1). albumin is extravascular in muscle and skin, and serum albu-
These changes in albumin synthesis, however, do not result in mm exchanges with this pool (10, 1 1). It is not clear, however,
large changes in serum concentrations, so serum albumin is how an alteration in the extravascular muscle pool would affect
often regarded as an insensitive indicator of dietary intake serum albumin concentrations unless exchange between the
status ( 10). intra- and extravascular pools is somehow altered ( 1 1). It
Serum albumin synthesis appears to be spared in starvation seems more likely that the connection is indirect; covariation
because amino acids are drawn from skeletal muscle. Long- between serum albumin and muscle mass may reflect shared
term protein deficiency with adequate energy intake (protein- effects of changes with age in protein metabolism.
energy malnutrition), however, results in skeletal muscle up- It is generally believed that rates of protein synthesis and
take of carbohydrate, fatty acids, and amino acids at the degradation decrease with age (25). Some recent studies mdi-
expense of hepatic protein synthesis and leads to hypoalbumin- cate, however, that whole-body protein synthesis rates are
emia. Injury and inflammation cause acute declines in serum actually slightly higher and that rates of degradation are the
albumin concentrations ( I 0, 24). Alcohol intake causes an same in elderly compared with young adults when expressed in
TABLE 4
Analysis of variance of serum albumin concentrations by number of comorbid conditions present (0 to4)!
0 1 2 3
Men
ml 25 39 35 6 3
Crude value (gIL) 41.1 41.3 41.7 41.0 39.7
Age-adjusted value, (gIL) 40.6 41.4 41.8 41.6 39.7
Women
ii 23 82 41 15 6
Crude value (gIL) 41.0 40.8 41.1 40.2 41.3
Age-adjusted value. (gIL) 40.8 40.8 41.1 40.8 41.9
, Crude values are mean serum albumin concentrations; age-adjusted values are mean concentrations adjusted by analysis of covariance for differences
in age across levels of comorbidity. Comorbidity was defined as the sum of International Classification of Disease-coded prevalent chronic conditions,
including coronary heart disease and cardiovascular disease, neoplasias (benign or in remission), osteoarthritis and arthrosis, hypertension, and renal and
liver diseases.
byguestonJanuary18,2015ajcn.nutrition.orgDownloadedfrom
5. ..1..(
50
45
40
35
-I
C)
C
E
.0
Co
E
5-
a)
Cl)
U
. .
U
U
U
UU U U
_U U U
U #{149}U U
U #{149}#{149}UU
U F
#{149}UU #{149}
- U U
U UU
U
r = 0.29
U
10 35
-j
C)
C
E
.0
Co
E
5-
a)
Cl)
45
40
35
30
S #{149}
.
.. _.... .
. S S #{149}
. __.
. S #{149}#{149}#{149}
__... . .
... _._.
- .. ... .
. . .
. a
.
r = 0.25
‘ ASM, appendicular skeletal muscle mass: NS, not significant: LSTM.
lean soft tissue mass.
2 SE.
4 Total R2 (ek) = 14.06 for men and 20.23 for women.
Muscle (% of lean soft tissue mass)
556 BAUMGARTNER ET AL
FIGURE 2. Correlation of seruiii alhuniin concentration with muscle
mass as a percentage of lean soft tissue mass in elderly women.ii = 167.
30
15 20 25 30
Muscle mass (kg)
FIGURE 1.Correlation of serum albumin concentration with muscle
mass in elderly men. n = 108.
relation to body cell mass or creatinine excretion (26). Young
(26) and associates have suggested that these results reflect the
decreased contribution of skeletal muscle to whole-body pro-
tein turnover. They estimate that muscle contributes 20% to
whole-body protein turnover in the elderly compared with 30%
in younger adults. The decreased reserve of skeletal muscle
protein in the elderly limits the supply of amino acids from
peripheral tissues for protein synthesis by vital organs during
acute physiologic stresses such as disease, injury, and starva-
tion. The elderly, therefore, should have an increased likeli-
hood of low serum albumin concentrations compared with
younger adults under these stressful conditions. It is not clear,
TABLE S
Multiple-regression results for serum albumin on independent variables’
.
Independent variable
Regression
.
coefficienr
P <
Partial
R
%
Men (n = 108)
Intercept 48.702 ± 5.694 - -
Age (y) -0.154 ± 0.059 0.0008 8.56
Protein intake (g/d) -0.002 ± 0.013 NS 0.05
Comorbidity 0.254 ± 0.294 NS 1.05
ASM (g) 0.219 ± 0.098 0.039 3.69
Physical activity score -0.043 ± 0.047 NS 0.71
Women (‘i = 167)
Intercept 40.539 ± 4.476 - -
Age (y) -0.108 ± 0.032 0.0008 4.34
Protein intake (g/d) 0.005 ± 0.010 NS 0.10
Comorbidity 0.098 ± 0.197 NS 0.13
Estrogen replacement
therapy (0, 1 ) - I .524 ± 0.404 0.0002 6.21
Physical activity -0.098 ± 0.031 0.002 4.30
ASM/LSTM (C/c) 0.250 ± 0.078 0.()02 5.16
however, how a decreased availability of muscle amino acids
could result in low serum albumin in relatively ‘unstressed”
elderly people with “adequate” dietary protein intake. Thus. it
seems that we are forced to return to the hypothesis that
decreased rates of protein turnover do occur with age in both
liver and muscle and underlie covarying changes in serum
albumin concentrations and muscle mass.
With regard to the effects of dietary intake, acute and chronic
disease, alcohol intake, and smoking, it is important to empha-
size several facts in the present study. Both serum albumin and
body composition were measured after an overnight fast. The
participants were not malnourished. Those with acute illness.
recent trauma, or serious chronic disease were excluded from
the study. Only a handful of subjects smoked, and none were
known to be alcoholic. Nonetheless, a possible limitation of
this study could be the ascertainment of chronic morbidity and
the quantification of the effects of comorbidity in the analyses.
As noted, the presence of chronic illnesses in the study partic-
ipants was ascertained from a combination of self-report, med-
ical history, and examination, which should reduce the likeli-
hood of missed or misclassified illnesses. Nonetheless, we
cannot rule out the possibility of the influence of undiagnosed,
subclinical chronic illnesses. The severity of the chronic ill-
nesses present was not graded. Also, the comorbidity index
could have obscured the associations of specific illnesses with
serum albumin. Significant differences in serum albumin con-
centrations were not observed, however, among the different
classes of morbidity, but these analyses lacked statistical power
because of small numbers.
Roubenoff et al (24) observed that serum albumin, as well as
body cell mass, is reduced in patients with rheumatoid arthritis.
They hypothesized that other chronic inflammatory conditions
alter protein metabolism also, and could underlie the decreases
seen in both serum albumin and muscle mass with aging.
Inflammatory illnesses and illnesses that cause the acute-phase
response reduce albumin gene expression, alter the intra- and
extravascular distribution of albumin, and increase the rate of
degradation ( 1 1). We did not measure C-reactive protein or
30 35 40 45 50
byguestonJanuary18,2015ajcn.nutrition.orgDownloadedfrom
6. SERUM ALBUMIN AND MUSCLE IN THE ELDERLY 557
cytokines that could serve as markers or mediators for inflam-
mation-based alterations in protein metabolism in both liver
and muscle (24). It is therefore possible that the association
between serum albumin and muscle mass observed in the
present study reflects the effects in some of our subjects of
underlying chronic inflammatory conditions that were not ac-
counted for in our ascertainment of morbidity.
Serum albumin was reduced significantly in the women
receiving ERT. This could be due to increased plasma volume
in these women but we cannot test this hypothesis with the
current data. In any event, the associations of serum albumin
with age and muscle mass in the women were independent of
this effect of ERT. None of themen was currently using any
steroid medications. As a result, the associations of serum
albumin with age and muscle cannot be readily explained by
confounding effects of medications in either sex. In addition,
we have noted elsewhere thatdecreases with age in muscle
mass, as well as in body cell mass, in women may be masked
somewhat by increases in the fraction of FFM that is extracel-
lular fluid (14). This could explain why in the women ASM as
a percentage of lean soft tissue mass was a better predictor of
serum albumin than absolute ASM.
Finally, the association between serum albumin and muscle
mass was independent of physical activity. Physical activity, as
graded in the present study, was associated significantly with
age and body composition in both sexes and with serum albu-
mm concentrations in the women. The physical activity assess-
ment instrument used captures a broad range of activities from
relatively sedentary (eg,gardening and fishing) to high-energy-
expenditure activities (eg, jogging and cross-country skiing).
We believe that the significant correlations of the physical
activity scores with body composition support the general
validity of our questionnaire for grading physical activity in
this study population. Recent studies suggest that high-inten-
sity, weight-bearing exercise stimulates muscle protein metab-
olism in older men and may elevate the need for dietary protein
(27). Although participants in the Aging Process Study may be
generally characterized as healthy, active elderly adults, few
are known to engage regularly in high-intensity weight lifting
or resistive exercise.
Controversy exists for the effects on protein metabolism of
low-intensity or aerobic exercise, which is more typical of
relatively healthy, community-dwelling elderly people. Carraro
et al (28) reported no effects on the fractional rates or concen-
trations of serum albumin in men after 4 h of aerobic exercise
at 40% maximal oxygen consumption while dietary protein
intake was held constant. In the present analyses, the associa-
tion of physical activity with serum albumin inthe women was
negative. This might suggest that higher levels of physical
activity in the elderly women were associated with increased
protein degradation without a corresponding stimulation of
protein synthesis. This interpretation is highly speculative,
however, in the absence of data for protein turnover. Some
investigators have reported a transient decrease in serum albu-
mm after moderate-intensity exercise that lasts 4-10 d (29). It
is important to keep in mind that the instrument used in the
present study was designed tomeasure habitual or usual phys-
ical activity and therefore would be expected to reflect chronic
rather than transient effects on protein metabolism. Also, there
is no obvious explanation for why an association between
serum albumin and physical activity was found in the women
but not in the men. In sum, although the decrease with age in
muscle mass, or sarcopenia, can be attributed in part to a
progressive decline in physical activity with age (30), it is
difficult to explain either the age-related decrease in serum
albumin or the association between albumin and muscle in
terms of physical activity.
An important strength of the current study was the estimation
of muscle mass by DXA. Previous studies have not reported
significant associations between serum albumin and indexes of
body composition, such as the BMI (3 1). BMI, however, cor-
relates more strongly with body fat than with lean body mass
and may not be a very sensitive index of muscle or body
protein stores, except in emaciation. In elderly people, muscle
loss can be masked by increased body fat. The elderly also tend
to have less muscle and more fat at any BMI than younger
adults ( 14). There are inconsistent reports of associations of
serum albumin with more specific components of fat-free body
composition, such as body cell mass and FFM (24, 32). Both of
these components include inert subcomponents, such as water
and bone mineral, and do not separate skeletal muscle from
organ tissue. DXA is not affected in any known way by
age-related changes in anatomy. physiology. or metabolism.
which may bias anthropometric and creatinine excretion meth-
ods of estimating muscle mass (33). Estimates of muscle mass
from DXA compare favorably with those from computerized
tomography, which is considered to be the most accurate in
vivo means of quantitating major soft tissue components such
as muscle and adipose tissue (33).
Serum albumin concentrations < 38 g/L have been shown to
be associated with increased risk of disability in elderly adults
(6). Low BMI has also been shown to be associated with
reduced functional capabilities in community-dwelling elderly
( 15). Most elderly people with low BMIs have reduced muscle
mass, which may be worsened by weight loss (14). Regardless
of the nature of the mechanisms underlying the relation be-
tween serum albumin and somatic protein reserves in healthy
elderly persons, the present study suggests that serum albumin
does reflect muscle mass to some extent. It is not possible to
establish any causal direction to this relation from the present
cross-sectional analyses. It seems reasonable, however, to hy-
pothesize that the reported risk of disability with low serum
albumin concentrations in the elderly is more likely to be
attributable to sarcopenia. Further research is needed to clarify
the joint associations between serum albumin, sarcopenia, mor-
bidity, and disability in elderly populations. It is possible that
low serum albumin concentrations and sarcopenia are corre-
lated, early warning signs ofdeleterious underlying, subclinical
conditions and impending disease and disability. Future studies
should include more precise estimates of skeletal muscle mass
from DXA as a risk factor for functional disability as well as
for chronic diseases. A
REFERENCES
I . Phillips A, Shaper AG. Whincup PH. Association between serum
albumin and mortality from cardiovascular disease. cancer. and other
causes. Lancet 1989:2:1434-6.
2. Kuller LH, Eichner JE, Orcahrd Ti. The relationship between serum
albumin levels and risk of coronary heart disease in the Multiple Risk
Factor Intervention Trial. Am J Epidemiol l99l:l34:l266-77.
3. Klonoff-Cohen H. Barrett-Conor EL. Edelstein SL. Albumin levels as
byguestonJanuary18,2015ajcn.nutrition.orgDownloadedfrom
7. 558 BAUMGARTNER ET AL
a predictor of mortality in the healthy elderly. J Clin Epidemiol
1992:4:207-12.
4. Salive ME, Cornoni-Huntley J, PhillipsCL, et al. Serum albumin in
older persons: relationship with age and health status. J Clin Epidemiol
1992:4:213-21.
5. Gillum RF, Ingram DD. Makuc DM. Relationship betweenserum
albumin concentration and stroke incidence and death: the NHANES
I Epidemiologic Follow-up Study. AmJ Epidemiol 1994;140:876-88.
6. Corti M-C, Guralnik JM, Salive ME, Sorkin JD. Serum albumin level
and physical disability as predictors of mortality in older persons.
JAMA l994;272: 1036-42.
7. Campion EW, deLabry LO, Glynn Ri. The effect of age on serum
albumin in healthy males: report from the Normative Aging Study. J
Gerontol l988;43:M I 8-20.
8. Shibata H, Haga H. Ueno M, Nagai H, Yasumura S. Koyano W.
Longitudinal changes of serum albuminin elderly people living in the
community. Age Ageing l991;20:417-20.
9. Romero L, Hunt WC, Garry PJ. Serum albumin results from a longi-
tudinal study of community-dwelling healthy elderly in the New
Mexico Aging Process Study. In: Rosenberg IH, ed. Nutritional as-
sessment of elderly populations. Bristol-Myers SquibblMead Johnson
nutrition symposia. Vol 13. New York: Raven Press, 1995:40-9.
10. RaIl LC, Roubenoff R, Harris TB. Albumin as a marker of nutritional
and health status. In: Rosenberg IH, ed. Nutritional assessment of
elderly populations. Bristol-Myers SquibblMead Johnson nutrition
symposia. Vol 13. New York: Raven Press, 1995:1-17.
11. Rothschild MA, Oratz M, Schrieber SS. Serum albumin. Hepatology
1988:8:385-410.
12. Gersovitz M, Munro HN, Udall J, Young yR. Albumin synthesis in
young and elderly subjects using a new stable isotope methodology:
response to level of protein intake. Metabolism 1980;29: 1075-85.
13. Young VR, Sanchez M. Albumin, skeletal muscle, and leanbody mass
as functional predictors in the elderly: brief commentand analysis. In:
Rosenberg IH, ed. Nutritional assessment of elderly populations.
Bristol-Myers SquibbfMead Johnson nutrition symposia. Vol 13.
New York: Raven Press, 1995:63-73.
14. Baumgartner RN. Stauber PM, McHugh D, Koehler K. GarryPJ.
Cross-sectional age-differences inbody compostion in persons 60+
years of age. I Gerontol l995:50A:M307-l6.
I 5. Galanos AN, Pieper CF. Coroni-Huntley JC, Bales CW, Fillenbaum
GO. Nutrition and function: is there a relationship between body mass
index and the functional capabilities of community-dwelling elderly?
J Am Geriatr Soc 1994;42:368-73.
I 6. National Cancer Institute. Health habits and history questionnaire: diet
history and other risk factors. Personal computer system packet, ver-
sion 2.2. Bethesda, MD: National Cancer Institute, 1989.
17. Shapiro 5, Weinblatt E, Frank CW, Sager RV. The HIP. study of
incidence and prognosis of coronary heart disease: preliminary find-
ings on incidence of myocardial infarction and angina. J Chronic Dis
1965; 18:527-58.
18. Cassel J, Heyden 5, Bartel AG,et al. Occupation and physical activity
and coronary heart disease. Arch Intern Med 197 1:128:920-8.
19. Commission on Professional and Hospital Activities. The international
classification of diseases. 9th revision. Ann Arbor, MI: Edwards
Brothers, 1987.
20. Heymsfield SB. Smith R.Aulet M. et al. Appendicular skeletal muscle
mass: measurement by dual photon absorptiometry. Am J Clin Nutr
l990;52:2l4-8.
21. Lohman TG, Roche AF, Martorell R, eds. Anthropometric standard-
ization reference manual. Champaign, IL: Human Kinetics, 1988.
22. Cockram DB, Baumgartner RN. Evaluation of accuracy and reliability
of calipers for measuring recumbent knee height in elderly people.
Am J Clin Nutr l990;52:397-400.
23. Mares-Perlman IA, Klein BEK, Klein R, Ritter LL, Fisher MR.
Freudenheim JL. A diet history questionnaire ranks nutrient intakes in
middle-age and older men and womensimilarly to multiple food
records.J Nutr 1993;l23:489-S0l.
24. Roubenoff R, Grimm LW, Roubenoff RA. Albumin, body composi-
tion, and dietary intake inchronic inflammation. In: Rosenberg IH. ed.
Nutritional assessment of elderly populations. Bristol-Myers Squibb/
Mead Johnson nutrition symposia. Vol13. New York: Raven Press.
1995:30-9.
25. Richardson A, Ward WF. Changes in protein turnover as a function of
age and nutritional status. In: WatsonRR, ed. Handbook of nutrition in
the aged. Boca Raton, FL: CRC Press, 1994:309-16.
26. Young yR. Amino acids and proteins inrelation to the nutrition of
elderly people. Age Ageing l990;l9:S10-24.
27. Evans Wi. Exercise, nutrition and aging. J Nutr 1992:122:796-801.
28. Carraro F, Hartl WH, Stuart CA, Layman DK, Jahoor F, Wolfe RR.
Whole body and plasma protein synthesis inexercise and recovery in
human subjects. Am J Physiol 1990;258:E82 1-31.
29. Butterfield 0. Whole body protein utilization in humans. Med Sci
Sports Exerc 1987;19:S157-65.
30. Bortz WM. Disuse and aging. JAMA 1982;248: 1203-8.
3 1. Lemonnier D, Acher S. Boukaiba N. et al. Discrepancy between
anthropometry and biochemistry in theassessment of the nutritional
status of the elderly. Eur J Clin Nutr l99l;45:28l-6.
32. Forse RA, Shizgal HM. Serum albumin and nutritional status. JPEN J
Parenter Enteral Nutr 1908:4:450-4.
33. Wang Z, Visser M, Ma R,et a!. Skeletal muscle mass: validation of
neutron activation and dual energy X-ray absorptiometry methods by
computed tomography. J AppI Physiol I 996;80:824-3 I.
byguestonJanuary18,2015ajcn.nutrition.orgDownloadedfrom