Download as PDF, PPTX


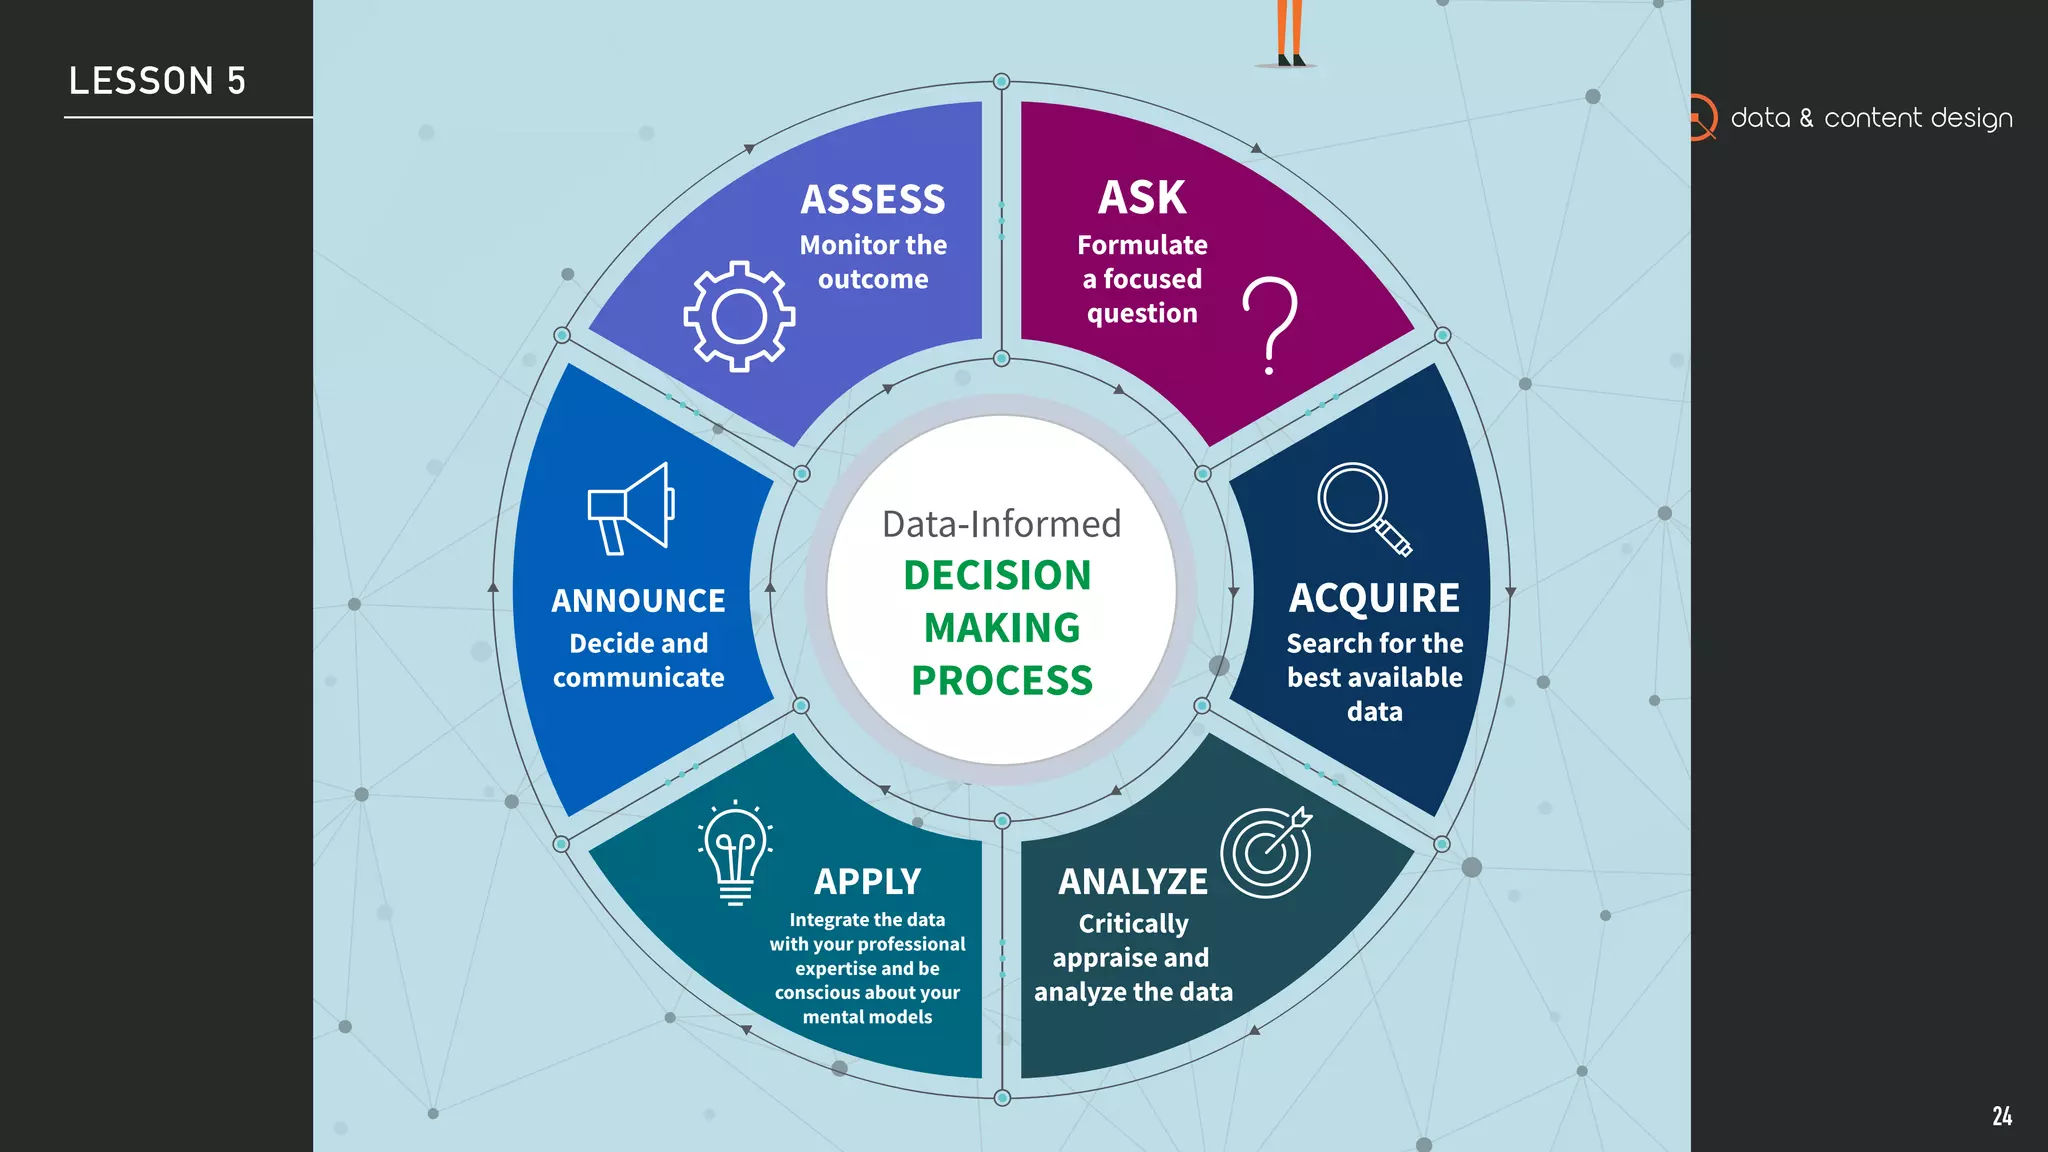
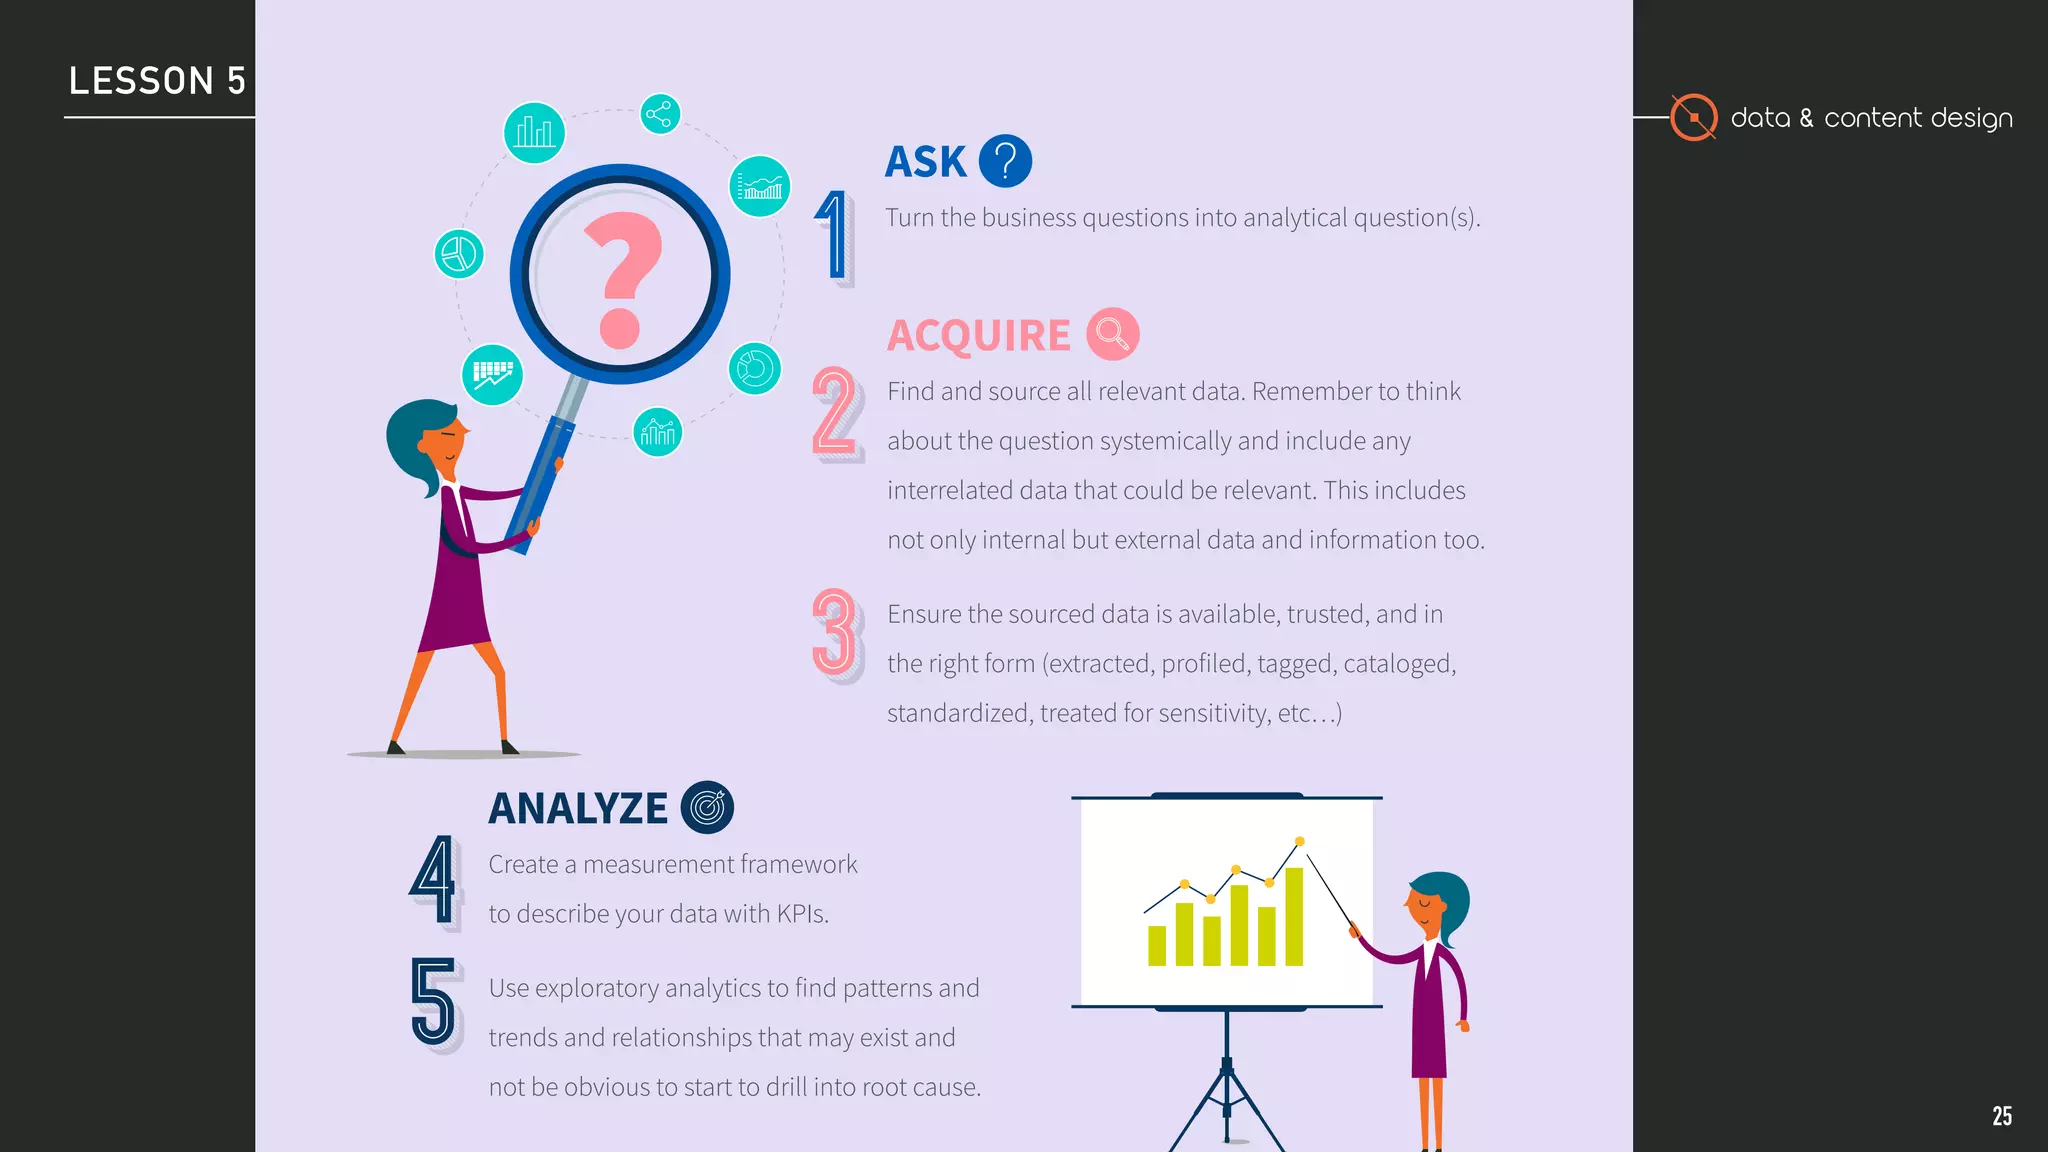
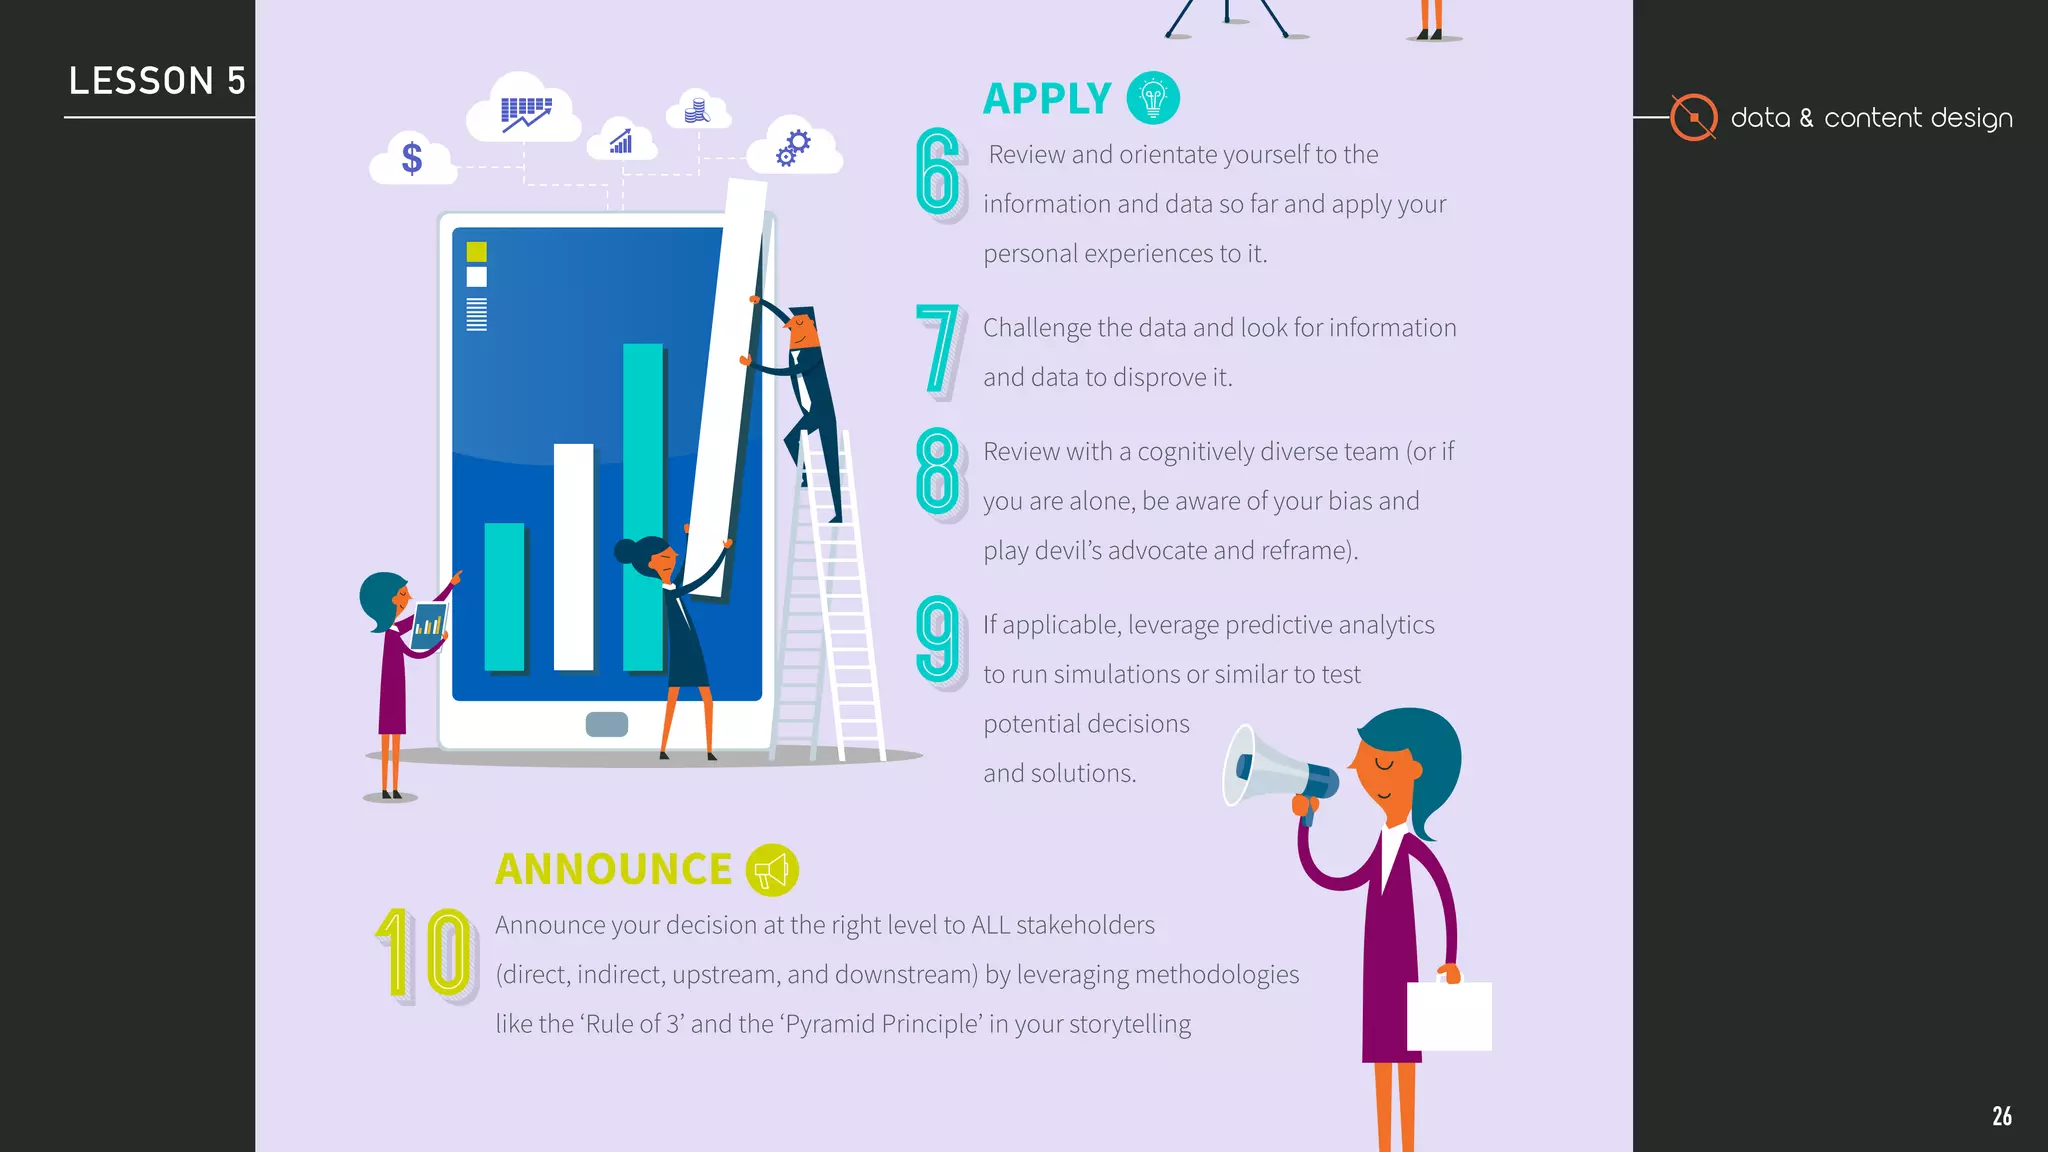
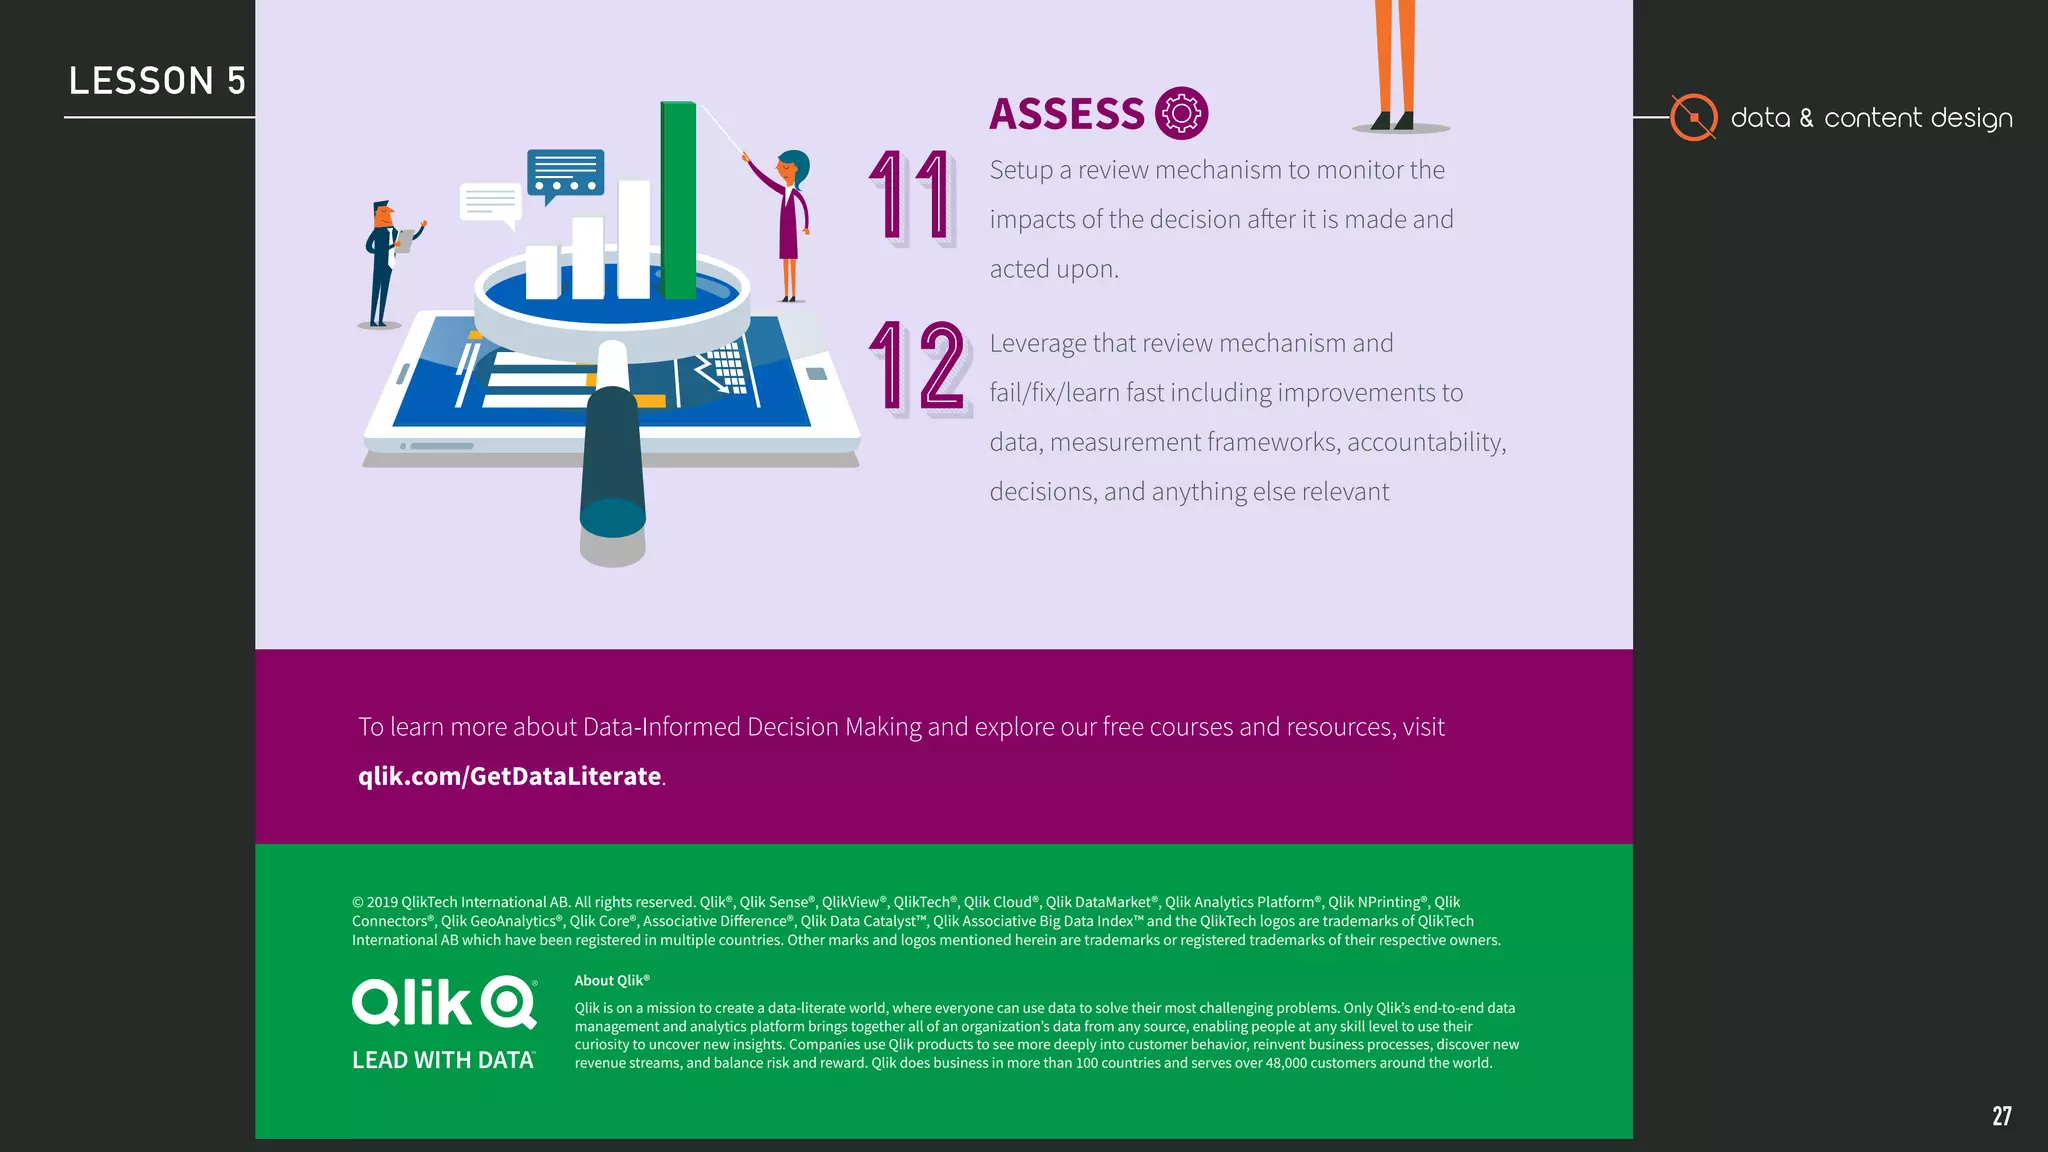

This document outlines the process of data-informed decision making. It discusses acquiring relevant data from internal and external sources, analyzing the data to find patterns and relationships, applying personal expertise when interpreting the data, announcing and implementing decisions to stakeholders, and assessing the outcomes of decisions to continually improve the process. The goal is to formulate questions, leverage different types of data analysis, make evidence-based decisions, and monitor their impacts over time.