Introduction
• These area body of techniques
which rely primarily on the statistical
properties of the data, either in
isolated single series or in groups of
series, and do not exploit our
understanding of the working of the
economy at all.
3.
• The objectiveis not to build models
which are a good representation of
the economy with all its complex
interconnections, but rather to build
simple models which capture the
time series behaviour of the data and
may be used to provide an adequate
basis for forecasting alone.
4.
• See `AppliedEconomic Forecasting
Techniques' ed S G Hall, Simon and
Schuster, 1994.
5.
Some basic concepts
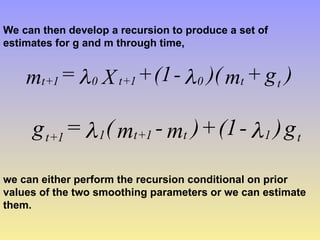
•Two basic types of time series
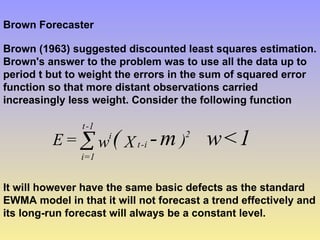
models exist,
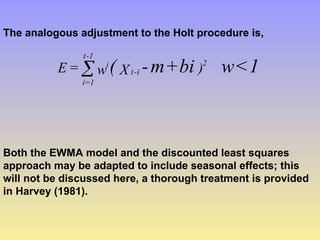
• these are autoregressive and moving
average models.
The basic autoregressivemodel for a series X is,
X
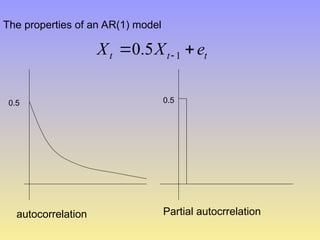
...
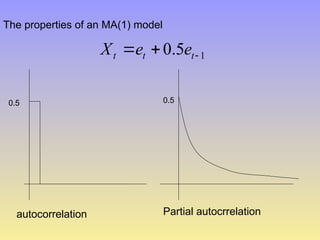
X
+
X
=
X
(L)
and
process
error
noise
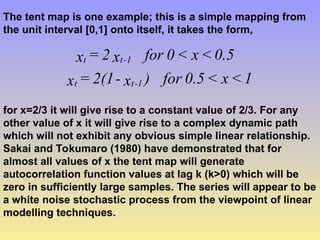
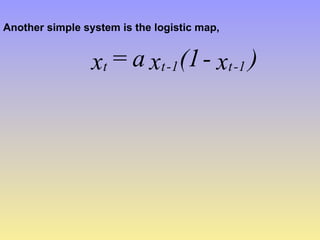
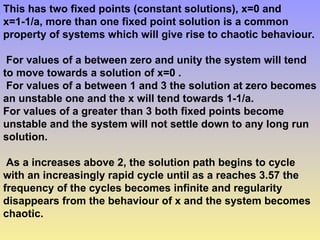
white
a
is
where
+
X
(L)
=
X
n
-
t
n
2
-
t
2
1
-
t
1
1
-
t
t
1
-
t
t
This would be referred to as an nth order autoregressive
process, or AR(n).
8.
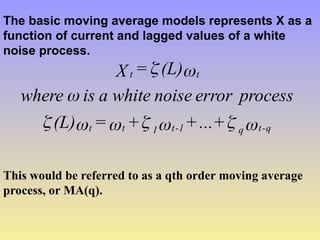
The basic movingaverage models represents X as a
function of current and lagged values of a white
noise process.
q
-
t
q
1
-
t
1
t
t
t
t
+
...
+
+
=
(L)
process
error
noise
white
a
is
where
(L)
=
X
This would be referred to as a qth order moving average
process, or MA(q).
9.
ARMA models
• Amixture of these two types of
model would be referred to as an
autoregressive moving average
model (ARMA)n,q, where n is the
order of the autoregressive part and
q is the order of the moving average
term.
10.
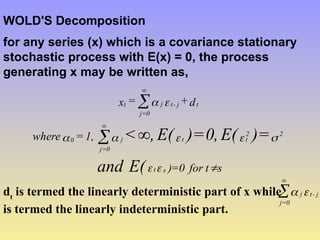
WOLD'S Decomposition
for anyseries (x) which is a covariance stationary
stochastic process with E(x) = 0, the process
generating x may be written as,
s
t
for
0
=
)
1,
=
where
d
+
=
x
s
t
2
2
t
t
j
j=0
0
t
j
-
t
j
j=0
t
E(
and
)=
E(
0,
)=
E(
,
<
dt
is termed the linearly deterministic part of x while
is termed the linearly indeterministic part.
j
-
t
j
0
=
j
11.
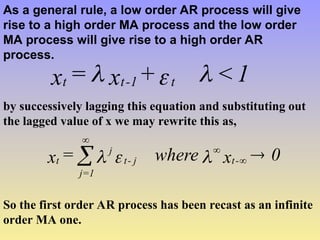
As a generalrule, a low order AR process will give
rise to a high order MA process and the low order
MA process will give rise to a high order AR
process.
1
<
+
x
=
x t
1
-
t
t
by successively lagging this equation and substituting out
the lagged value of x we may rewrite this as,
0
x
where
=
x -
t
j
-
t
j
1
=
j
t
So the first order AR process has been recast as an infinite
order MA one.
12.
The Correlogram andpartial
autocorellation function
• Two important tools for diagnosing the time
series properties of a series
13.
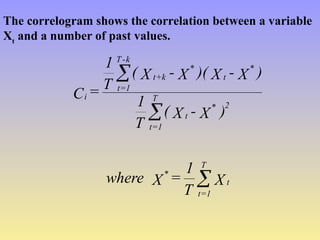
The correlogram showsthe correlation between a variable
Xt
and a number of past values.
X
T
1
=
X
where
)
X
-
X
(
T
1
)
X
-
X
)(
X
-
X
(
T
1
=
C
t
T
1
=
t
*
2
*
t
T
1
=
t
*
t
*
k
+
t
k
-
T
1
=
t
i
14.
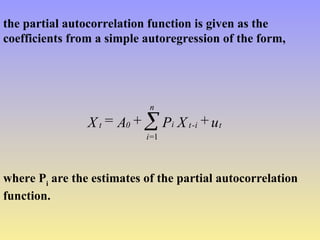
the partial autocorrelationfunction is given as the
coefficients from a simple autoregression of the form,
u
+
X
P
+
A
=
X t
i
-
t
i
n
=
i
0
t
1
where Pi
are the estimates of the partial autocorrelation
function.
15.
Stationarity
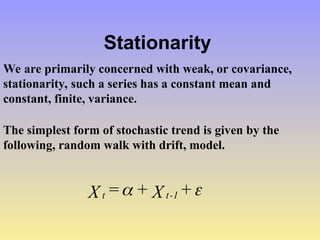
We are primarilyconcerned with weak, or covariance,
stationarity, such a series has a constant mean and
constant, finite, variance.
The simplest form of stochastic trend is given by the
following, random walk with drift, model.
+
X
+
=
X 1
-
t
t
16.
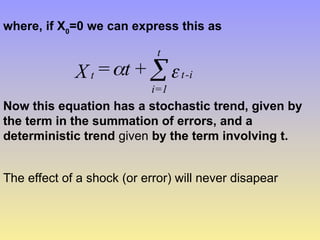
where, if X0
=0we can express this as
i
-
t
t
1
=
i
t +
t
=
X
Now this equation has a stochastic trend, given by
the term in the summation of errors, and a
deterministic trend given by the term involving t.
The effect of a shock (or error) will never disapear
17.
1
+
X
+
=
X 1
-
t
t
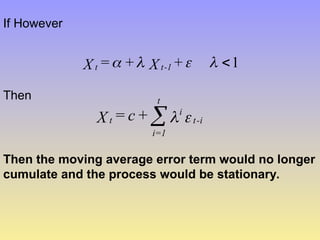
IfHowever
Then
i
-
t
i
t
=1
i
t +
c
=
X
Then the moving average error term would no longer
cumulate and the process would be stationary.
18.
Integration
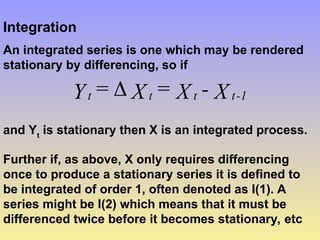
An integrated seriesis one which may be rendered
stationary by differencing, so if
X
-
X
=
X
=
Y 1
-
t
t
t
t
and Yt
is stationary then X is an integrated process.
Further if, as above, X only requires differencing
once to produce a stationary series it is defined to
be integrated of order 1, often denoted as I(1). A
series might be I(2) which means that it must be
differenced twice before it becomes stationary, etc
19.
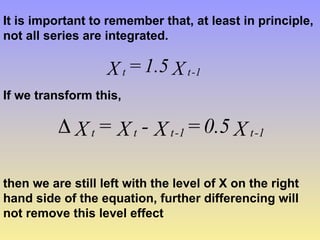
It is importantto remember that, at least in principle,
not all series are integrated.
X
1.5
=
X 1
-
t
t
If we transform this,
X
0.5
=
X
-
X
=
X 1
-
t
1
-
t
t
t
then we are still left with the level of X on the right
hand side of the equation, further differencing will
not remove this level effect
20.
`Ad Hoc' forecastingprocedures
• a broadly sensible approach to forecasting but
they are not the result of a particular economic or
statistical view about the way the data was
generated.
21.
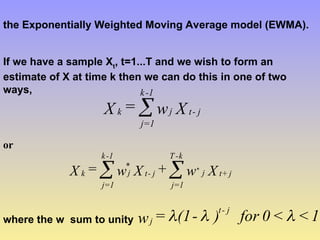
the Exponentially WeightedMoving Average model (EWMA).
If we have a sample Xt
, t=1...T and we wish to form an
estimate of X at time k then we can do this in one of two
ways,
X
w
=
X j
-
t
j
1
-
k
1
=
j
k
or
X
w
+
X
w
=
X j
+
t
j
k
-
T
j=1
j
-
t
*
j
1
-
k
j=1
k
*
where the w sum to unity 1
<
<
0
for
)
-
(1
=
w
j
-
t
j
22.
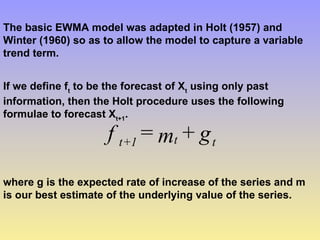
The basic EWMAmodel was adapted in Holt (1957) and
Winter (1960) so as to allow the model to capture a variable
trend term.
If we define ft
to be the forecast of Xt
using only past
information, then the Holt procedure uses the following
formulae to forecast Xt+1
.
g
+
m
=
f t
t
1
+
t
where g is the expected rate of increase of the series and m
is our best estimate of the underlying value of the series.
23.
We can thendevelop a recursion to produce a set of
estimates for g and m through time,
)
g
+
m
)(
-
(1
+
X
=
m t
t
0
1
+
t
0
1
+
t
g
)
-
(1
+
)
m
-
m
(
=
g t
1
t
1
+
t
1
1
+
t
we can either perform the recursion conditional on prior
values of the two smoothing parameters or we can estimate
them.
24.
Brown Forecaster
Brown (1963)suggested discounted least squares estimation.
Brown's answer to the problem was to use all the data up to
period t but to weight the errors in the sum of squared error
function so that more distant observations carried
increasingly less weight. Consider the following function
1
<
w
m
-
( )
X
w
=
E 2
i
-
t
i
1
-
t
1
=
i
It will however have the same basic defects as the standard
EWMA model in that it will not forecast a trend effectively and
its long-run forecast will always be a constant level.
25.
The analogous adjustmentto the Holt procedure is,
1
<
w
bi
+
m
-
( )
X
w
=
E 2
i
-
t
i
1
-
t
1
=
i
Both the EWMA model and the discounted least squares
approach may be adapted to include seasonal effects; this
will not be discussed here, a thorough treatment is provided
in Harvey (1981).
26.
The Box-Jenkins approach
•Box and Jenkins (1976) proposed a modelling
strategy for pure time series forecasting
• The Box-Jenkins procedure may be seen as one
of the early attempts to confront the problem of
non-stationary data.
• The Box Jenkins modelling procedure consists of
three stages; identification, estimation and
diagnostic checking.
27.
• At theidentification stage a set of tools are
provided to help identify a possible ARIMA
model, which may be an adequate description of
the data.
• Estimation is simply the process of estimating
this model.
• Diagnostic checking is the process of checking
the adequacy of this model against a range of
criteria and possibly returning to the
identification stage to respecify the model.
• The distinguishing stage of this methodology is
identification.
28.
• This approachtries to identify an appropriate
ARIMA specification. It is not generally possible
to specify a high order ARIMA model and then
proceed to simplify it as such a model will not be
identified and so can not be estimated.
• The first stage of the identification process is to
determine the order of differencing which is
needed to produce a stationary data series.
• The next stage of the identification process is to
assess the appropriate ARMA specification of the
stationary series.
29.
The properties ofan AR(1) model
t
t
t e
X
X
1
5
.
0
0.5
autocorrelation
0.5
Partial autocrrelation
30.
The properties ofan MA(1) model
1
5
.
0
t
t
t e
e
X
0.5
autocorrelation
0.5
Partial autocrrelation
31.
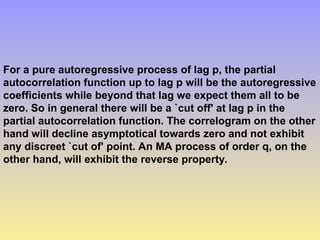
For a pureautoregressive process of lag p, the partial
autocorrelation function up to lag p will be the autoregressive
coefficients while beyond that lag we expect them all to be
zero. So in general there will be a `cut off' at lag p in the
partial autocorrelation function. The correlogram on the other
hand will decline asymptotical towards zero and not exhibit
any discreet `cut of' point. An MA process of order q, on the
other hand, will exhibit the reverse property.
32.
The `Structural TimeSeries' forecasting model
This goes back to the early work of Harrison and Stephens
(1971, 1976), but the main proponent of its use in economics
and econometrics is Harvey (see among many other
references, 1981, 1989).
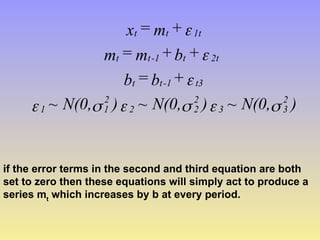
This model may be thought of as a generalisation of the local
trend models of Holt, Winter and Brown discussed above. It
has a more clearly articulated statistical framework than the
earlier models and the notion of an underlying trend can be
more easily made precise within this framework.
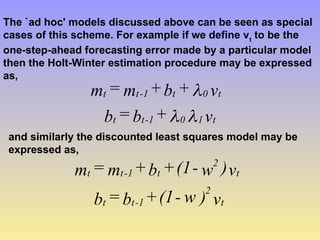
The `ad hoc'models discussed above can be seen as special
cases of this scheme. For example if we define vt
to be the
one-step-ahead forecasting error made by a particular model
then the Holt-Winter estimation procedure may be expressed
as,
v
+
b
=
b
v
+
b
+
m
=
m
t
1
0
1
-
t
t
t
0
t
1
-
t
t
and similarly the discounted least squares model may be
expressed as,
v
)
w
-
(1
+
b
=
b
v
)
w
-
(1
+
b
+
m
=
m
t
2
1
-
t
t
t
2
t
1
-
t
t
35.
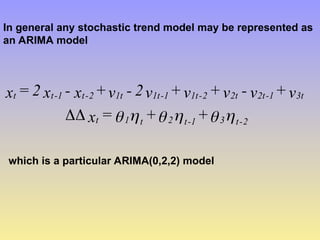
In general anystochastic trend model may be represented as
an ARIMA model
2
-
t
3
1
-
t
2
t
1
t
3t
1
-
2t
2t
2
-
1t
1
-
1t
1t
2
-
t
1
-
t
t
+
+
=
x
v
+
v
-
v
+
v
+
v
2
-
v
+
x
-
x
2
=
x
which is a particular ARIMA(0,2,2) model
36.
Multivariate time seriesforecasting
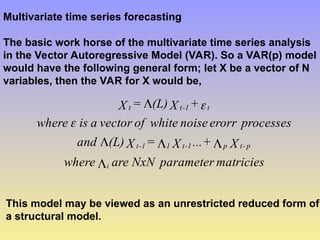
The basic work horse of the multivariate time series analysis
in the Vector Autoregressive Model (VAR). So a VAR(p) model
would have the following general form; let X be a vector of N
variables, then the VAR for X would be,
matricies
parameter
NxN
are
where
X
+
...
X
=
X
(L)
and
processes
erorr
noise
white
of
vector
a
is
where
+
X
(L)
=
X
i
p
-
t
p
1
-
t
1
1
-
t
t
1
-
t
t
This model may be viewed as an unrestricted reduced form of
a structural model.
37.
Non-linearities and forecasting
•Most of the discussion has been predicated on the
assumption of linearity. When this assumption is false
many of the basic results still hold.
• The Wold representation theorem, for example, still
holds.
• We can also think of the `ad hoc' local trend models as
being local approximations to the true process.
• So the preceding analysis is not without value even in
the general non-linear case.
38.
But If thetrue data generating process is non-linear then, in
general, any linear forecasting technique will be dominated
by the appropriate non-linear model.
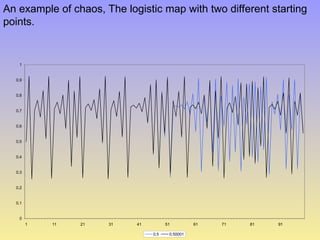
Chaos
A chaotic system is simply a non-linear dynamic system,
where, either for all parameter values or for a range of
parameter values, the dynamic behaviour of the system is
qualitatively different from a linear system.
A property of such systems is that even if the true chaotic
system is completely deterministic with no measurement
error, if we try to model it with standard linear techniques
then we will appear to find a linear but stochastic process.
39.
This has raisedthe fundamental question of whether we are
really dealing with a non-linear but deterministic world, rather
than the traditional assumption of a linear stochastic one.
40.
The tent mapis one example; this is a simple mapping from
the unit interval [0,1] onto itself, it takes the form,
1
<
x
<
0.5
for
)
x
-
2(1
=
x
0.5
<
x
<
0
for
x
2
=
x
1
-
t
t
1
-
t
t
for x=2/3 it will give rise to a constant value of 2/3. For any
other value of x it will give rise to a complex dynamic path
which will not exhibit any obvious simple linear relationship.
Sakai and Tokumaro (1980) have demonstrated that for
almost all values of x the tent map will generate
autocorrelation function values at lag k (k>0) which will be
zero in sufficiently large samples. The series will appear to be
a white noise stochastic process from the viewpoint of linear
modelling techniques.
This has twofixed points (constant solutions), x=0 and
x=1-1/a, more than one fixed point solution is a common
property of systems which will give rise to chaotic behaviour.
For values of a between zero and unity the system will tend
to move towards a solution of x=0 .
For values of a between 1 and 3 the solution at zero becomes
an unstable one and the x will tend towards 1-1/a.
For values of a greater than 3 both fixed points become
unstable and the system will not settle down to any long run
solution.
As a increases above 2, the solution path begins to cycle
with an increasingly rapid cycle until as a reaches 3.57 the
frequency of the cycles becomes infinite and regularity
disappears from the behaviour of x and the system becomes
chaotic.
Neural networks
Over thelast decade a number of techniques have been
developed which allow the estimation of general non-linear
models without specifying an exact functional form. One of
the most popular of these is neural networks.
White (1989) has done considerable work recently
emphasising the relationship between traditional classical
statistics and neural network theory.
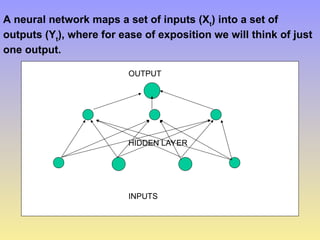
45.
A neural networkmaps a set of inputs (Xt
) into a set of
outputs (Yt
), where for ease of exposition we will think of just
one output.
INPUTS
HIDDEN LAYER
OUTPUT
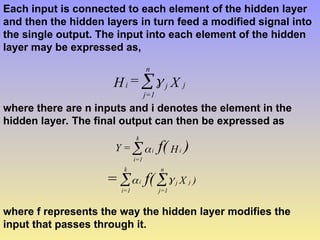
46.
Each input isconnected to each element of the hidden layer
and then the hidden layers in turn feed a modified signal into
the single output. The input into each element of the hidden
layer may be expressed as,
X
=
H j
j
n
1
=
j
i
where there are n inputs and i denotes the element in the
hidden layer. The final output can then be expressed as
)
X
H
=
Y
j
j
n
j=1
i
k
=1
i
i
i
k
=1
i
f(
=
)
f(
where f represents the way the hidden layer modifies the
input that passes through it.
47.
if f weresimply a linear function the neural network
would simply be a reparameterisation of a linear
equation
Hornik et al (1989) have demonstrated that, with a sufficient
number of hidden layers, a neural network can approximate
any given functional form to any desired accuracy level.
48.
selecting the parametersis termed `learning'. It is usually
done using a variant on a technique known as `back
propagation'.
This is related to standard least squares estimation and
White(1989) has shown that the two are closely related,
although back propagation does not make efficient use of the
data.
49.
problems
If the datareally does have a stochastic element this will
mean that the network can achieve a spuriously good fit
Given the extreme generality of the functional form large data
sets are required for the estimation exercise.
Work by White (1989) has emphasised that traditional
statistical tools can be brought to bear.