This Arena tutorial aims to provide beginners with a guide to get started using Arena simulation software. It discusses installing Arena, describes the overall features and interface of Arena including the model window, modules, and project bar. It then provides a step-by-step example of building a simulation model of a single server queueing system, defining the necessary data and flowchart modules, setting the run conditions, running the simulation, and reviewing the output reports.
Introduction to Smart Manufacturing & Manufacturing as a Service presentation.
Three important concepts are presented: Cloud computing, internet of things and advanced data analytics.
Design Faster and Lighter:Applications of Topology Optimization in Additive M...Altair
The use of 3D printing makes it possible to produce very complex structures, which were hitherto either impossible to make or required tremendous effort and significant cost using traditional production methods. To fully exploit the potential of 3D printing, it is important to optimize component designs for the freedom of the additive manufacturing process in the earliest concept development stages.
MBA Project report on Just In Time Management - Final Report
This report provides an analysis and evaluation of the Just-In-Time system, the advantages and disadvantages of the system and how it would benefit AG & Z. The Just-In-Time (JIT) system is a process where goods are ordered as required, as opposed to the currently used batch processing system where goods are made in bulk and stored in warehouses until sold. The Just-In-Time system was initially developed to not only cut down the amount of waste produced by other systems, which was seen as incurring unnecessary costs rather than adding value to the company, but to also meet customer demands with minimum delays. It has been found that when implemented correctly the JIT system can benefit the company in numerous ways.
BAHIR DAR UNIVERSITYBAHIR DAR INSTITUTE OF TECHNOLOGY (BiT)FACULTY OF MECHANICAL AND INDUSTRIAL ENGINEERING Rapid Prototyping & Reverse Engineering [MEng6123]
Post processing of AM parts
Post processing of AM parts Preparation for use as a Pattern Often
Guidelines for process selection
Guidelines for process selection Approaches to Selection
Guidelines for process selection Selection Example
Guidelines for process selection - Selection Example
In this example, it is decided to allow customization of certain features.
Only standard 12 mm diameter x 100 mm length bolts will be used for the inner bore, therefore, these dimensions will be constrained.
Customers will be allowed to customize all other features of the caster wheel
within allowable ranges for this model wheel, as displayed in the table below.
Guidelines for process selection - Selection Example
Guidelines for process selection Selection Example
In this example, we examine two weighting scenarios (relative importance ratings).
Scenario 2
All selection attributes were equally weighted.
Guidelines for process selection Selection Example
Course Objectives:
Students undergoing this course would
Understand different methods of 3D Printing.
Gain knowledge about simulation of FDM process
Estimate time and material required for manufacturing a 3D component
Course Outcomes:
Upon the successful completion of course, students will be able to
Explain different types of 3d Printing techniques
Identify parameters for powder binding and jetting process
Determine effective use of ABS material for 3D Printing
Apply principles of mathematics to evaluate the volume of material require.
Module 1:
Introduction to Prototyping, Working of 3D Printer, Types of 3D printing Machines:
Exp 1: Modelling of Engineering component and conversion of STL format.
Exp 2: Slicing of STL file and study of effect of process parameter like layer thickness,
Orientation and infill on build time using software.
Exercise 1 : Component-1
Exercise 2 : Component-2
Module 2:
Exp 1 : 3D Printing of modeled component by varying layer thickness.
Exp 2 : 3D Printing of modeled component by varying orientation.
Exp 3: 3D Printing of modeled component by varying infill.
Module 3:
Study on effect of different materials like ABS, PLA, Resin etc, and dimensional accuracy.
Module 4:
Identifying the defects in 3D Printed components.
Module 5
Exp1: Modelling of component using 3D Scanner of real life object of unknown dimension
in reverse engineering.
Exp 2: 3D Printing of above modeled component.
Purpose Statement:
To provide an overview of Design for Manufacturing and Assembly (DFMA) techniques, which are used to minimize product cost through design and process improvements.
Digital Manufacturing : Computer Integrated Manufacturing
The use of an integrated, Computer-based system Comprised of simulation, Three-dimensional (3D) visualization, Analytics and various collaboration tools To create product and manufacturing process simultaneously.
Design for Assembly (DFA) is a vital component of concurrent engineering – the multidisciplinary approach to product development. You might think it strange to begin by thinking about the assembly before you have designed all the components, but you can often eliminate many parts at the conceptual stage, and save yourself a lot of trouble.
This slideshow provides an introduction to the rules that are used in industry to produce affordable, reliable products. It includes the in-depth analysis of two real-world products subjected to a "product autopsy", detailed in photographs, plus tutor notes and recommendations for additional activities including an assembly game.
+++
Thanks for all the interest shown in this presentation... visit Capacify and leave me a message if you have any questions or comments. Also let me know if you'd like to have me as a guest speaker: the in-class 'ease of assembly game' is always fun.
Automation in Manufacturing (Unit-1) by Varun Pratap Singh.pdfVarun Pratap Singh
Unit 1: Production systems
Categories of manufacturing systems, manufacturing support systems, automation in production systems, automated manufacturing systems, opportunities for automation and computerization, types of automation, computerized manufacturing support systems, reasons for automating, automation principles and strategies, the USA principle, ten strategies for automation, automation migration strategy.
Lab #1 Develop System Administration Procedures for Windows 8.1 Sec.docxsleeperfindley
Lab #1: Develop System Administration Procedures for Windows 8.1 Security Configuration
Purpose:
Develop systems administration procedures to implement systems security configuration guidance and best practices.
Objectives
1.
Develop a Windows
system restore point
systems administration procedure to implement an industry recognized best practice for maintaining system integrity and availability.
2.
Develop a Windows system administration procedure to manage
programs and features
.
3.
Develop a
systems administration
procedure to implement configuration rules from
systems security technical
guidance
issued by a vendor or government organization.
Overview
In this lab, our focus is upon developing a set of procedures which can be incorporated into an organization’s security implementation guidance and documentation. For each procedure, you will develop, test, and document the steps required to implement the selected best practices and security configuration guidance (as provided in the lab instructions and notes). You will write three separate procedures for this lab:
(a)
Creating, Using, Removing System Restore Points for Windows 8.1
(b)
Managing Windows 8.1 Programs and Features
(c)
Implementing Security Configuration Rules for Windows 8.1
Each procedure will have the following major sections (see Figure 1):
·
Title:
·
Operating Environment:
·
Description:
·
Notes, Warnings, & Restrictions:
·
Resources (Further Reading):
·
Procedures:
Some procedures will contain a large number of steps. To make the procedures easier to read, you should divide your procedures into groups of related steps. Place a group heading (e.g.
Create System Restore Points
) at the beginning of each group. Each group heading should be followed by a brief paragraph that explains the purpose of the group (e.g. This group (or “section”) contains step by step instructions for creating System Restore Points using the “System Restore ” tool….)
Title:
Operating Environment:
1.
Hardware
2.
Software
Description:
Notes, Warnings, & Restrictions:
Resources (Further Reading):
1.
2.
3.
Procedures:
[Group Heading]
Brief introduction paragraph for this group of steps
1.
2.
3.
[Group Heading]
Brief introduction paragraph for this group of steps
1.
2.
3.
Figure 1. Required Outline for System Administration Procedures
Instructions
Part (a): Implementing System Restore Points
1.
Investigate the
System Restore
tool (used to manage system restore points). To access the tool, open the
System
tool from Control Panel (Control Panel > System and Security > System). Then, click on System Protection (left menu).
2.
Identify appropriate sources of information (e.g. Windows Help, Microsoft Technet, etc.) for instructions for using the Windows 8.1 System Restore Point capability. Using those sources, research the procedures required to perform the following tasks:
a.
Create a system restore point for a Windows 8.1 system
b.
Use a system r.
IBM Cognos 10 Framework Manager Metadata Modeling: Tips and TricksSenturus
Senturus shares insights and tips on IBM Cognos 10 Framework Manager Metadata Modeling. View the video recording and download this deck: http://www.senturus.com/resources/cognos-framework-manager-metadata-modeling-tips-tricks/.
Topics Include:
• Use determinants, parameter maps and query macros to implement row level security
• Understand the use of determinants and their importance
• Enhance your metadata by leveraging parameter maps and query macros
See a live demonstration of implementing row-level security based on user attributes, dimensional modeling of relational query subjects and use of Model Design Accelerator.
Senturus, a business analytics consulting firm, has a resource library with hundreds of free recorded webinars, trainings, demos and unbiased product reviews. Take a look and share them with your colleagues and friends: http://www.senturus.com/resources/.
This module is used to create and view Tickets in both frontend and backend and also have Posting Comments. Creating quick response option reduces time required to answer tickets.
IBM developerWorks Cloud Trial: Creating an Application Workload service: How to complete the wizard for provisioning an Application Workload service, how to monitor the provisioning of the service, how to log into the provisioned service, how to customize it.
Overview of the fundamental roles in Hydropower generation and the components involved in wider Electrical Engineering.
This paper presents the design and construction of hydroelectric dams from the hydrologist’s survey of the valley before construction, all aspects and involved disciplines, fluid dynamics, structural engineering, generation and mains frequency regulation to the very transmission of power through the network in the United Kingdom.
Author: Robbie Edward Sayers
Collaborators and co editors: Charlie Sims and Connor Healey.
(C) 2024 Robbie E. Sayers
Welcome to WIPAC Monthly the magazine brought to you by the LinkedIn Group Water Industry Process Automation & Control.
In this month's edition, along with this month's industry news to celebrate the 13 years since the group was created we have articles including
A case study of the used of Advanced Process Control at the Wastewater Treatment works at Lleida in Spain
A look back on an article on smart wastewater networks in order to see how the industry has measured up in the interim around the adoption of Digital Transformation in the Water Industry.
Student information management system project report ii.pdfKamal Acharya
Our project explains about the student management. This project mainly explains the various actions related to student details. This project shows some ease in adding, editing and deleting the student details. It also provides a less time consuming process for viewing, adding, editing and deleting the marks of the students.
Hybrid optimization of pumped hydro system and solar- Engr. Abdul-Azeez.pdffxintegritypublishin
Advancements in technology unveil a myriad of electrical and electronic breakthroughs geared towards efficiently harnessing limited resources to meet human energy demands. The optimization of hybrid solar PV panels and pumped hydro energy supply systems plays a pivotal role in utilizing natural resources effectively. This initiative not only benefits humanity but also fosters environmental sustainability. The study investigated the design optimization of these hybrid systems, focusing on understanding solar radiation patterns, identifying geographical influences on solar radiation, formulating a mathematical model for system optimization, and determining the optimal configuration of PV panels and pumped hydro storage. Through a comparative analysis approach and eight weeks of data collection, the study addressed key research questions related to solar radiation patterns and optimal system design. The findings highlighted regions with heightened solar radiation levels, showcasing substantial potential for power generation and emphasizing the system's efficiency. Optimizing system design significantly boosted power generation, promoted renewable energy utilization, and enhanced energy storage capacity. The study underscored the benefits of optimizing hybrid solar PV panels and pumped hydro energy supply systems for sustainable energy usage. Optimizing the design of solar PV panels and pumped hydro energy supply systems as examined across diverse climatic conditions in a developing country, not only enhances power generation but also improves the integration of renewable energy sources and boosts energy storage capacities, particularly beneficial for less economically prosperous regions. Additionally, the study provides valuable insights for advancing energy research in economically viable areas. Recommendations included conducting site-specific assessments, utilizing advanced modeling tools, implementing regular maintenance protocols, and enhancing communication among system components.
Hierarchical Digital Twin of a Naval Power SystemKerry Sado
A hierarchical digital twin of a Naval DC power system has been developed and experimentally verified. Similar to other state-of-the-art digital twins, this technology creates a digital replica of the physical system executed in real-time or faster, which can modify hardware controls. However, its advantage stems from distributing computational efforts by utilizing a hierarchical structure composed of lower-level digital twin blocks and a higher-level system digital twin. Each digital twin block is associated with a physical subsystem of the hardware and communicates with a singular system digital twin, which creates a system-level response. By extracting information from each level of the hierarchy, power system controls of the hardware were reconfigured autonomously. This hierarchical digital twin development offers several advantages over other digital twins, particularly in the field of naval power systems. The hierarchical structure allows for greater computational efficiency and scalability while the ability to autonomously reconfigure hardware controls offers increased flexibility and responsiveness. The hierarchical decomposition and models utilized were well aligned with the physical twin, as indicated by the maximum deviations between the developed digital twin hierarchy and the hardware.
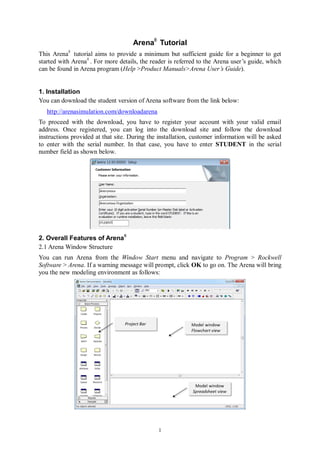
1. 1
Arena®
Tutorial
This Arena®
tutorial aims to provide a minimum but sufficient guide for a beginner to get
started with Arena®
. For more details, the reader is referred to the Arena user’s guide, which
can be found in Arena program (Help >Product Manuals>Arena User’s Guide).
1. Installation
You can download the student version of Arena software from the link below:
http://arenasimulation.com/downloadarena
To proceed with the download, you have to register your account with your valid email
address. Once registered, you can log into the download site and follow the download
instructions provided at that site. During the installation, customer information will be asked
to enter with the serial number. In that case, you have to enter STUDENT in the serial
number field as shown below.
2. Overall Features of Arena®
2.1 Arena Window Structure
You can run Arena from the Window Start menu and navigate to Program > Rockwell
Software > Arena. If a warning message will prompt, click OK to go on. The Arena will bring
you the new modeling environment as follows:
2. 2
In the Arena window, you will face with the three regions where you’ll work for building a
simulation model.
1) Model Window (Flowchart view)
The flowchart view is a canvas to draw the process flow of entities using modules
from the project bar. It can also have the animation and other drawing elements
2) Model Window (Spreadsheet view)
The spreadsheet view displays the properties of selected module in the flowchart
view or the project bar.
3) Project bar
The project bar holds some panels that provide the various objects so as to help you
build the simulation model and reports
Basic Process panel: holds modeling commands called modules that are
used to model your system.
Reports panel: provides a road map to the results of a simulation run
Navigate panel: allows to display different view of a model
The Arena also provides additional panels that provide various types of objects such
as advanced process, advanced transfer panels and so on. In order to use these panels,
you need to attach a panel located in Arena’s template folder by selecting a panel file
(ends with “tpo” extension) from File > Template Panel > Attach. In reverse, if you
don’t need it any more, you can detach from the project bar from File > Template
Panel > Detach.
2.2 Modules
In Arena, modules are basic building blocks (or objects) that consist of Arena models. There
are two types of modules: flowchart modules and data modules. All the modules can be found
in the project bar.
1) Flowchart Modules:
The flowchart modules are used to describe the flow of entities and placed in the
flowchart view of the model window.
In the Basic Process panel, you can find the following flowchart modules:
Name Description
Create Entities enter the simulation here.
Dispose Entities are removed from the simulation here.
Process
An activity, usually performed by one or more resources and requiring
some time to complete.
Decide A branch in entity flow. Only one branch is taken.
Batch Collect a number of entities before they can continue processing
Separate
Duplicate entities for concurrent or parallel processing, or separating a
previously established batch of entities
Assign
Change the value of some parameter (during the simulation), such as
the entity’s type or model variable.
Record Collect a statistic, such as an entity counter or cycle time.
3. 3
2) Data Modules:
The data modules are used to define parameters associated with elements of the
model, such as resources, entities, queues and so on. The data module can be
accessed from the project bar by double-clicking a module and it will be shown on
the spreadsheet view of the model window.
In the Basic Process panel, you can find the following data modules:
Name Description
Entity
Define the various entity types and their initial picture values in a
simulation. Costing information is also defined for the entity.
Resource
Define the resources in the system including costing information
and resource availability.
Queue Define the queues in the system
Schedule
With the Resource module, define an operating schedule for a
resource or with the Create module, define an arrival schedule.
Set
Define various types of sets, including resource, counter, tally, and
entity type and entity picture.
Attribute
Define the entity’s attributes which consist of type, dimensions and
initial value.
Variable Define the variables used through the modules in the model.
3. Building Models with Arena
Throughout this section, the process of building an Arena model of a single server system
will be explained with the details.
3.1 Reference Model (Single Server System)
1) Entity: Job arrives every ta minutes (ta ~ Exp(5))
2) Active Resource: Machine
3) Passive Resource: Buffer (unlimited)
4) Activity: service time ts ~ triangular1(1, 3, 6)
3.2 Defining each Data Module
Before modeling the flow of the entity, the entities and resources are defined using Entity and
Resource data modules.
1) Entity module:
In Basic Process panel of the project bar, click the Entity module. Double-click the
spreadsheet view to define a new entity. Enter the entity type with “Job” and change
the initial picture to “Picture.Box” which will be used to animate the entity flow
during the simulation.
4. 4
2) Resource module:
In Basic Process panel of the project bar, click the Resource module. Double-click
the spreadsheet view to define a new resource. Enter the name with “Machine”.
3.3 Constructing a Flowchart Model
In Arena, the flowchart represents the flow of entity in the system. In the single server system,
the entity, a job, 1) enters the system and waits in the queue. 2) The job will be processed by
the machine when the machine becomes idle. 3) The processed job will leave the system.
1) Create jobs
The starting point of the flowchart is always the Create module. Drag the Create
module from the Basic Process panel into the flowchart view of the model window.
2) Process jobs
Drag the Process module from the Basic Process panel into the flowchart view,
placing it to the right of the “Create 1” module. If the “Create 1” module is selected
before dragging, the connection will be automatically established from “Create 1” to
Process module. For this, check Object > Auto-Connect menu is activated.
If the connection is not made, click the Object > Connect menu or the Connect
toolbar button ( ) to draw a connection manually. Start the connection by clicking
the exit point (►) of the Create module, and then click the entry point (■) of the
Process module to complete the connection.
3) Dispose jobs
Select the “Process 1” module and Drag the Dispose module from the Basic Process
panel into the flowchart view, placing it to the right of the “Process 1” module.
5. 5
3.4 Defining each Flowchart Module
1) Create Module
Double-click the “Create 1” module to open a dialog box so as to edit its properties.
(1) Type “Create a job” in the Name field.
(2) Select or type “Job” to name the entities in the Entity Type field.
(3) Type “5” in the Value field of the Time Between Arrivals section and select
“Minutes” in the Units field
(4) Click OK to close the dialog box.
2) Process Module
Next is the “Process 1” module. In this module, the behavior or flow of an entity at
buffer and machine will be defined. The newly created job waits at the buffer until the
resource (machine) becomes idle. If there is an idle resource, the entity seizes the
resource and holds for a time delay (representing resource’s processing of the entity),
and then it releases the resource for next processing of the entity.
Double-click the “Process 1” module to open a dialog box so as to edit its properties.
(1) Type “Process a Job” in the Name field.
(2) Select “Seize Delay Release” in the Action field of the Logic section.
Action field defines the behavior of an entity in this module.
- Seize Delay Release: the arriving entity seizes some number of units of a
resource, then is delayed for a time, and then releases the resource
- Delay: the arriving entity is simply delayed for some time and no resource is
required
- Seize Delay: seizes the resource and then is delayed, but does not release the
resource
- Delay Release: assuming that the resource is seized previously, the entity is
delayed and then the resource is released
(3) Click “Add...” button in the Resources filed of the Logic section to add a resource
for this module. The dialog box for Resources will be opened. Select “Machine”
in the Resource Name field. Click OK button to close the Resources dialog box.
Resources field defines the resources to be seized or released. It can be a
Resource or Set (a set of resources). The Quantity field indicates the number of
resources to be seized or released.
6. 6
(4) To specify the time delay (service time) that follows the triangular distribution of
(1, 3, 6), select “Triangular” in the Delay Type field and type 1, 3 and 6 in
Minimum, Value (Most Likely), and Maximum fields, respectively. Also select
“Minutes” in the Units field.
The time delay for the Process module can be Constant, Normal, Triangular,
Uniform, and Expression.
3) Dispose Module
This module represents the ending point of the entity’s flow in the model. Nothing
special is mentioned here.
4. Running Simulation with Arena
4.1 Setting the run conditions
Prior to run the model, you need to specify the run conditions including project information
and the length of the simulation run. This is done in Run Setup dialog box from Run > Setup
menu.
1) Project Parameters
In Run Setup dialog box, select Project Parameters tab to specify the general project
information with Project Title, Analyst Name, and Project Description. You can also
specify for which categories you would like to collect statistics during the simulation
in the Statistics Collection field. Here, check the boxes of Queues, Entities, Processes,
and Resources of the Statistics Collection field.
7. 7
2) Replication Parameters
In Run Setup dialog box, select Replication Parameters tab to specify how many
times the simulation runs and how long each simulation runs.
- Number of Replications: defines numbers of simulation runs to execute. Here,
type 1.
- Replication Length: defines the length of a single replication in a specified
time unit. Here, type 8 and select Hours in its Time Units (directly to the right
of Replication Length)
- Base Time Unit: defines time units for reporting, status bar, simulation time
and animated plots. All time delays, replication length will be converted to
this base time unit. Here, select Hours.
4.2 Running a simulation
You can start the simulation run simply by clicking the Go ( ) button in the standard toolbar
or clicking the Run > Go menu. If you have a valid model, then Arena continues to run the
simulation. If your model is not valid, Arena lets you know that with error messages.
Once the simulation starts to run, some animation will be displayed as the simulation
progresses. As shown in the following figure, entities in a box shape (as specified in Entity
data module) move from one module to another. Below the each module, number of entities
created, in processing, and disposed are displayed. At the top of the Process module,
displayed is the status of the queue of the resource (number of waiting entities) with entity
pictures. In this figure, there are four entities in Process module, among them, one entity is
actually being processed by the resource and three entities are waiting at the queue.
8. 8
If you don’t want to see the animation anymore during the simulation run, click the Fast
Forward ( ) button to run the simulation as fast as possible without animation update. Also
you can start the simulation run via the Run > Fast-Forward menu.
4.3 Reviewing the output reports
At the end of the simulation run, a message box will prompt to ask you whether you would
like to view the reports. Clicking Yes displays the reports as shown below.
In the Reports panel, you can see the list of reports provided by Arena. By clicking one of
them, you can see the corresponding report. The above figure shows the Category by
Replication report which provides the output results for each replication. As we specified in
Run Setup > Project Parameter, statistics are collected in four categories (Entity, Process,
Queue, and Resource) in addition to the system category (default statistics collected by
Arena).
The statistics provided in Arena’s reports can be classified into three types of statistics:
Tally statistics: it refers to the statistics such as average, minimum, or maximum of a
series of numbers. For example, the average and maximum of the total time in the
system of entities are 0.1145 hour and 0.3123 hour, respectively.
Time-persistent statistics: it refers the statistics such as time average, minimum, or
maximum of a plot of something during the simulation run. The time average is the
accumulated area under the plotted curve divided by the simulation length. For
example, one of time-persistent statistics is the average of the number of entities in
the queue at the machine that can be found in the Queue Other Number Waiting
of the report tree located to the left of the report. Also, the instantaneous utilization of
the resource (Resource Usage Instantaneous Utilization) is one of the time-
persistent statistics.
Counter statistics: it refers to the statistics of accumulated sum of something. One of
the counter statistics is the number of entities that entered or left the system which
can be found in Entity Other Number In or Number Out of the report tree.
According to the figure above, ninety jobs entered the system and eighty-nine of them
left the system.