Download as PDF, PPTX

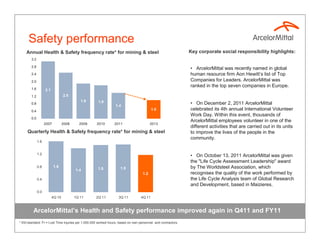


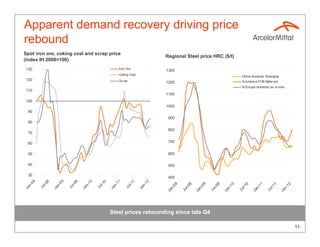
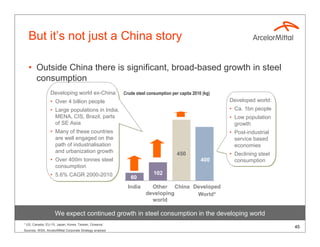
![Apparent demand receded in 4Q’11
Global Apparent Steel Consumption (ASC)* US and European Apparent Steel Consumption (ASC)**
(million tonnes per month) (million tonnes per month)
55 17
Developing ex China EU27
China USA
50
Developed 15
45
13
40
11
35
9
30
7
25
5
20
15 3
07 7 08 8 09 9 10 0 11 1
07
08
09
10
11
7
8
9
0
1
l-0 l-0 l-0 l-1 l-1
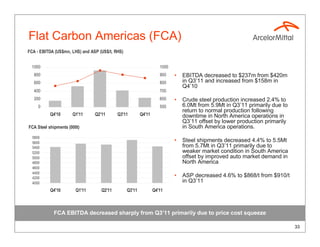
l-0
l-0
l-0
l-1
l-1
n- n- n- n- n- n-
n-
n-
n-
n-
Ja Ju Ja Ju Ja Ju Ja Ju Ja Ju
Ju
Ju
Ju
Ju
Ju
Ja
Ja
Ja
Ja
Ja
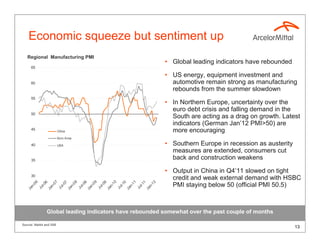
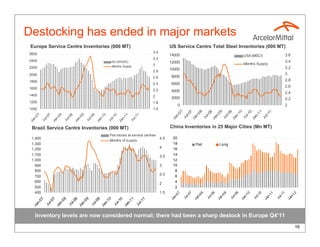
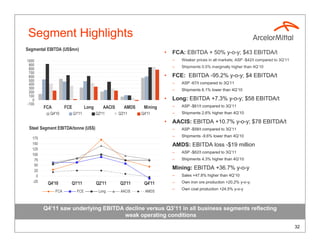
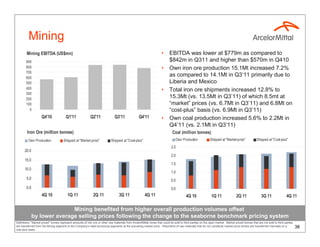
• Global ASC -5.2% in 4Q11 vs. 3Q11 [+2% y-o-y] • EU ASC -3.4% in 4Q11 vs.3Q11 [-4.9% y-o-y]
• China ASC -10.2% in 4Q11 vs. 3Q11 {+0.2% y-o-y] • US ASC -4.2% in 4Q11 vs. 3Q11 [+13.6% y-o-y]
Global ASC fell in 4Q 2011 v 3Q 2011
* ArcelorMittal estimates
** AISI, Eurofer and ArcelorMittal estimates 12](https://image.slidesharecdn.com/arcelormittalpresentationinvestorsroadshow-130118061523-phpapp01/85/Arcelormittal-presentation-investors_roadshow-13-320.jpg)


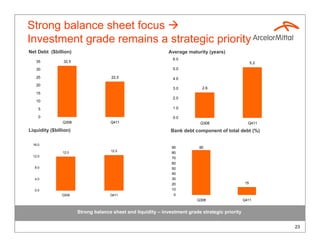
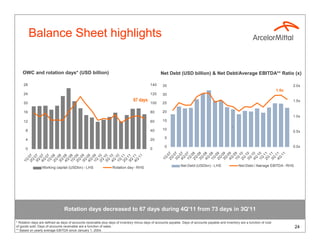
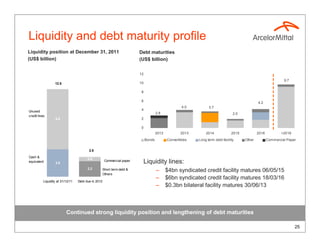
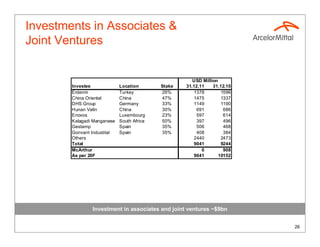


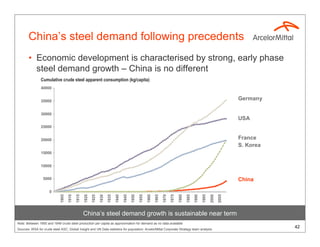

This document provides an overview and analysis of ArcelorMittal's Q4 2011 results and full year 2011 performance. It discusses ArcelorMittal's core strengths, safety performance, financial results including EBITDA and net debt, production levels, proposed dividend, and outlook for 2012. The presentation also analyzes trends in the global steel market and apparent steel consumption.


