Download to read offline


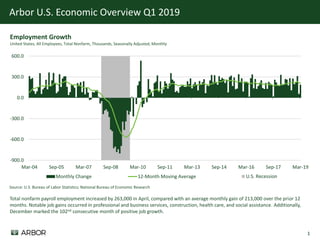
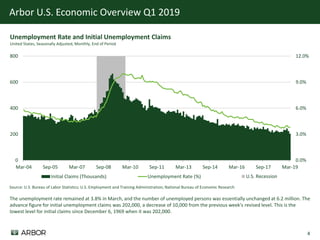
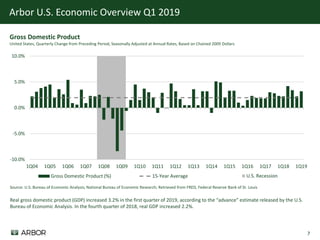

The U.S. economic overview for Q1 2019 highlights a significant increase in nonfarm payroll employment with a monthly gain of 263,000 jobs in April, marking 102 consecutive months of job growth. The unemployment rate remained stable at 3.8%, while the real GDP growth was reported at 3.2% for the first quarter. Despite positive employment trends, challenges related to housing affordability and rising consumer prices were noted, emphasizing a complex economic landscape.


