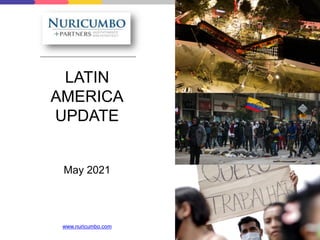
Our Newsletter. Mexico & Latin America. May 2021.
•
0 likes•1,029 views

Nuricumbo + Partners is specialized on subjects such as financial due diligence for M&A, special audits, independent process assessments, debt/equity solutions, on-demand financial talent, anti-corruption initiatives, enterprise risk management, and corporate governance. We have become trusted business advisors for companies of all sizes, providing direct support to CEOs and CFOs in special or confidential projects.

Recommended
Recommended
More Related Content
What's hot
What's hot (20)
Similar to Our Newsletter. Mexico & Latin America. May 2021.
Similar to Our Newsletter. Mexico & Latin America. May 2021. (20)
More from Nuricumbo + Partners
More from Nuricumbo + Partners (20)
Recently uploaded
Recently uploaded (20)
Our Newsletter. Mexico & Latin America. May 2021.
- 2. GLOBAL PERSPECTIVE Issues Optimistic Neutral Pesimistic 2020 Economic Fall -4.0% -4.4% -5.0% 2021 Economic Growth 6.5% 6.0% 5.3% Total Vaccinations (Estimated 2021) 5,863 Million 5,330 Million 4,264 Million % of population vaccinated (Estimated 2021) 73% 67% 53% Oil Price (2021) $55 $60 $80 USA - China Despite the natural conflicts between an emerging power and a hegemonic power, cooperation prevails. "New Cold War" develops but with different levels and nuances. Conflict leads to important military clashes in the South China Sea and fast escalation of cyberwar. K-Shaped Recovery The recovery of the economy across the world, driven by the United States, turns out to be stronger than expected. K-Shaped recovery continues. Hard hit sectors suchas tourism, travel and entertainment gradually recover. Recovery is strong but certain sectors fall behind and new inequalities are created in the world economy. 20% Estimated Scenario 1 Optimistic 65% Estimated Scenario 2 Neutral 15% Estimated Scenario 3 Pesimistic
- 3. LATIN AMERICA PERSPECTIVE Issues Optimistic Neutral Pesimistic 2020 Economic Fall -6.5% -7.7% -9.0% 2021 Economic Growth 5.2% 4.6% 3.2% Unemployment 9.5% 10.6% 12.5% PIB per Capita (USD per annum) 10,000 9,000 7,000 Inequality (Gini) 0.45 0.47 0.51 Herd Immunity Mid 2022 Early 2023 Mid 2024 15% Estimated Scenario 1 Optimistic 60% Estimated Scenario 2 Neutral 25% Estimated Scenario 3 Pesimistic
- 4. NORTH AMERICA PERSPECTIVE Issues Optimistic Neutral Pesimistic 2020 Economic Fall Mexico: -7.5% USA: -4.0% Canada: -6.5% Mexico: -8.5% USA: -4.3% Canada: -7.1% Mexico: -10.0% USA: -5.0% Canada: -7.5% 2021 Economic Growth México: 6.7% Estados Unidos: 7.0% Canadá: 6.1% México: 5.0% Estados Unidos: 6.4% Canadá: 5.0% México: 3.2% Estados Unidos: 3.5% Canadá: 3.0% Time to Herd Immunity México: 300 days Estados Unidos: 75 days Canadá: 200 days México: 375 days Estados Unidos: 100 days Canadá: 120 days México: 500 days Estados Unidos: 120 days Canadá: 150 days USMCA Alignment reached in policies, interests and visions between the three trading partners. There are controversies. Some investments are canceled. Labor disputes bring noise to the relationship. Labor, environmental and regulatory disputes prove disruptive for most investments. Cooperation The three governments agree on a pragmatic agenda that seeks to create regional prosperity. Little progress at the regional level. USA too busy with domestic priorities. Elections in Mexico and Canada produce totally divergent views. Canada and the USA align and forget Mexico. Energy Policy Mexico’s mid-term elections produce a more diverse political balance that stops major policy changes. Confidence in the Mexican economy is badly damaged, impacting foreign direct investments. Mexico’s recent changes in energy policies results in major legal disputes under USMCA rules. 20% Estimated Scenario 1 Optimistic 50% Estimated Scenario 2 Neutral 30% Estimated Scenario 3 Pesimistic
- 5. MEXICO PERSPECTIVE Issues Optimistic Neutral Pesimistic 2020 Economic Fall -7.5% -8.5% -11.0% 2021 Economic Growth 6.7% 5.0% 3.2% Interest Rate 3.25% 4.0% 5.0% Inflation 3.2% 4.5% 4.9% Exchange Rate (USD/MXN) 19.0 22.0 25.0 Mid-Term Elections Peaceful and plural elections. Diverse Congress. More power sharing. Institutional order prevails. Clean elections. Morena with no clear majority in congress. Other political parties win some states. Controversial elections. Presidential intervention. Consolidation of Party of State. Power concentration produces a more radical agenda. Pemex Pemex without crisis. Sovereign credit rating remains stable. Pemex without crisis but financial bomb keeps ticking. Sovereign credit rating deteriorates slightly. Pemex becomes a major issue and there is significant impact on sovereign credit rating. 15% Estimated Scenario 1 Optimistic 50% Estimated Scenario 2 Neutral 35% Estimated Scenario 3 Pesimistic
- 6. $5.60 $5.63 $5.44 $0.00 $2.50 $5.00 $7.50 February March April Brazil Exchange Rates $3,620.72 $3,731.91 $3,733.55 $0.00 $1,500.00 $3,000.00 $4,500.00 February March April Colombia $20.86 $20.44 $20.24 $0.00 $10.00 $20.00 $30.00 February March April Mexico $3.65 $3.76 $3.79 $0.00 $1.50 $3.00 $4.50 February March April Peru Source: Exchange Rates UK, 2021. *USD / PEN *USD / MXN *USD / CLP *USD / BRL *USD / COP $723.89 $720.54 $710.67 $0.00 $300.00 $600.00 $900.00 February March April Chile *USD / CLP $89.85 $91.98 $93.48 $0.00 $30.00 $60.00 $90.00 $120.00 February March April Argentina *USD / ARS
- 7. Source: Argentina, Brazil, Colombia, Chile, Mexico and Peru Central Banks, 2021. 38.50% 40.70% 42.60% 0.00% 15.00% 30.00% 45.00% January February March Argentina Inflation Rate 4.56% 5.20% 6.10% 0.00% 2.50% 5.00% 7.50% December January February Brazil 2.40% 2.60% 2.38% 0.00% 0.90% 1.80% 2.70% 3.60% February March April Peru 1.60% 1.56% 1.51% 0.00% 1.00% 2.00% 3.00% January February March Colombia 3.10% 2.80% 2.90% 0.00% 1.50% 3.00% 4.50% January February March Chile 3.54% 3.76% 4.67% 0.00% 2.00% 4.00% 6.00% January February March Mexico
- 8. $39,718 $39,520 $40,360 $0 $15,000 $30,000 $45,000 $60,000 February March April Argentina International Reserves $355,620 $355,416 $356,070 $0 $120,000 $240,000 $360,000 $480,000 January February March Brazil $59,001 $58,975 $58,901 $0 $18,000 $36,000 $54,000 $72,000 January February March Colombia $39,562 $40,220 $42,282 $0 $13,000 $26,000 $39,000 $52,000 February March April Chile $195,270 $194,934 $195,268 $0 $60,000 $120,000 $180,000 $240,000 February March April Mexico $76,029 $80,930 $80,343 $0 $25,000 $50,000 $75,000 $100,000 February March April Peru *Million U.S. Dollars *Million U.S. Dollars *Million U.S. Dollars *Million U.S. Dollars *Million U.S. Dollars *Million U.S. Dollars Source: Argentina, Brazil, Colombia, Chile, Mexico and Peru Central Banks, 2021.
- 9. 48,432.27 47,982.39 49,056.10 0 16,000 32,000 48,000 64,000 February March April Argentina Capital Markets 110,035.17 116,633.72 118,893.84 0 35,000 70,000 105,000 140,000 February March April Brazil 1,359.48 1,316.81 1,250.65 0 500 1,000 1,500 2,000 February March April Colombia 44,592.91 47,246.26 48,009.72 0 12,000 24,000 36,000 48,000 February March April Mexico 4,573.37 4,898.09 4,511.48 0 1,500 3,000 4,500 6,000 February March April Chile *IPSA:IND *MEXBOL:IND *SPBLPGPT:IND *MERVAL:IND *IBOV:IND *COLCAP:IND Source: Trading Economics, Yahoo Finance, 2021. 22,530.22 21,372.03 19,562.77 0 7,000 14,000 21,000 28,000 February March April Peru *SPBLPGPT:IND
- 10. Foreign Direct Investmet $11,517 $11,873 $6,663.00 $0 $4,000 $8,000 $12,000 2017 2018 2019 Argentina $68,885 $78,162 $69,174 $0 $30,000 $60,000 $90,000 2017 2018 2019 Brazil $13,836 $11,535 $14,314 $0 $5,000 $10,000 $15,000 $20,000 2017 2018 2019 Colombia $6,128 $7,323 $11,928 $0 $4,000 $8,000 $12,000 2017 2018 2019 Chile $33,030 $37,682 $29,354 $0 $12,000 $24,000 $36,000 $48,000 2017 2018 2019 Mexico $6,860 $6,488 $8,892 $0 $3,000 $6,000 $9,000 $12,000 2017 2018 2019 Peru Source: The World Bank, 2021. *BoP, Million U.S. Dollars at Current Prices
- 11. Credit Ratings Argentina CCC (March 9, 2021) Source: Fitch Ratings, 2021. Brazil BB- With NEGATIVE Outlook (November 18, 2020) Colombia BBB- With NEGATIVE Outlook (November 6, 2020) Chile A- With STABLE Outlook (March 24, 2021) Mexico BBB- With STABLE Outlook (November 11, 2020) Peru BBB+ With NEGATIVE Outlook (December 15, 2020)
- 12. Credit Ratings Argentina Ca With STABLE Outlook (September 28, 2020) Source: Moody’s Investors Service, 2021. Brazil Ba2 With STABLE Outlook (May 15, 2020) Colombia Baa2 With NEGATIVE Outlook (December 3, 2020) Chile A1 With NEGATIVE Outlook (August 25, 2020) Mexico Baa1 With NEGATIVE Outlook (April 29, 2021) Peru A3 With STABLE Outlook (June 25, 2019)
- 13. Credit Ratings Argentina CCC+ With STABLE Outlook (September 7, 2020) Source: Standard & Poor’s, 2021. Brazil BB- With STABLE Outlook (December 10, 2020) Colombia BBB- With NEGATIVE Outlook (April 22, 2021) Chile A With STABLE Outlook (March 24, 2021) Mexico BBB With NEGATIVE Outlook (December 3, 2020) Peru BBB+ With STABLE Outlook (November 23, 2020)
- 14. Country Presidents Argentina President: Alberto Fernandez Birth: April 2, 1959 In Office Since: December 10, 2019 Political Party: Frente de Todos Brazil President: Jair Bolsonaro Birth: March 21, 1955 In Office Since: January 1, 2019 Political Party: PSL Colombia President: Ivan Duque Marquez Birth: August 1, 1976 In Office Since: August 7, 2018 Political Party: Centro Democratico Chile President: Sebastian Piñera E. Birth: December 1, 1949 In Office Since: March 11, 2018 Political Party: Independent Mexico President: Andres Manuel Lopez O. Birth: November 13, 1953 In Office Since: December 1, 2018 Political Party: Morena Peru President: Francisco Sagasti Birth: October 10, 1944 In Office Since: November 17, 2020 Political Party: Partido Morado
- 15. Mid-term elections in Mexico will be a referendum on the Lopez Obrador administration
- 16. Political impact of Mexico City subway accident still difficult to predict
- 17. Democracy is under pressure across the region
- 18. An effort to push tax reforms created violent clashes in Colombia
- 19. Except for Argentina and Venezuela, inflation is mostly under control in Latam
- 20. The region continues to face high COVID-19 mortality rates
- 21. Emerging markets will continue to benefit from demographic advantages
- 22. WE ARE NURICUMBO + PARTNERS
- 23. COMPANY PROFIT Our Firm at a glance Key Facts Industries • 50+ CONSULTANTS • MULTIDISCIPLINARY • BIG 4 BACKGROUND • INTERNATIONAL EXPOSURE • ACTIVE ACROSS MEXICO • ABLE TO TRAVEL • FLEXIBILITY • BILINGUAL / BICULTURAL Professional Organizations Our Service Portfolio • MANUFACTURING • FINANCIAL SERVICES • PROFESSIONAL SERVICES • TRADING • RETAIL • ADVERTISING • EDUCATION • PRIVATE EQUITY • FAMILY BUSINESS • MEXICAN INSTITUTE OF PUBLIC ACCOUNTANTS • MEXICO CITY ACCOUNTANCY BOARD • MEXICAN INSTITUTE OF FINANCIAL EXECUTIVES • ILLINOIS ACCOUNTANCY BOARD • AMERICAN CHAMBER OF COMMERCE • EXTERNAL AUDIT • INTERNAL AUDIT • PART TIME CFO’S • INTERIM MANAGEMENT • FORENSIC • TAX • TRANSFORMATIONS • ADVISORY BOARD For more information: www.nuricumbo.com BANAMEX FONATUR Y&R ZIMAT NOKIA CIT PFIZER METLIFE LESAFFRE PWC DELOITTE IPG BOMBARDIER BANORTE +GF+ MERLIN KANDEO SGS 1985 1990 2000 2003 2010 2013 2014 2017 2020 Professional Careers History Experience as Independent Consultant Experience as Consulting Group
- 24. WE SUPPORT SENIOR MANAGEMENT IN THE RESOLUTION OF SPECIAL OR CONFIDENTIAL PROJECTS. Ideal to tackle those projects that are crucial but sometimes difficult to deliver internally. Teams of highly experienced consultants. Our consultants have on average 20/25 years of professional experience. Reduced learning curve / More productivity. High degree of flexibility. Solid specialization in Finance, Audit, Tax and Accounting. Big Four / Big Consulting background. Who are we?
- 25. Internal and External Audit. Special reviews (financial, process, operational, compliance, forensic, etc.) Financial Due Diligence for M&A. Tax Compliance. Comisarios. Board Members. Advisory Board. Interim C-Level Executives (CEOs, CFOs, etc.) Interim Project Teams. Specialized Training Programs. Debt/Equity Solutions. Fintech Trusts (Fideicomisos). How do we help some of our clients?
- 27. José Treviño Academic Background • El Colegio de México. International Relations. 1975. • IPADE. Business Management. 1989. Work History Nuricumbo + Partners. Consultant. 2016 – Present. AmeriCompass, S.C. Managing Partner. 2001 – Present. Investment Board. Managing Director. Vice President. 1999 – 2001 NAFTA Office, DC. Economic Counselor Mexico. 1991 - 1999. Summary José has wide public and private sector professional experience. He has advised the Mexican Government and U.S. and Canadian investors –particularly mining companies- to achieve their trade and investment goals in the NAFTA region. Calling upon a wealth of public and private sector contacts, José specializes in advising foreign investors to establish or expand their presence in Mexico and in acting as interim or permanent Country Manager. He is currently President of the Mexico-Canada Business Committee at the Mexican Council for Foreign Trade, Investment and Technology (COMCE), a Mexican private sector organization dedicated to promoting Mexican exports and attracting foreign direct investment to Mexico. COMCE interacts with leading business associations across the globe. José has also had important leadership roles in public and private projects in sectors such as brokerage, mining, transportation, and nuclear energy. Languages Spanish - Native English – Fluent French – Fluent Systems Experience Microsoft Office Industry Experience Government International Organizations Investments Trade Functional Experience Consultant Director Vice President
- 28. WHAT WE THINK Biden Administration and Mexico The Strategy in Times of Covid What to Expect from 2021 Winning an election does not resolve our problems The reinvention of big global cities North America: From shared prosperity to failed state Who will win the U.S. elections? Will we avoid another lost decade? Inequality is not a good business The Lebanese mirror Wirecard, external audit and the public interest OUR YOUTUBE CHANNEL Book Review: Why Nations Fail Book Review: The Value of Everything To be a leader, but for the right reasons Vestiga Consultores: Información y pandemia Historic Lessons of the 1918 Pandemic Willingness to Pay & Value Stick James Francum – Perspective from Germany Toshiyuki Yasui: Chief Happiness Officer Oscar Becerril: Cómo superar COVID-19 OTHER Riesgo Global: Relación Estados Unidos - China Mexico’s Top 25 CFO’s of 2017 ¿Por qué medir la confianza económica? Nuricumbo + Partners in the Media
- 30. Land Area Source: The World Bank, 2018. 2,736,690 8,358,140 1,109,500 743,532 1,943,950 1,280,000 0 1,000,000 2,000,000 3,000,000 4,000,000 5,000,000 6,000,000 7,000,000 8,000,000 9,000,000 Argentina Brazil Colombia Chile Mexico Peru Note: Kilometers
- 31. Ease of Doing Business Index 126 124 67 59 60 76 0 20 40 60 80 100 120 140 Argentina Brazil Colombia Chile Mexico Peru Source: The World Bank, 2019. Note: 1 = Most Business-friendly Regulations
- 32. Population Growth 1.0% 0.8% 1.4% 1.2% 1.1% 1.6% 0% 1% 1% 2% 2% Argentina Brazil Colombia Chile Mexico Peru Source: The World Bank, 2019. Note: Annual Percentage
- 33. Total Population 44,938.7 211,049.5 50,339.4 18,952.0 127,575.5 32,510.5 0 50,000 100,000 150,000 200,000 250,000 Argentina Brazil Colombia Chile Mexico Peru Source: The World Bank, 2019. Note: (i) Thousands; (ii) Total Inhabitants
- 34. Urban Population 92% 87% 81% 88% 80% 78% 0% 20% 40% 60% 80% 100% Argentina Brazil Colombia Chile Mexico Peru Source: The World Bank, 2019. Note: Percentage of Total Population
- 35. Poverty Headcount Ratio 1.5% 4.6% 4.9% 0.3% 1.7% 2.2% 0% 1% 2% 3% 4% 5% Argentina Brazil Colombia Chile Mexico Peru Source: The World Bank, 2017 - 2019. Note: (i) At US$1.90 / Day; (ii) Percentage of Population
- 36. Exports of Goods and Services 17.4% 14.3% 15.8% 28.2% 38.8% 24.2% 0.0% 10.0% 20.0% 30.0% 40.0% 50.0% Argentina Brazil Colombia Chile Mexico Peru Source: The World Bank, 2019. Note: Percentage of GDP
- 37. Gross Domestic Product $445,445.2 $1,839,758.0 $323,615.9 $282,318.2 $1,268,870.5 $226,848.1 $0 $300,000 $600,000 $900,000 $1,200,000 $1,500,000 $1,800,000 $2,100,000 $2,400,000 Argentina Brazil Colombia Chile Mexico Peru Source: The World Bank, 2019. Note: Millions, Current US$
- 38. GDP Per Capita $23,040.3 $15,300.0 $16,012.4 $27,002.3 $20,994.0 $13,416.4 $0.0 $5,000.0 $10,000.0 $15,000.0 $20,000.0 $25,000.0 $30,000.0 Argentina Brazil Colombia Chile Mexico Peru Source: The World Bank, 2019. Note: (i) PPP; (ii) Current International $
- 39. GDP Growth -2.1% 1.1% 3.3% 1.1% -0.1% 2.2% -3% -2% -1% 0% 1% 2% 3% 4% 5% Argentina Brazil Colombia Chile Mexico Peru Source: The World Bank, 2019. Note: Annual Percentage
- 40. Gross Savings 15.8% 12.2% 15.7% 18.9% 23.7% 19.1% 0% 5% 10% 15% 20% 25% Argentina Brazil Colombia Chile Mexico Peru Source: The World Bank, 2019. Note: Percentage of GDP
- 41. Personal Remittances $0.0 $10,000.0 $20,000.0 $30,000.0 $40,000.0 $528.3 $3,213.6 $6,761.9 $70.0 $39,021.8 $3,326.0 Source: The World Bank, 2019. Note: (i) Received; (ii) Millions, Current US$
- 42. Total Reserves $44,880.6 $356,886.4 $52,652.7 $40,655.5 $183,056.1 $67,711.5 $0.0 $50,000.0 $100,000.0 $150,000.0 $200,000.0 $250,000.0 $300,000.0 $350,000.0 $400,000.0 Argentina Brazil Colombia Chile Mexico Peru Source: The World Bank, 2019. Note: (i) Includes Gold; (ii) Millions, Current US$
- 43. Revenue 18.8% 29.7% 24.2% 21.4% 18.6% 19.6% 0% 5% 10% 15% 20% 25% 30% Argentina Brazil Colombia Chile Mexico Peru Source: The World Bank, 2019. Note: (i) Excluding Grants; (ii) Percentage of GDP
- 44. Government Expenditure on Education 5.5% 6.3% 4.5% 5.4% 4.5% 3.8% 0% 2% 4% 6% 8% Argentina Brazil Colombia Chile Mexico Peru Source: The World Bank, 2017 - 2019. Note: Percentage of GDP
- 45. Labor Force Source: The World Bank, 2020. 19,180.3 99,843.0 24,802.3 8,859.8 53,978.6 16,182.3 0 20,000 40,000 60,000 80,000 100,000 120,000 Argentina Brazil Colombia Chile Mexico Peru Note: Thousands
- 46. Labor Force (Female) 43.3% 43.9% 42.7% 42.4% 38.5% 45.8% 0% 10% 20% 30% 40% 50% 60% Argentina Brazil Colombia Chile Mexico Peru Source: The World Bank, 2019. Note: Percentage of Total Labor Force
- 47. Unemployment 11.7% 13.7% 15.4% 11.5% 4.7% 6.2% 0% 3% 6% 9% 12% 15% 18% Argentina Brazil Colombia Chile Mexico Peru Source: The World Bank, 2020. Note: (i) Percentage of Total Labor Force; (ii) Modeled ILO Estimate
- 48. Energy Use Source: The World Bank, 2014 - 2015. 2,030 1,496 724 2,006 1,537 790 0 500 1,000 1,500 2,000 2,500 Argentina Brazil Colombia Chile Mexico Peru Note: Kg of Oil Equivalent per Capita
- 49. Renewable Electricity Output 28.1% 74.0% 68.2% 43.6% 15.4% 52.7% 0% 10% 20% 30% 40% 50% 60% 70% 80% Argentina Brazil Colombia Chile Mexico Peru Source: The World Bank, 2015. Note: Percentage of Total Electricity Output
- 50. Population Living in Slums 14.7% 16.3% 27.8% 8.8% 16.0% 33.1% 0% 10% 20% 30% 40% Argentina Brazil Colombia Chile Mexico Peru Source: The World Bank, 2018. Note: Percentage of Urban Population
- 51. External Debt Stocks 65.3% 31.8% 44.2% 38.1% 29.7% 0% 10% 20% 30% 40% 50% 60% 70% Argentina Brazil Colombia Chile Mexico Peru Source: The World Bank, 2019. Note: Percentage of GNI
- 52. Bank Capital to Assets Ratio 13.5% 10.2% 17.0% 7.5% 11.0% 12.9% 0% 3% 6% 9% 12% 15% 18% Argentina Brazil Colombia Chile Mexico Peru Source: The World Bank, 2019. Note: Percentage
- 53. Bank Nonperforming Loans to Total Gross Loans 5.7% 3.1% 4.2% 2.1% 2.1% 3.4% 0% 1% 2% 3% 4% 5% 6% Argentina Brazil Colombia Chile Mexico Peru Source: The World Bank, 2019. Note: Percentage
- 54. Deposit Interest Rate 47.3% 5.4% 4.5% 2.5% 3.5% 3.7% 0% 5% 10% 15% 20% 25% 30% 35% 40% 45% 50% Argentina Brazil Colombia Chile Mexico Peru Source: The World Bank, 2019. Note: Percentage
- 55. Lending Interest Rate 67.3% 37.5% 11.8% 4.2% 8.4% 14.4% 0% 10% 20% 30% 40% 50% 60% 70% Argentina Brazil Colombia Chile Mexico Peru Source: The World Bank, 2018 - 2019. Note: Percentage
- 56. Listed Domestic Companies Source: The World Bank, 2019. 91 324 66 203 139 196 0 50 100 150 200 250 300 350 400 Argentina Brazil Colombia Chile Mexico Peru Note: Total
- 57. Market Capitalization of Listed Domestic Companies $39,393.54 $1,187,361.69 $132,040.28 $203,791.65 $413,618.82 $98,964.96 $0.0 $200,000.0 $400,000.0 $600,000.0 $800,000.0 $1,000,000.0 $1,200,000.0 Argentina Brazil Colombia Chile Mexico Peru Source: The World Bank, 2019. Note: (i) Millions; (ii) Current US$
- 58. Strength of Legal Rights Index Source: The World Bank, 2019. 2 2 11 4 10 7 0 2 4 6 8 10 12 Argentina Brazil Colombia Chile Mexico Peru Note: 0 = Weak to 12 = Strong
- 59. Military Expenditure 1.9% 3.9% 11.0% 7.2% 2.0% 5.4% 0% 2% 4% 6% 8% 10% 12% 14% Argentina Brazil Colombia Chile Mexico Peru Source: The World Bank, 2019. Note: Percentage of General Government Expenditure
- 60. We care about your business priorities. Let’s talk! E-mail: contacto@nuricumbo.com Mobile/Whatsapp: + 52 (155) 5453 6309 Skype: nuricua Twitter: @a_nuricumbo Office: Montes Urales 424 Lomas de Chapultepec, CDMX Please visit our website