Download as PDF, PPTX

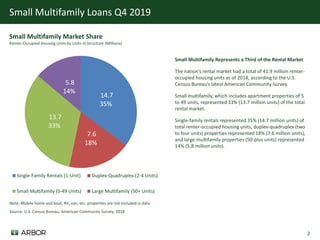
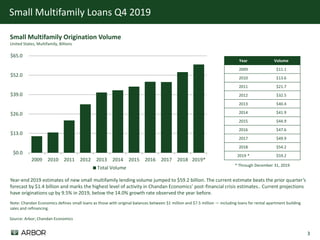
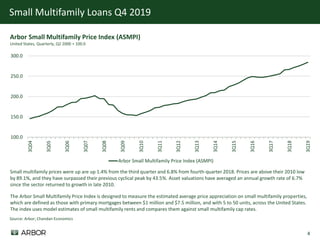
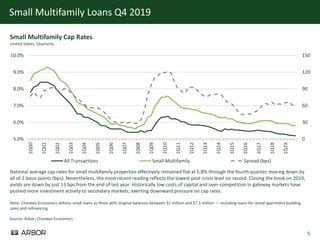
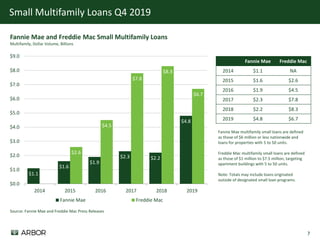
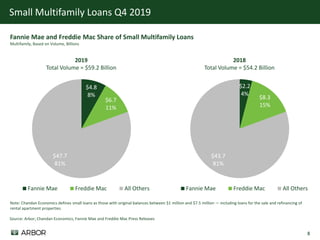

Small multifamily properties, defined as having between 5-49 units, represent a significant portion of the rental market. They accounted for 33% of renter-occupied housing units in 2018. Origination volumes for small multifamily loans were estimated to be $59.2 billion in 2019, up 9.5% from the previous year. Small multifamily property prices increased 6.8% from the fourth quarter of 2018, while capitalization rates remained largely unchanged at 5.8%. Fannie Mae and Freddie Mac played a growing but still relatively small role in the small multifamily lending market, originating a combined $11.5 billion or 19% of total small multifamily loan volume in 2019.


![Cmf access to_finance_rural_powerpoint_march14_final[1]](https://cdn.slidesharecdn.com/ss_thumbnails/cmfaccesstofinanceruralpowerpointmarch14final1-110413042616-phpapp01-thumbnail.jpg?width=640&height=640&fit=bounds)


