Download as PDF, PPTX
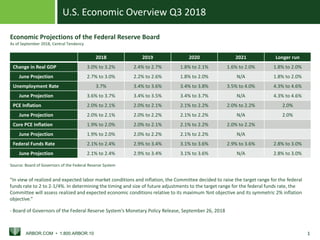
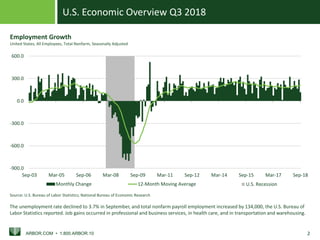
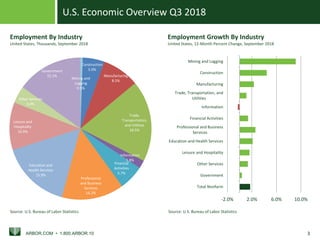
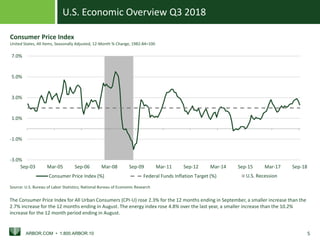
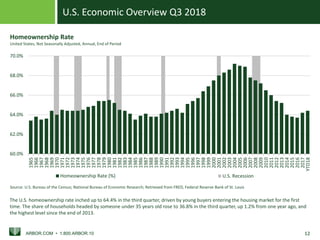
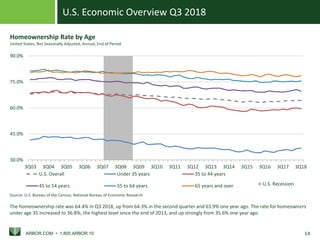

The U.S. economic overview for Q3 2018 reports a GDP growth of 3.5% and a declining unemployment rate to 3.7%, alongside employment increases in various sectors. Inflation, measured by the Consumer Price Index, rose by 2.3% over the year, influenced by rising energy costs, while the Federal Reserve has set a target range for the federal funds rate between 2% and 2.25%. Additionally, the homeownership rate increased to 64.4%, driven by first-time buyers under 35 years of age.


