Download to read offline

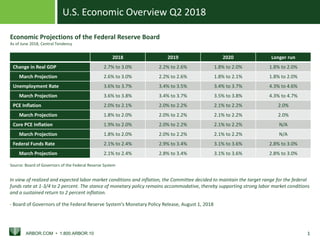
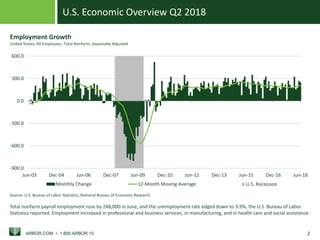
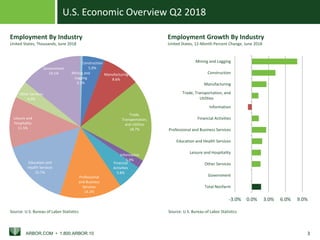
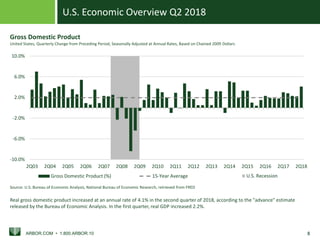
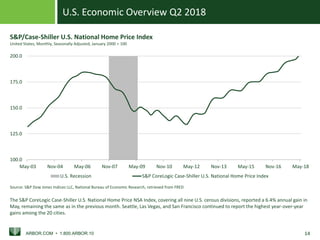

The Federal Reserve projects real GDP growth of 2.7-3.0% in 2018, with unemployment falling to 3.6-3.7% and inflation rising but remaining near 2%. In Q2 2018, real GDP increased at an annual rate of 4.1% while unemployment declined slightly. Job growth was strong in professional services and manufacturing. Home prices continue rising nationally at over 6% annually according to the S&P CoreLogic Case-Shiller index.


